Uncertainty Quantification and Global Sensitivity Analysis of Radiated Susceptibility in Multiconductor Transmission Lines using Adaptive Sparse Polynomial Chaos Expansions
Yu Zhu1, Yinhao Wang1, Quanyi Yu1, Dayong Wu1, 2, Yang Zhang1*, and Tong Zhang3
1College of Instrumentation and Electrical Engineering
Jilin University, Changchun, 220000, 130061 China
zhuyu202114@126.com, wangyinhao202020@126.com, qyyu20@mails.jlu.edu.cn, wudy20@mails.jlu.edu.cn, *zhangyang19@jlu.edu.cn
2EMC Center
FAW-Volkswagen Automotive Company Ltd., Changchun, 220000, 130061 China
wudy20@mails.jlu.edu.cn
3Network Department, Changchun Branch,
China Mobile Communications Corporation Jilin Company Ltd, Changchun, 220000, 130061 China
zhangtong201919@126.com
Submitted On: January 18, 2021 Accepted On: July 7, 2021
Abstract
This study analyzes the uncertainties of the radiated susceptibility in multiconductor transmission lines (MTLs), and introduces an adaptive sparse polynomial chaos expansion combining hyperbolic truncation scheme with orthogonal matching pursuit method (AS-PCE (OMP)). This method is used as the basis to realize the uncertainty quantification (UQ) of radiated susceptibility and global sensitivity analysis (GSA) of input variables to output variables. GSA considers the influencing factors of the incident field and transmission-line geometric parameters. The global sensitivity indices of each input variable are calculated for varying impedance loads. The accuracy and efficiency of the proposed method are verified compared with the results of the polynomial chaos expansion based least angle regression method and Monte Carlo methods.
Index Terms: adaptive sparse polynomial chaos expansion, multiconductor transmission lines (MTLs), radiated susceptibility, uncertainty quantization.
I. INTRODUCTION
Recently, considerable literature has grown up around the theme of multiconductor transmission lines (MTLs) radiated susceptibility uncertainty analysis. Given the change of the electromagnetic environment where electronic equipment is located, the electromagnetic interference that equipment receives through the field-line coupling will be uncertain. Owing to the production process, actual layout, and environmental factors (e.g., temperature) of the transmission lines in the equipment, the transmission-line geometric parameters also have uncertainties, which likewise affects electromagnetic interference. The aforementioned reasons have prompted engineers to consider these uncertainties when designing the electromagnetic compatibility of products. Moreover, researchers are considerably interested in the uncertainty quantification (UQ) of the model and global sensitivity analysis (GSA) of input variables. Numerous methods, such as Monte Carlo (MC) [1], stochastic reduced order models [2], probabilistic immunity [3], support vector machine [4], first- and second-order reliability [5], gradient boosting algorithms [6], Bayesian optimization [7], stochastic collocation [8], and polynomial chaos expansions (PCE) [9]-[12] have been successfully applied to UQ and GSA of EMC in MTLs. MC method is a classical uncertainty numerical analysis method. Although the calculation results are accurate, convergence speed is slow and calculation cost is high, and MC is often used as a comparison method of new methods.
The PCE has developed rapidly in recent years, and uses orthogonal polynomials of random input variables to establish surrogate model for uncertainty analysis. Under the premise of ensuring the accuracy of calculation, PCE can effectively improve the efficiency of calculation. Some experts combined the generalized polynomial chaos expansions with least angle regression method as bases to analyze uncertainties and global sensitivity of PCB-radiated susceptibility [13]. The current research used the PCE as basis to combine the hyperbolic truncation scheme and orthogonal matching pursuit method. Accordingly, adaptive sparse polynomial chaos expansions (AS-PCE (OMP)) is established to realize UQ and GSA of the transmission line radiated susceptibility.
The remainder of this paper is organized as follows. Section II introduces the physical model of the research. Section III presents AS-PCE (OMP) theory. Section IV analyzes the simulation results of AS-PCE (OMP) theory on UQ and GSA, and compares them with those of MC and adaptive sparse polynomial chaos expansion based on Least Angle Regression (AS-PCE(LARS)).
II. PHYSICAL MODEL
In order to analyze which of the geometric variables and incident field variables of the transmission lines has a greater impact on the radiation sensitivity under the low and high impedance conditions in low-frequency band, the uncertainties of radiation sensitivity of MTLs are studied in this paper, particularly for a (2+1) transmission-line system with ground as reference conductor. As shown in Figure 1, the uncertain factors include the variables involved in the incident field and geometric parameters of the transmission lines. In particular, E, , , and are the field amplitude, elevation angle, polarization angle, and azimuth angle of the incident plane wave, respectively. The geometric parameters of the transmission line include the length L, radius r, heights h and h above ground, and transverse distance d between the two transmission lines. The impedance loads of transmission lines are R. This study uses MTLs theory [14] to calculate the radiated susceptibility in transmission lines.
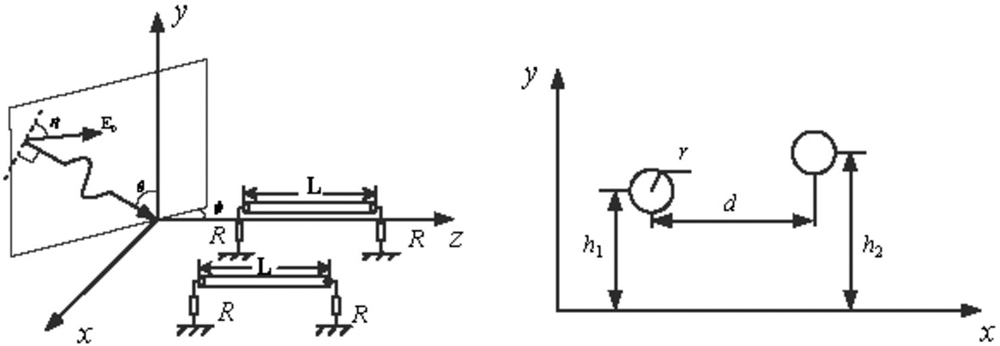
Fig. 1. Incident field and MTLs model.
III. PCE METHODOLOGY
Polynomial chaos originated from the homogeneous function in Wiener theory, then the Askey scheme extended PCE to more variable distribution types [15].
The original model is set as and is , which is the set of d-dimensional input variables. The model can be expressed in the form of polynomial chaos expansion as follows:
| (1) |
where are multivariate polynomials orthonormal, is a multidimensional index set that can identify multidimensional polynomial , is composed of the tensor product of the orthogonal polynomials corresponding to the d-dimensional single variables (i.e., ),are unknown coefficients of expansion, and is the total number of components after the truncation of order p. The highest order of each polynomial in the standard truncation scheme is the sum of the corresponding polynomial orders of each single variable: .
A. Sparse polynomial chaos expansion based on hyperbolic truncation and orthogonal matching pursuit
The effects of the sparsity and hierarchy principles of the model [16] indicate that the low-order effect in the model is more important than the high-order effect. The hyperbolic truncation scheme can use norm q to deal with the model sparsely: , where . When q = 1, the effect of the hyperbolic truncation corresponds exactly to the standard truncation.
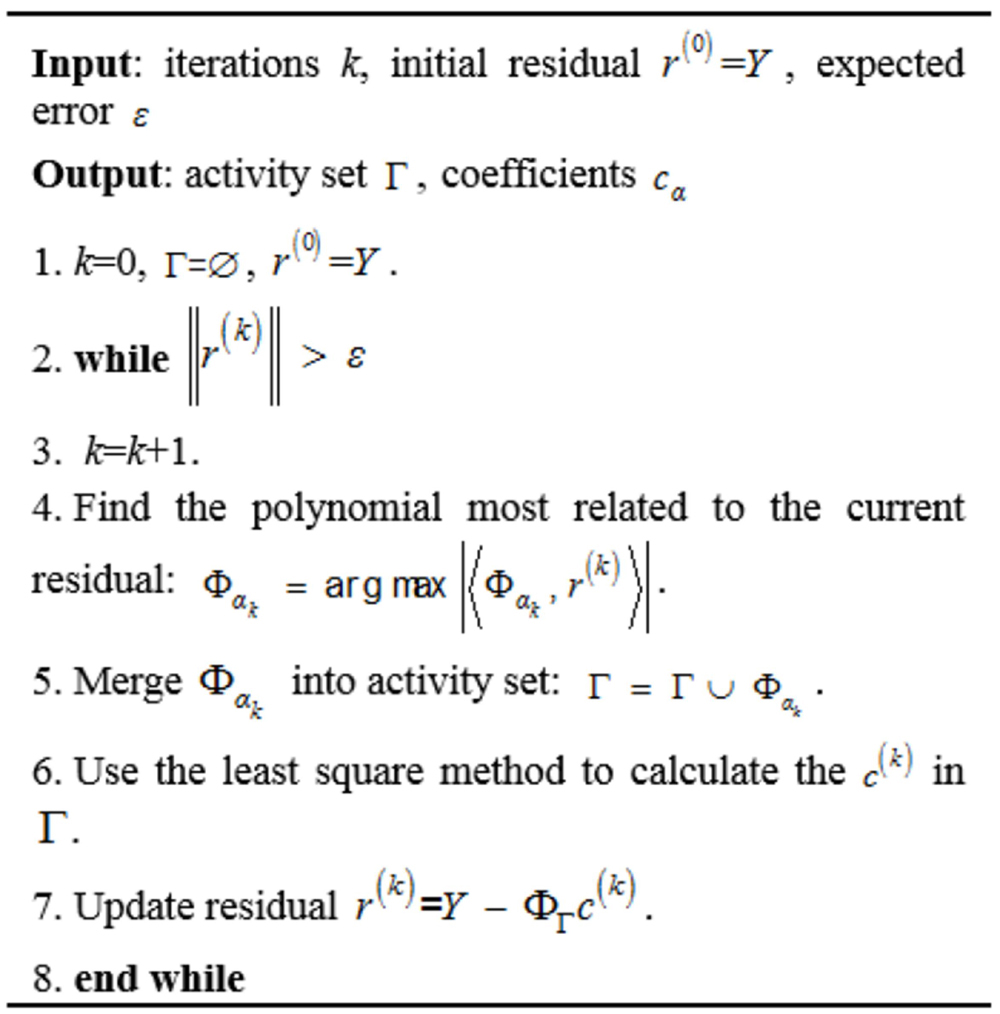
When calculating , this study uses the OMP to further sparse the model. This method uses the idea of greedy iteration to calculate the polynomial elements basis that are most related to the current residual. Moreover, using such a technique can minimize the residual and effectively sparse the model. The main steps of the OMP algorithm are as follows:
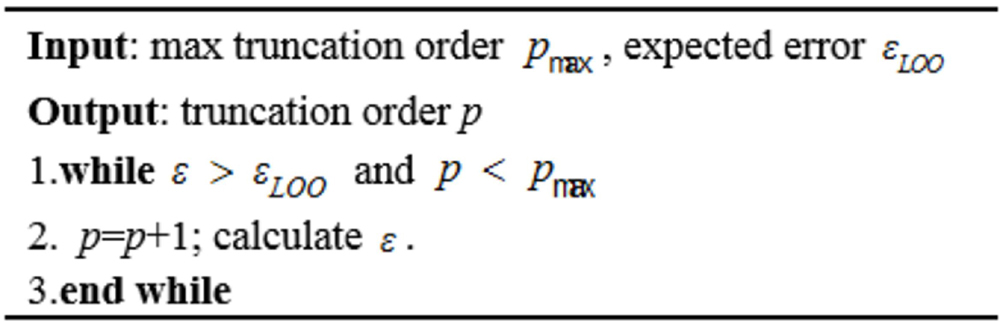
B. Truncated order p-adaptive method based on the leave-one-out error
When the OMP is used to calculate the coefficients of expansion, an adaptive algorithm based on the leave-one-out error is used to select the truncation order p and verify the accuracy of the model. can be expressed as follows:
| (2) |
where (x) is the response value of the model at point x of the ith metamodel, (x) is the response value of the PCE at the ith metamodel x, and is the mean. After the p is selected using the adaptive algorithm, a sparse polynomial chaos surrogate model can be established, which can be used for efficient uncertainty analysis. The main steps of the adaptive selection algorithm are as follows:
C. Statistical moment calculation and Sobol global sensitivity analysis based on PCE
Given the orthogonality of the basis function in the PCE, the mean and variance of the output Y can be obtained as follows:
| (3) |
| (4) |
When the PCE is combined with the Sobol global sensitivity analysis method [17], which is based on the idea of variance decomposition, the first-order sensitivity indices and total sensitivity indices of the random input variables can be expressed as follows:
| (5) |
| (6) |
where ,
IV. NUMERICAL EXAMPLE RESULT
We will combine the numerical example of the MTLs to verify and analyze the previously described method. Combined with the physical model discussed in section II, the random input variables are made to follow different random distribution. Take the common uniform distribution and normal distribution as examples, the ranges of input parameters are , , , , , , , and . The transmission-line loads can be divided into two cases: low impedance (50 ) and high impedance (10 k).
A. Uncertainty analysis
In the following, we combine AS-PCE (OMP) to analyze the uncertainties of the transmission lines with low and high impedance loads at frequency 50 MHz. To this end, we choose Latin hypercube sampling (LHS) as the sampling method. In order to select the appropriate sample size, different sampling sizes: 50, 100, 200, 300, 400, 500, 600, 700, and 800 are calculated for 50 times to estimate confidence intervals for . Considering the cost and accuracy of calculation, we let the q-norm be 0.8 [18].
It can be shown in Figure 2, the median of 600 samples size is acceptable and nearly the same as 700. Given the calculation time is basically the same for different impedance, we compare the time taken for 50 times of calculation at 600, 700, and 800 with low impedance:
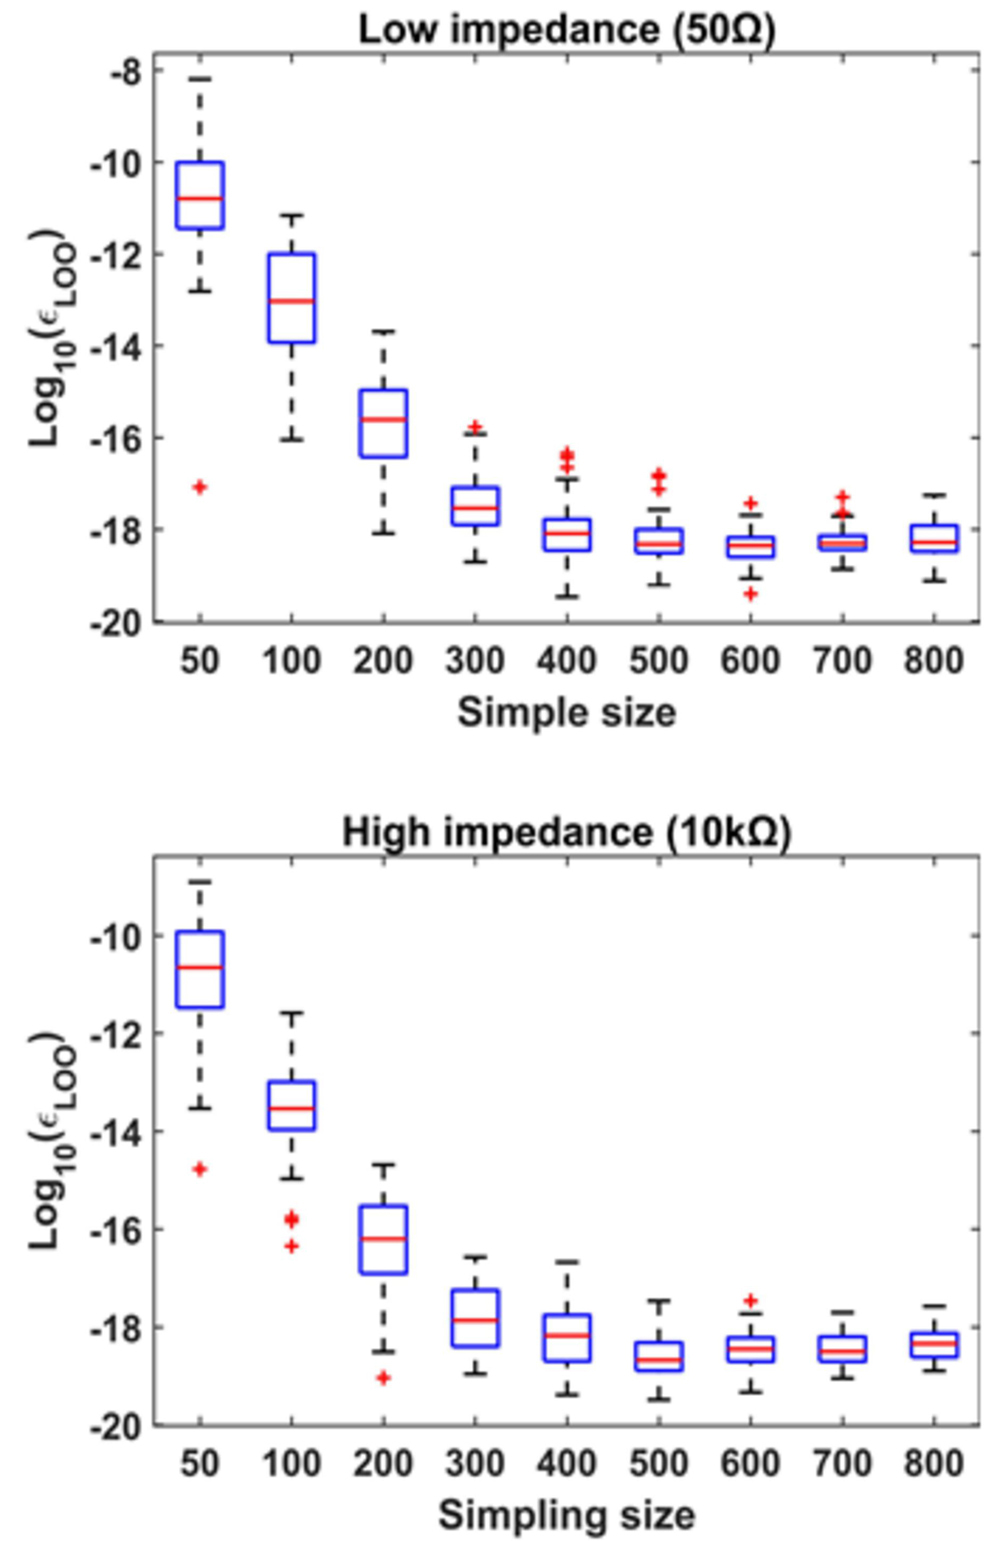
Fig. 2. of different sampling sizes.
All simulations in this paper were carried out on a standard laptop computer with an Intel Core i5 CPU operating at 2.3 GHz and equipped with 8 GB memory. It can be shown in Table 1 that the calculation time of 600 samples is shorter on the premise of sufficient calculation accuracy. In this case, the maximum truncation degree p is 12. Therefore, 600 LHS samples is considered as a good tradeoff between accuracy and numerical cost to constructed the surrogate model.
Table 1: Calculation time comparison
| Sampling size | Time/s |
| 600 | 526.74 |
| 700 | 732.22 |
| 800 | 1015.31 |
The probability distribution of the induced current of the low and high impedance loads calculated using the different methods at frequency 50 MHz is shown in Figure 3.
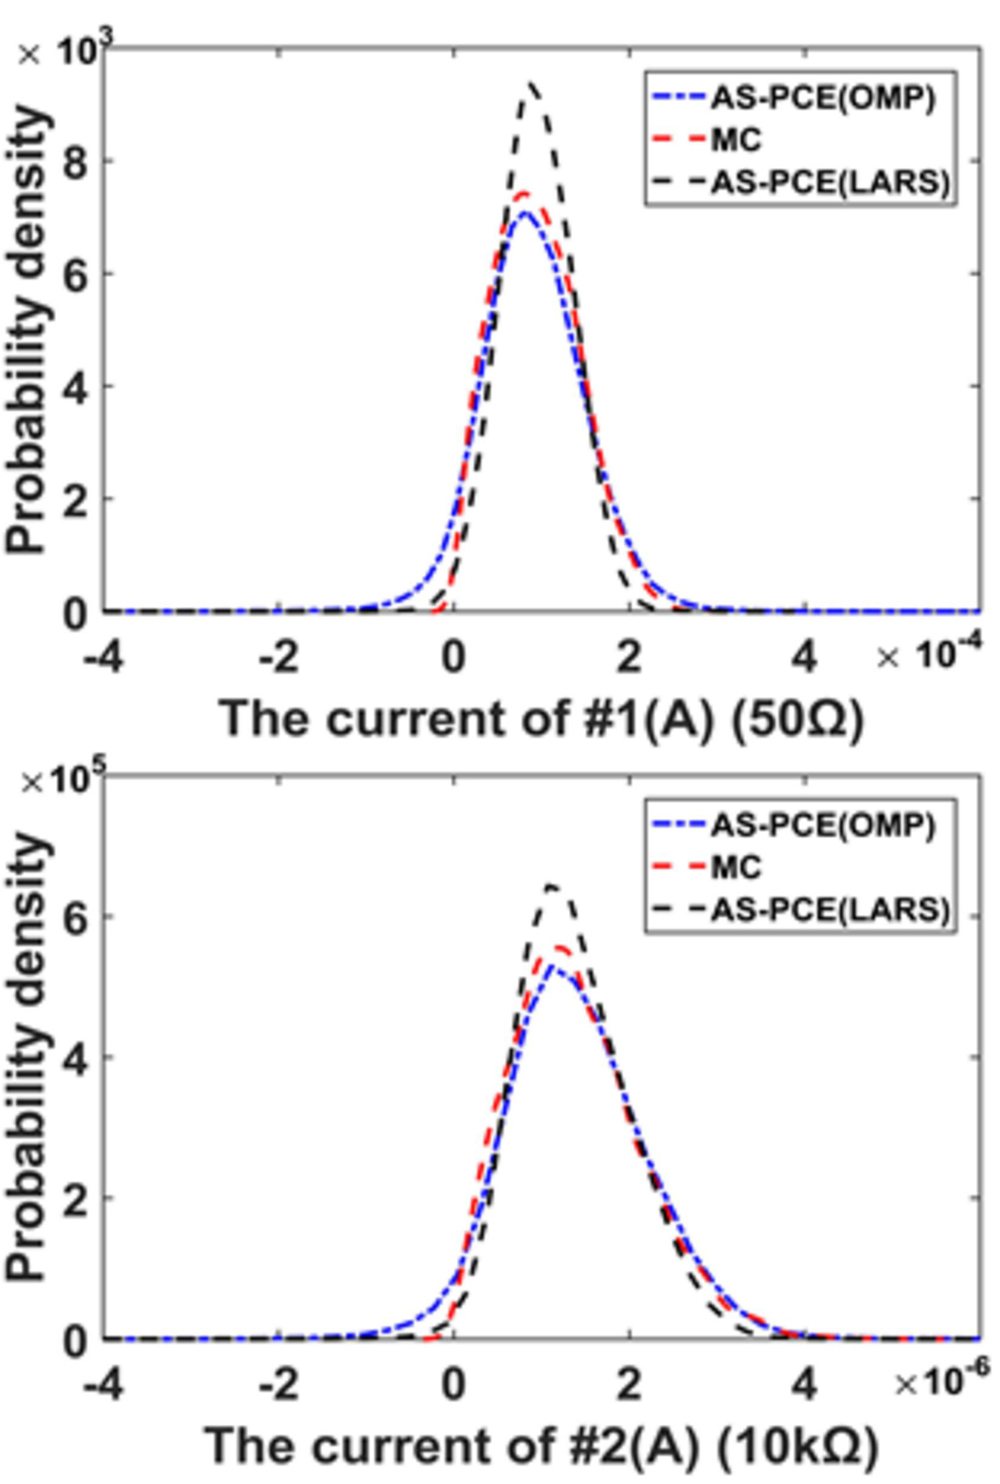
Fig. 3. Comparison of the probability distribution of the induced current with low and high impedances.
In the same selection range of the adaptive truncation order p, the minimum of AS-PCE (OMP) is 3.01 10, while the minimum of AS-PCE (LARS) is 0.088. Note that the calculation accuracy of AS-PCE (OMP) is considerably higher than that of AS-PCE (LARS). This is because AS-PCE (OMP) is a greedy algorithm, and it will find the most relevant vector in each iteration, so the accuracy of AS-PCE (OMP) is higher than AS-PCE (LARS). We compare the calculation efficiency of the two methods at the same :
Table 2: Calculation efficiency comparison
| Time/s | ||
| AS-PCE (OMP) | 0.095 | 3.73 |
| AS-PCE (LARS) | 0.092 | 26.86 |
| MC (10k) | —— | 1037.77 |
Note that when of AS-PCE (OMP) approximates of AS-PCE (LARS), the calculation time of the former is substantially less than that of the latter. Therefore, AS-PCE (OMP) is considerably efficient and has more advantages in calculation.
We likewise calculate the mean and standard deviation of the induced current of low impedance loads (50 ) and high impedance loads (10 k) in the [10 MHz, 200 MHz]. The results are compared with the AS-PCE (LARS) and 10k MC simulations.
As shown in Figure 4, AS-PCE (OMP) can effectively calculate the statistical information of transmission-line radiated susceptibility compared with AS-PCE (LARS) and 10k MC simulations. Given that OMP adopts the greedy iteration method, there will be a slight overfitting phenomenon when calculating the expansion coefficients with the least square method, thereby resulting in a slightly large mean square deviation.
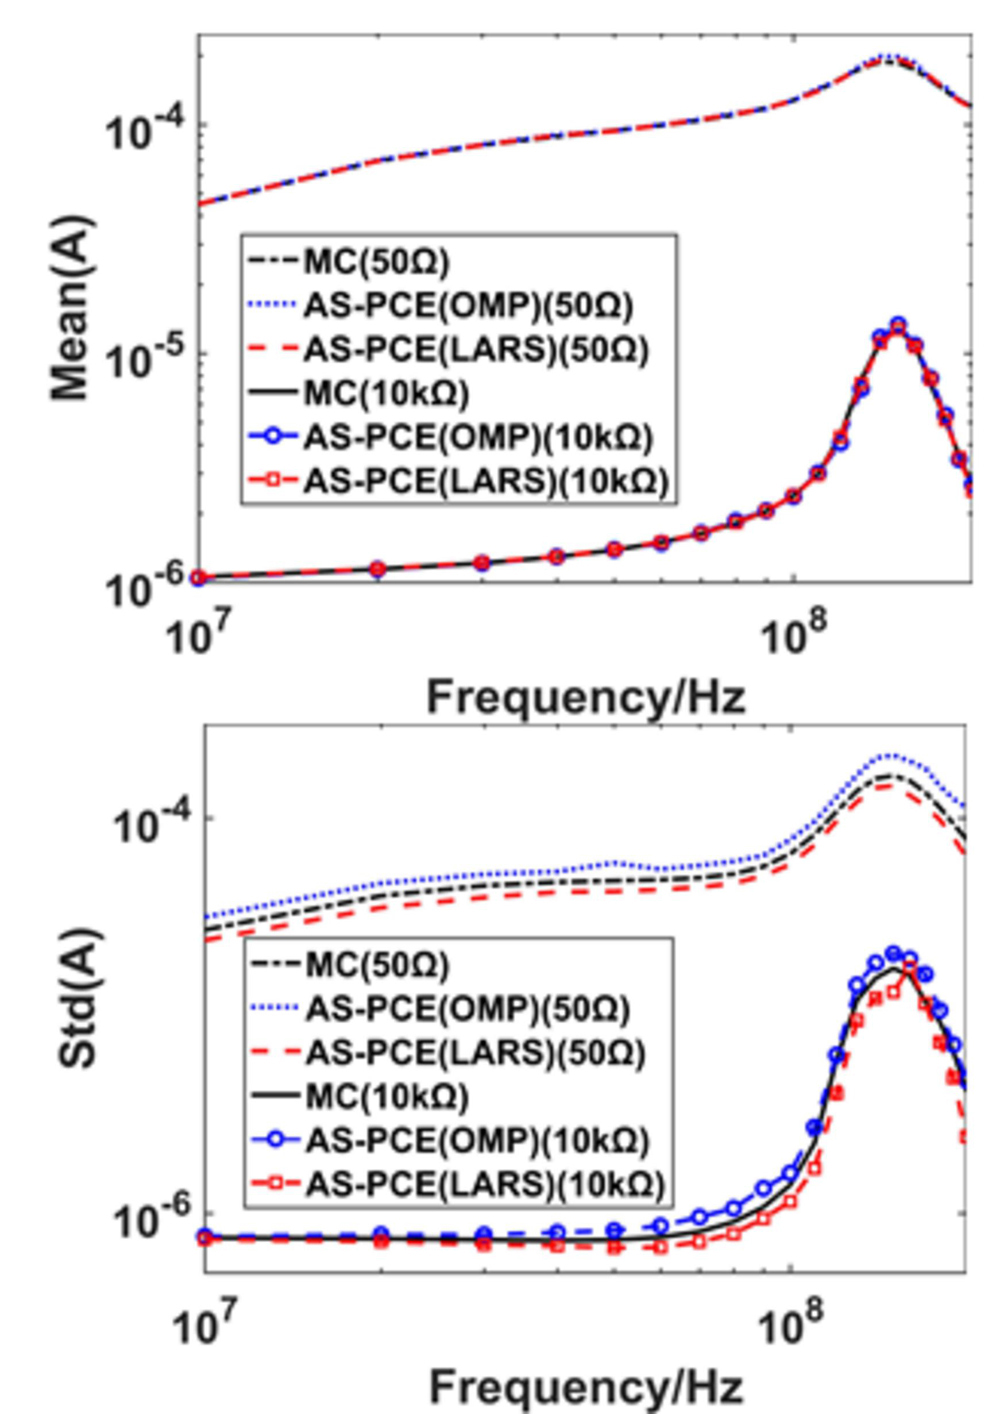
Fig. 4. Comparison of the mean and standard deviation of the induced current between low and high impedance loads.
B. Sensitivity analysis
On the basis of the method described in section 3, the global sensitivity of each uncertain variable in the transmission-line radiated susceptibility is calculated and analyzed. The results are compared with the 10k MC simulations. First, we use 50 MHz as an example to calculate the total sensitivity indices of each variable.
As shown in Figure 5, the method described in section 3 can effectively calculate the global sensitivity indices of each variable of the transmission-line radiated susceptibility. Moreover, the global sensitivity indices of the variables of the incident field at 50 MHz is significantly higher than that of the transmission-line geometric parameters, whether it is a low or high impedance loads. For further comparative analysis, the total sensitivity indices of each input variable in [10 MHz, 200 MHz] are calculated based on AS-PCE (OMP) and their influence degrees are compared.

Fig. 5. Comparison of the total sensitivity indices between low and high impedances.
Figure 6 shows that in the low impedance loads condition, the transmission-line geometric parameters in [10 MHz, 200 MHz] have minimal impact on the radiated susceptibility and nearly no impact in [10 MHz, 100 MHz]. Among the relevant parameters of the input field, the influence of and is greater, but the total sensitivity indices of in [150 MHz, 200 MHz] is relatively small. In the case of high impedance loads, the influence degree of the relevant parameters of the incident field is not as substantial as that of the low impedance loads. In [10 MHz, 100 MHz], has a high influence on the radiated susceptibility. In [100 MHz, 200 MHz], the variable that has the highest impact is length L, whereas the other geometric parameters of transmission lines have a low impact on the radiated susceptibility. Therefore, if the incident field is known in the early stage of product design, the influence of and of the incident field should be avoided. When the impedance loads of transmission lines are high, their length should be properly controlled to avoid EMC problems.
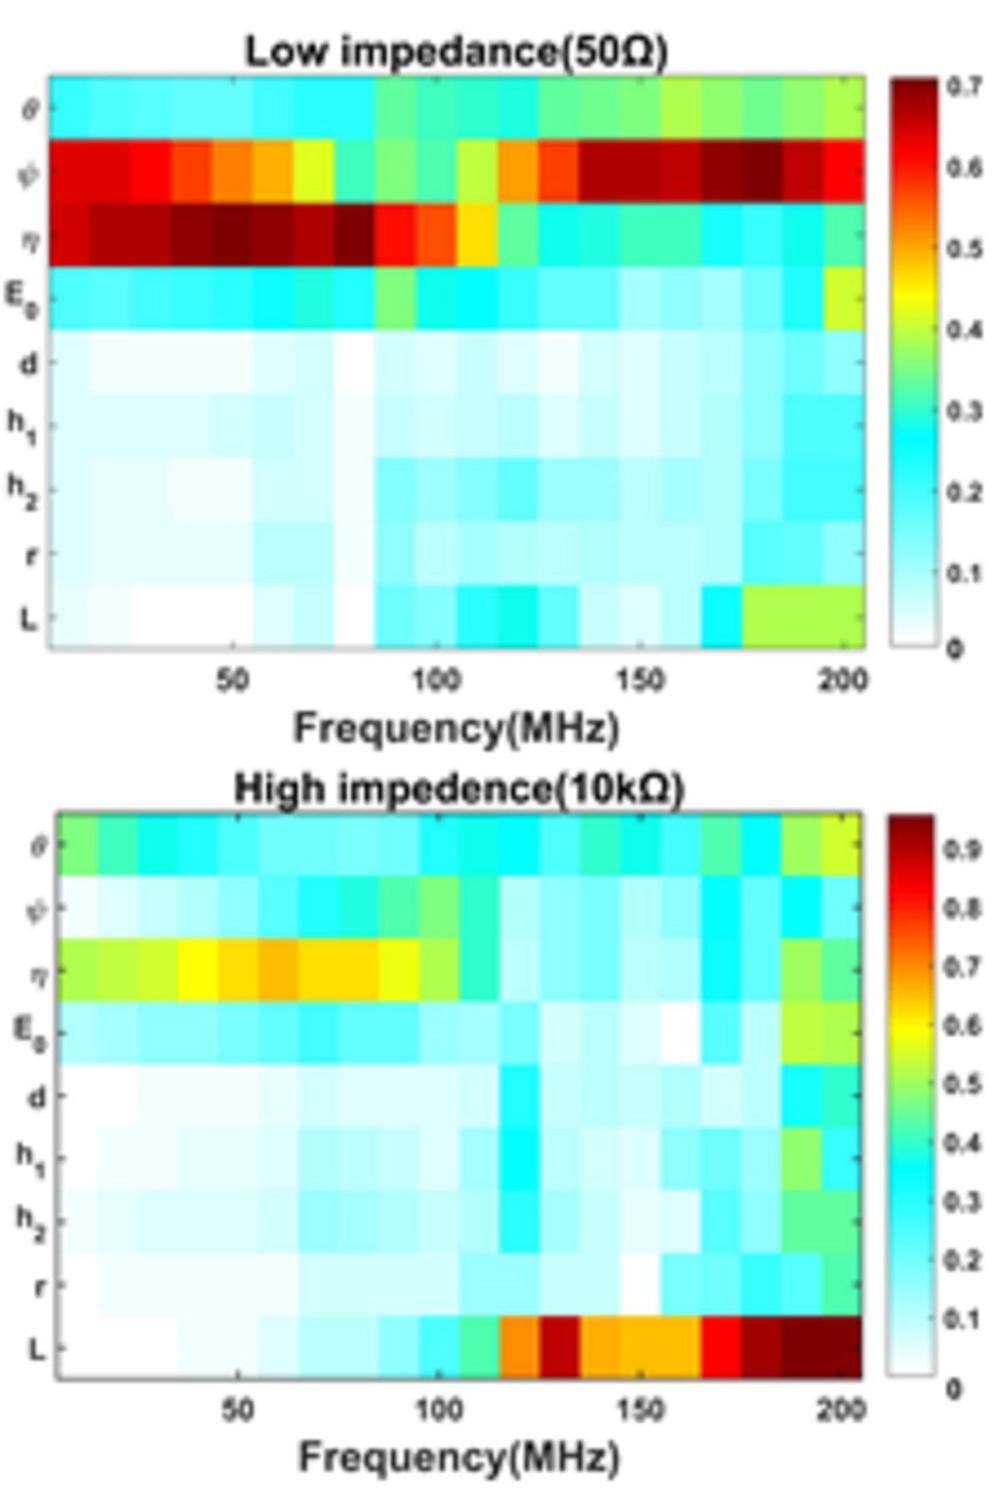
Fig. 6. Global sensitivity indices of each variable with frequency variation.
V. CONCLUSION
To analyze the uncertainties of the radiated susceptibility in MTLs, this study introduces a non-intrusive AS-PCE based on the OMP. The adaptive algorithm based on the leave-one-out error is used to determine the truncation order of the PCE. Combined with the hyperbolic truncation scheme, AS-PCE (OMP) is established. The proposed method is a greedy sparse algorithm, which is more efficient than MC method and has higher accuracy than the AS-PCE (LARS). It can ensure the accuracy of calculation and improve the efficiency of calculation, and can effectively calculate the statistical information of the radiated susceptibility of transmission lines with different impedance loads. Moreover, Sobol global sensitivity analysis is used to quantify the influence of each input variable on the radiated susceptibility. Compared with 10k simulation results of the MC method, AS-PCE (OMP) can be used to calculate at a lower cost and with evident advantages. Hence, the proposed method can be formulated in an efficient way for the EMC design of products.
ACKNOWLEDGMENT
This work was supported in part by the National Natural Science Foundation of China under Grant 51707080 and Grant No. 61903151, and in part by the Jilin Scientific and Technological Development Program under Grant 20180101032JC, Grant 20190103055JH, and Grant 20190303097SF.
REFERENCES
[1] S. Arianos, M. A. Francavilla, M. Righero, F. Vipiana, P. Savi, S. Bertuol, M. Ridel, and J. Parmantier, “Evaluation of the modeling of an EM illumination on an aircraft cable harness,” IEEE Trans. Electromagn. Compat., vol. 56, no. 2, pp. 844-853, Apr. 2014.
[2] Z. Fei, Y. Huang, J. Zhou, and C. Song, “Numerical analysis of a transmission line illuminated by a random plane-wave field using stochastic reduced order models,” IEEE Access, vol. 5, pp. 8741-8751, May 2017.
[3] D. Bellan and S. Pignari, “A probabilistic model for the response of an electrically short two-conductor transmission line driven by a random plane wave field,” IEEE Trans. on Electromagn. Compat., vol. 43, no. 2, pp. 130-139, May 2001.
[4] R. Trinchero, I. S. Stievano, and F. G. Canavero, “Black-box modeling of the maximum currents induced in harnesses during automotive radiated immunity tests,” IEEE Trans. Electromagn. Compat., vol. 62, no. 2, pp. 627-630, Apr. 2019.
[5] A. Kouassi, J. Bourinet, S. Lalléchère, P. Bonnet, and M. Fogli, “Reliability and sensitivity analysis of transmission lines in a probabilistic EMC context,” IEEE Trans. Electromagn. Compat., vol. 58, no. 2, pp. 561-572, Apr. 2016.
[6] H. Karami, A. Mostajabi, M. Azadifar, M. Rubinstein, C. Zhuang, and F. Rachidi, “Machine learning-based lightning localization algorithm using lightning-induced voltages on transmission lines,” IEEE Trans. Electromagn. Compat., vol. 62, no. 6, pp. 2512-2519, Dec. 2020.
[7] S. De Ridder, D. Spina, N. Toscani, F. Grassi, D. V. Ginste, and T. Dhaene, “Machine-learning-based hybrid random-fuzzy uncertainty quantification for EMC and SI assessment,” IEEE Trans. Electromagn. Compat., vol. 62, no. 6, pp. 2538-2546, Dec. 2020.
[8] T. Wang, W. Yan, L. Wang, and G. Zhang, “Uncertainty analysis of random field coupling to Stochastic cables,” Shenzhen, China, APEMC. IEEE, pp. 17-21, May 2016
[9] P. Manfredi and F. G. Canavero, “Polynomial chaos for random field coupling to transmission lines,” IEEE Trans. Electromagn Compat., vol. 54, no. 3, pp. 677-680, Jun. 2012.
[10] M. Larbi, I. S. Stievano, F. G. Canavero, and P. Besnier, “Variability impact of many design parameters: the case of a realistic electronic link,” IEEE Trans. Electromagn. Compat., vol. 60, no. 1, pp. 34-41, Jul. 2017.
[11] Q. Yu, W. Liu, K. Yang, X. Ma, and T. Wang, “Uncertainty quantification of the crosstalk in multiconductor transmission lines via degree adaptive stochastic response surface method,” Applied Computational Electromagnetics Society (ACES) Journal, vol. 36, no. 2, pp. 174-183, Feb. 2021.
[12] T. Wang, Q. Yu, X. Li, G. Le, and H. Zhao, “Radiated susceptibility analysis of multiconductor transmission lines based on polynomial chaos,” Applied Computational Electromagnetics Society (ACES) Journal, vol. 35, no. 12, pp. 1556-1566, Dec. 2020.
[13] T. Bdour and A. Reineix, “Global sensitivity analysis and uncertainty quantification of radiated susceptibility in PCB using nonintrusive polynomial chaos expansions,” IEEE Trans. Electromagn. Compat., vol. 58. no. 3, pp. 939-942, Jun. 2016.
[14] C. R. Paul, Analysis of Multiconductor Transmission Lines, 2nd ed. New York, NY, USA: Wiley, 2008.
[15] D. Xiu and G. E. Karniadakis, “Modeling uncertainty in flow simulations via generalized polynomial chaos,” J. Comput. Phys., vol. 187, no. 1, pp. 137-167, Oct. 2003.
[16] R. Mukerjee and C. F. J. Wu, A Modern Theory of Factorial Designs, New York: Springer, 2006.
[17] I. M. Sobol, “Sensitivity estimates for nonlinear mathematical models,” Math. Model. Comput. Exp., vol. 1, no. 1, pp. 112-118, Jan. 1993.
[18] M. Larbi, I. S. Stievano, F. G. Canavero, and P. Besnier, “Identification of main factors of uncertainty in a microstrip line network,” Prog. Electromagn. Res., vol. 162, pp. 61-72. Jan. 2018.
BIOGRAPHIES

Yu Zhu received the B.S. degree in electrical engineering and the M.S. degree in measuring and testing technologies and instruments from Jilin University, Changchun, Jilin, China, in 2010 and 2013, respectively, where he is currently pursuing the Ph.D degree with the College of Instrumentation and Electrical Engineering.
His research interests include the analysis method in electromagnetic compatibility simulation and the uncertainty analysis methods in electromagnetic compatibility simulation.

Yinhao Wang received the B.S. degree in electrical engineering from Jilin University, Changchun, Jilin, in 2020, where he is currently pursuing the M.S degree with the College of Instrumentation and Electrical Engineering.
His research interests include the analysis method in electromagnetic compatibility simulation and credibility evaluation of electromagnetic compatibility uncertainty simulation model.

Quanyi Yu received the B.S. degree in automation and the M.S. degree in instrument and meter engineering from Jilin University, Changchun, Jilin, China, in 2016 and 2020, respectively, where he is currently pursuing the Ph.D degree with the College of Instrumentation and Electrical Engineering.
His research interests include the analysis method in electromagnetic compatibility simulation and the uncertainty analysis methods in electromagnetic compatibility simulation.

Dayong Wu received the B.S. degree in electrical engineering and the M.S. degree in measuring and testing technologies and instruments from Jilin University, Changchun, Jilin, China, in 2010 and 2013, respectively, where he is currently pursuing the Ph.D degree with the College of Instrumentation and Electrical Engineering.
His research interests include the analysis method in automotive electromagnetic compatibility and the uncertainty analysis methods in electromagnetic compatibility simulation.

Yang Zhang received the B.S. degree and the M.S. degree in electrical engineering in physics college from northeast normal university, Changchun, Jilin, China, in 2012 and 2015, respectively, and the Ph.D degree in the College of Instrumentation and Electrical Engineering, Jilin University, Changchun, Jilin, China, in 2018.
His research interests include the analysis method in electromagnetic compatibility simulation and the uncertainty analysis methods in electromagnetic compatibility simulation.

Tong Zhang received the master’s degree from the Changchun University of Science and Technology, Changchun, Jilin, China, in 2013. He is currently an Engineer with the Changchun Branch, China Mobile, China. His research interests include the areas of network communication and optical communication.
ACES JOURNAL, Vol. 36, No. 10, 1288–1294.
doi: 10.13052/2021.ACES.J.361004
© 2021 River Publishers