Bi-Static Radar Cross-Section Test Method by using Historic Marconi Set-up and Time Gating
Yousef Azizi, Mohammad Soleimani, Seyed Hasan Sedighy, and Ladislau Matekovits
Department of Electrical Engineering, Iran University of Science and Technology, Tehran 1684613114, Iran
School of Advanced Technologies, Iran University of Science and Technology, Tehran 1684613114, Iran
Department of Electronics and Telecommunications, Politecnico di Torino, Turin 10129, Italy
Department of Measurements and Optical Electronics, Politehnica University Timisoara, Timisoara 300006, Romania
Istituto di Elettronica e di Ingegneria del, l’Informazione e delle Telecomunicazioni, National Research Council, Turin 10129, Italy
Submitted On: October 16, 2021; Accepted On: January 28, 2022
Abstract
In this paper, a low-cost, simple, and reliable bi-static radar cross-section (RCS) measurement method by using a historic Marconi set-up is presented. It uses a transmitting (Tx) antenna (located at a constant position, at a reference angle of ) and a moving receiver (Rx) antenna. A time gating method is used to extract the information from the reflection in the time domain; applying time filter allows removing the antenna side-lobe effects and other ambient noises. In this method, the Rx antenna (on the movable arm) is used to measure the reflected field in the angular range from to from the structure (printed circuit board, PCB) and the reference configuration represented by a ground (GND) plane of the same dimension. The time gating method is then applied to each pair of PCB/GND measurements to extract the bi-static RCS pattern of the structure at a given frequency. Here, a comparison of measurement results is carried out at 18 and 32 GHz with simulation ones indicating successful performance of the proposed method. It can be used as a low-cost, reliable, and available option in future measurement and scientificresearch.
Keywords: RCS Measurement, Marconi Set-Up, Time Gating.
I. INTRODUCTION
Radar cross-section (RCS) measurement is one of the essential requirements in the field of telecommunication engineering, of which evaluation is always controversial due to the existence of measurement errors, environmental noise, post-processing requirements to extract results, and expensive automation measuring equipment [1]. RCS was first discussed in the military field [2–4]. This concept was introduced in non-military applications in 1965 [5]. Accurate modeling and analysis of structures is a basic need in the design of radar cross-section reduction (RCSR) structures. For this purpose, physical optics (PO) analyses of small structures are an effective method for RCS estimation of small structures [6]. In [7], investigation of the RCS of finite frequency selective surface (FSS) has been presented and compared with the infinite size FSS, which is helpful for the design of FSS structures with low RCS. The RCS measurement techniques have been well presented in [8]. Performing RCS measurement in a laboratory requires hardware such as shielded chamber, absorbers, Tx/Rx antennas, radio frequency (RF) signal sources, and receivers [9]. Also, extracting and processing measurement information to eliminate background noise, antenna side-lobe effects, and other environmental reflection factors require using numerical techniques, such as time gating, which is well discussed in the literature, for example in [10]. Based on the optical theorem, the wideband RCS measurements method that uses a forward RCS of structure has been presented in [11]. The RCS measurement methods for static and dynamic facilities were presented in [12] and [13], respectively. By using spectral extrapolation technique, one can eliminate the end of band errors of RCS measurement, which is an appropriate technique in minimizing of the noise [14]. During the last decades, many methods, such as the method of moment (MOM), geometrical theory of diffraction (GTD), and PO have been proposed [15]. Moreover, many numerical tools such as finite element method (FEM), boundary element method, and software packages implementing a combination of them were developed to easily calculate the RCS of structures [16]. Bi-static RCS measurement by using some special equipment (synchronized Tx/Rx, source and receiver equipment, and moving rails) is expensive, and, therefore, only a few laboratories can measure it [17, 18]. To solve the problem of expensive automation set-ups, using Marconi training set-up can be effective as a simple and reliable solution in the static RCS measurement. The Marconi set-up, which is used as one of the teaching aids in laboratories, has a movable arm and an angled calibrator (protractor) whose rotation rate can be adjusted and controlled [19]. However, both automatic and manual solutions for RCS measurement are possible.
In this paper, a simple, cost-effective, and reliable numerical bi-static RCS measurement method is presented to extract the RCS results by mounting the Marconi set-up inside of the anechoic chamber and using the time gating method. In this measurement, the Tx antenna is placed in front of the printed circuit board (PCB) and GND of the sample structure, and the Rx antenna is moved manually on the rotating-angular calibrated arm to extract the reflection information at all angles from to for different frequencies. Then, the PCB/GND measurement information at each angle is post-processed, by converting them from frequency domain to time domain by using inverse fast Fourier transform (IFFT). The data are then time filtered and re-converted to the frequency domain by using FFT. The procedure is applied to data obtained from both PCB and GND reflections at each angle. The bi-static pattern is then extracted at each frequency. The measurement results and the results obtained from the numerical tools of CST Suite software are in good agreement with the IEEE 1502 recommended [16] (known as the main reference for RCS measurement). Comparison of simulation and measurement results of a sample structure indicates that this simple, reliable, and cost-effective test method could be used as a measurement method instead of the conventional automated test procedure that needs software automation for controlling the hardware (rail, Tx, and Rx antennas).
II. BI-STATIC TEST METHOD
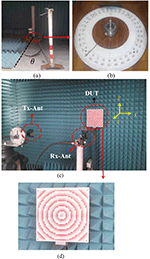
The Marconi test set-up as one of the oldest equipment in the communication laboratory is shown in Figure 1(a). This set-up has a central stand for placing the device under test (DUT) on it, ad a rotating and calibrated arm where the amount of rotation can be seen and controlled (see Figure 1(b) and (c)). To measure bi-static RCS, the Tx antenna is placed in front of the target at the same height as the DUT, while the Rx antenna is placed on the rotating arm at the same height. The RX antenna is rotating to cover any angle needed for the measurement of RCS, storing and processing the reflection signal from the target. The prototype of the sample metasurface for RCSR test is shown in Figure 1(d). The metasurface under test has a dimension of , and it is printed on a single layer grounded RO4003 substrate with 1.6-mm thickness(Figure 1(d)).
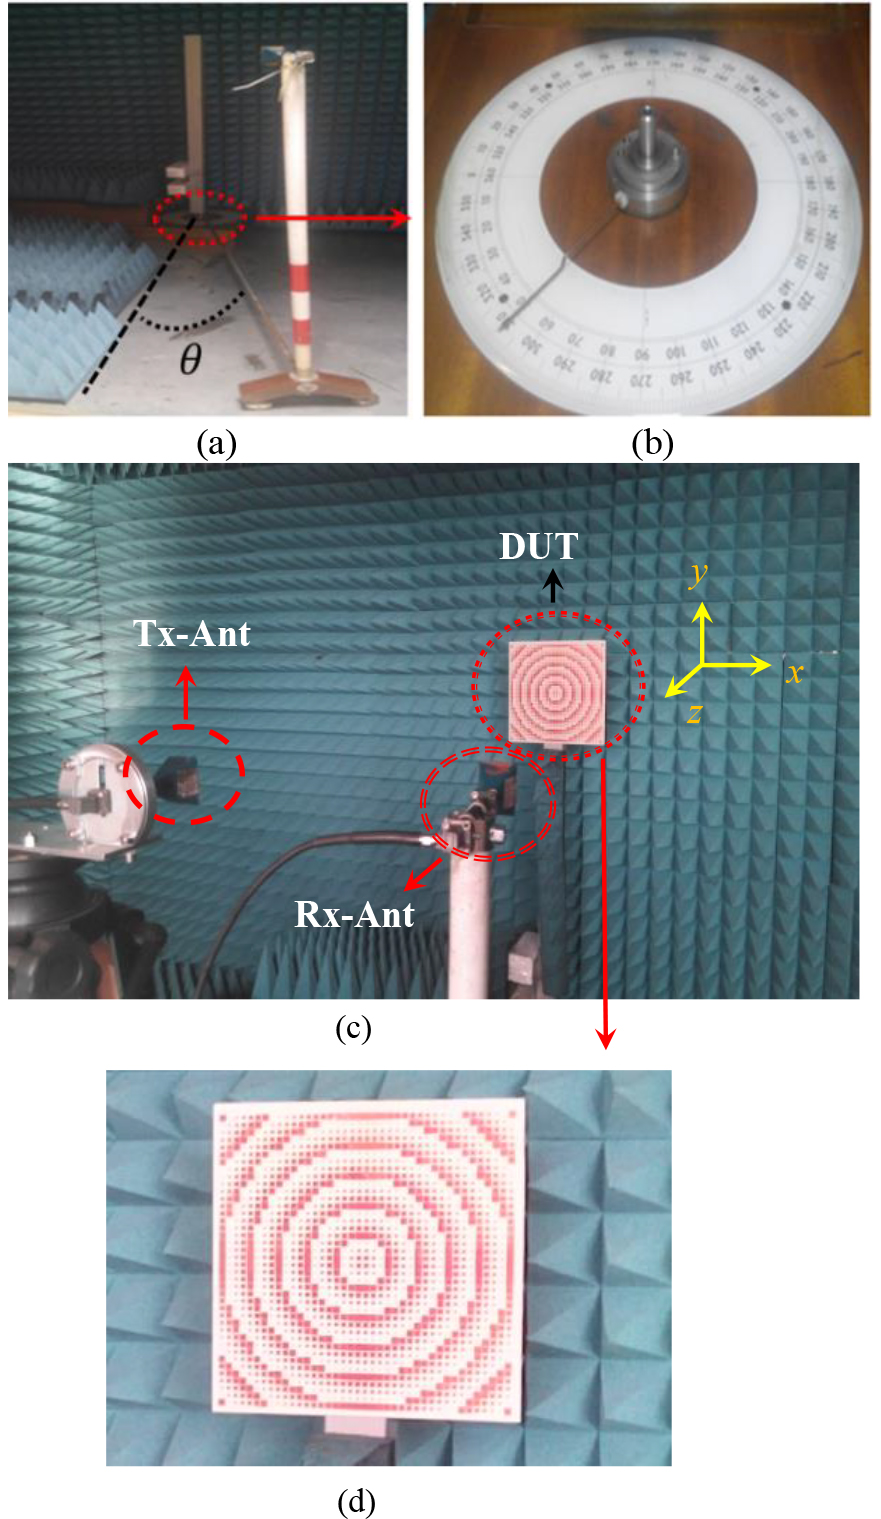
Figure 1: Photograph of the measurement set-up and DUT. (a) Schematic of the Marconi set-up in anechoic chamber. (b) Angular calibrated surface of the Marconi set-up. (c) Bi-static set-up using Marconi set-up, Tx/Rx antenna, and DUT.(d) Sample metasurface under test
To measure the bi-static pattern of the sample structure by using the Marconi set-up, it is necessary to fix the Tx antenna in front of the target and then measure the reflection from PCB/GND of DUT by the Rx antenna mounted on a movable arm at any angle. The Rx antenna is rotated manually by using the calibrated screen of the set-up protractor (see Figure 1(b)) to minimize the angular error. Since the structure of the sample metasurface has symmetry with respect to x/y axes (horizontal and vertical axes in Figure 1), it is appropriate to measure the reflection from the PCB/GND of the metasurface in the angle range of .
III. POST-PROCESSING PROCEDURE
After measuring the reflection from PCB/GND at all desired angles () by using the time gating method, the PCB/GND reflection signals (both real and imaginary parts) at any specific angle are converted from the frequency domain to the time domain. The discrete IFFT equation is used [20].
| (1) |
where is the nth value of the reflection signal (real and imaginary) in the frequency domain, N is the number of frequency samples, and is the kth value of the signal in the time domain. Then, by applying a suitable time filter (here Kaiser) in the time domain, noise and other existing environmental reflections are removed. At this stage, only the PCB/GND reflection signals remain, and by FFT, the reflection rate from the PCB/GND is calculated in terms of frequency. The FFT equation that is used reads [20]
| (2) |
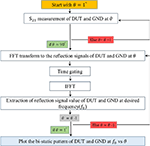
where is the kth value of the signal in the time domain, N is the number of time steps, and is the nth value of the complex value signal in the frequency domain. This coordinate loop shown in Figure 2 flowchart is used to extract the PCB/GND reflection at all angles ().
In order to apply the measurement flowchart presented in Figure 2 and measure the bi-static RCS of the metasurface at 18 and 32 GHz, N5227A PNA Network Analyzer was used. The 30-GHz bandwidth (from 10 to 40 GHz) has been covered by three sets of TX/Rx antennas, in 1601 frequency points in each frequency band, and considering 100 Hz PNA resolution bandwidth. The frequency bandwidth, steps, and resolution bandwidth are chosen so that the reflected signal from PCB/GND in the time domain might be detected [1]. It should also be noted that the radial distance between Tx/Rx antenna to PCB/GND is equal to 2.5 m, which gives rise to high spatial attenuation, especially at high frequencies.
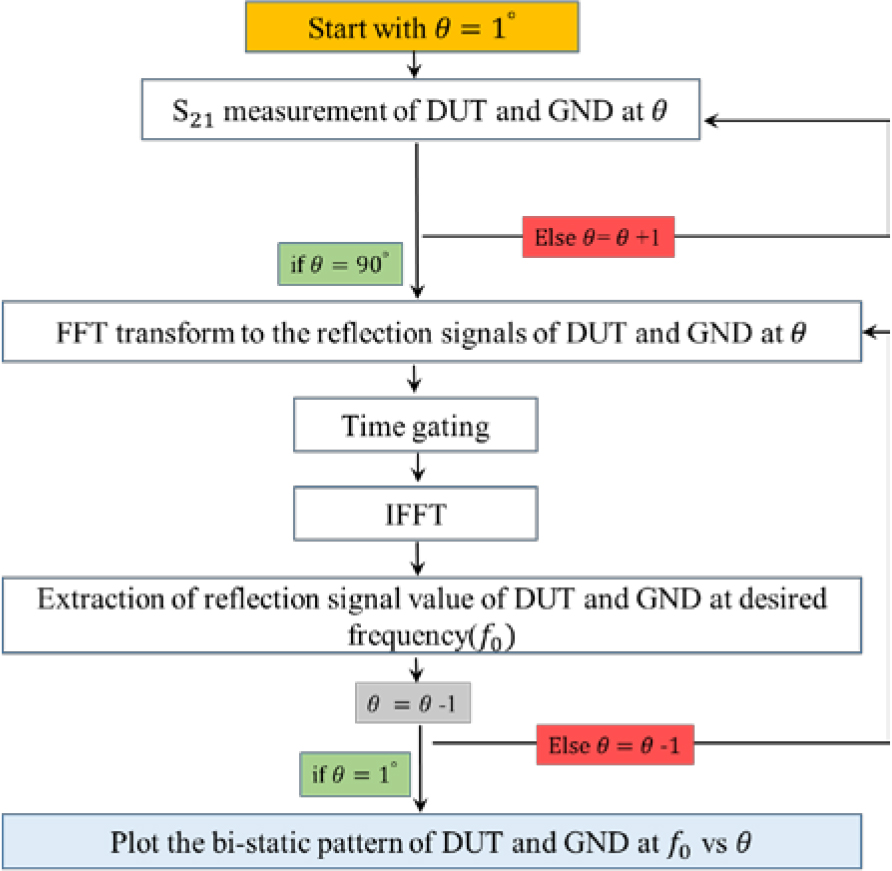
Figure 2: Flowchart of RCSR measurement using the Marconi set-up and time gating method.
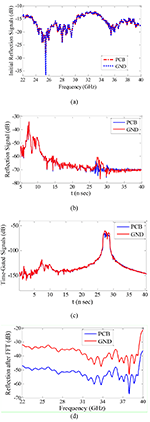
To depict the RCS results of the structure in the entire band of interest ( GHz), the RCS results from three measurements (in three separate frequency bands of , , and GHz) are merged in one single plot and presented as the final RCS result of the proposed structure. By starting from , the reflection from PCB/GND was measured at all angles between and . It should be noted that the reflection measurement from DUT is done by the same configuration of the network analyzer, and, in this case, the reflection of both PCB and GND in the frequency domain has the same power range, as depicted in Figure 3(a). In this case, it is impossible to distinguish between the reflection signal of PCB and GND due to the similar amplitude of their reflection power. At this stage, the distinction between the reflection signals and consequently the time gate required to apply the time filter is determined by applying IFFT and transmitting the PCB and GND reflection signals from the frequency domain to the time domain. Figure 3(b) shows the PCB/GND reflection at in the time domain (which corresponds to the GHz band).
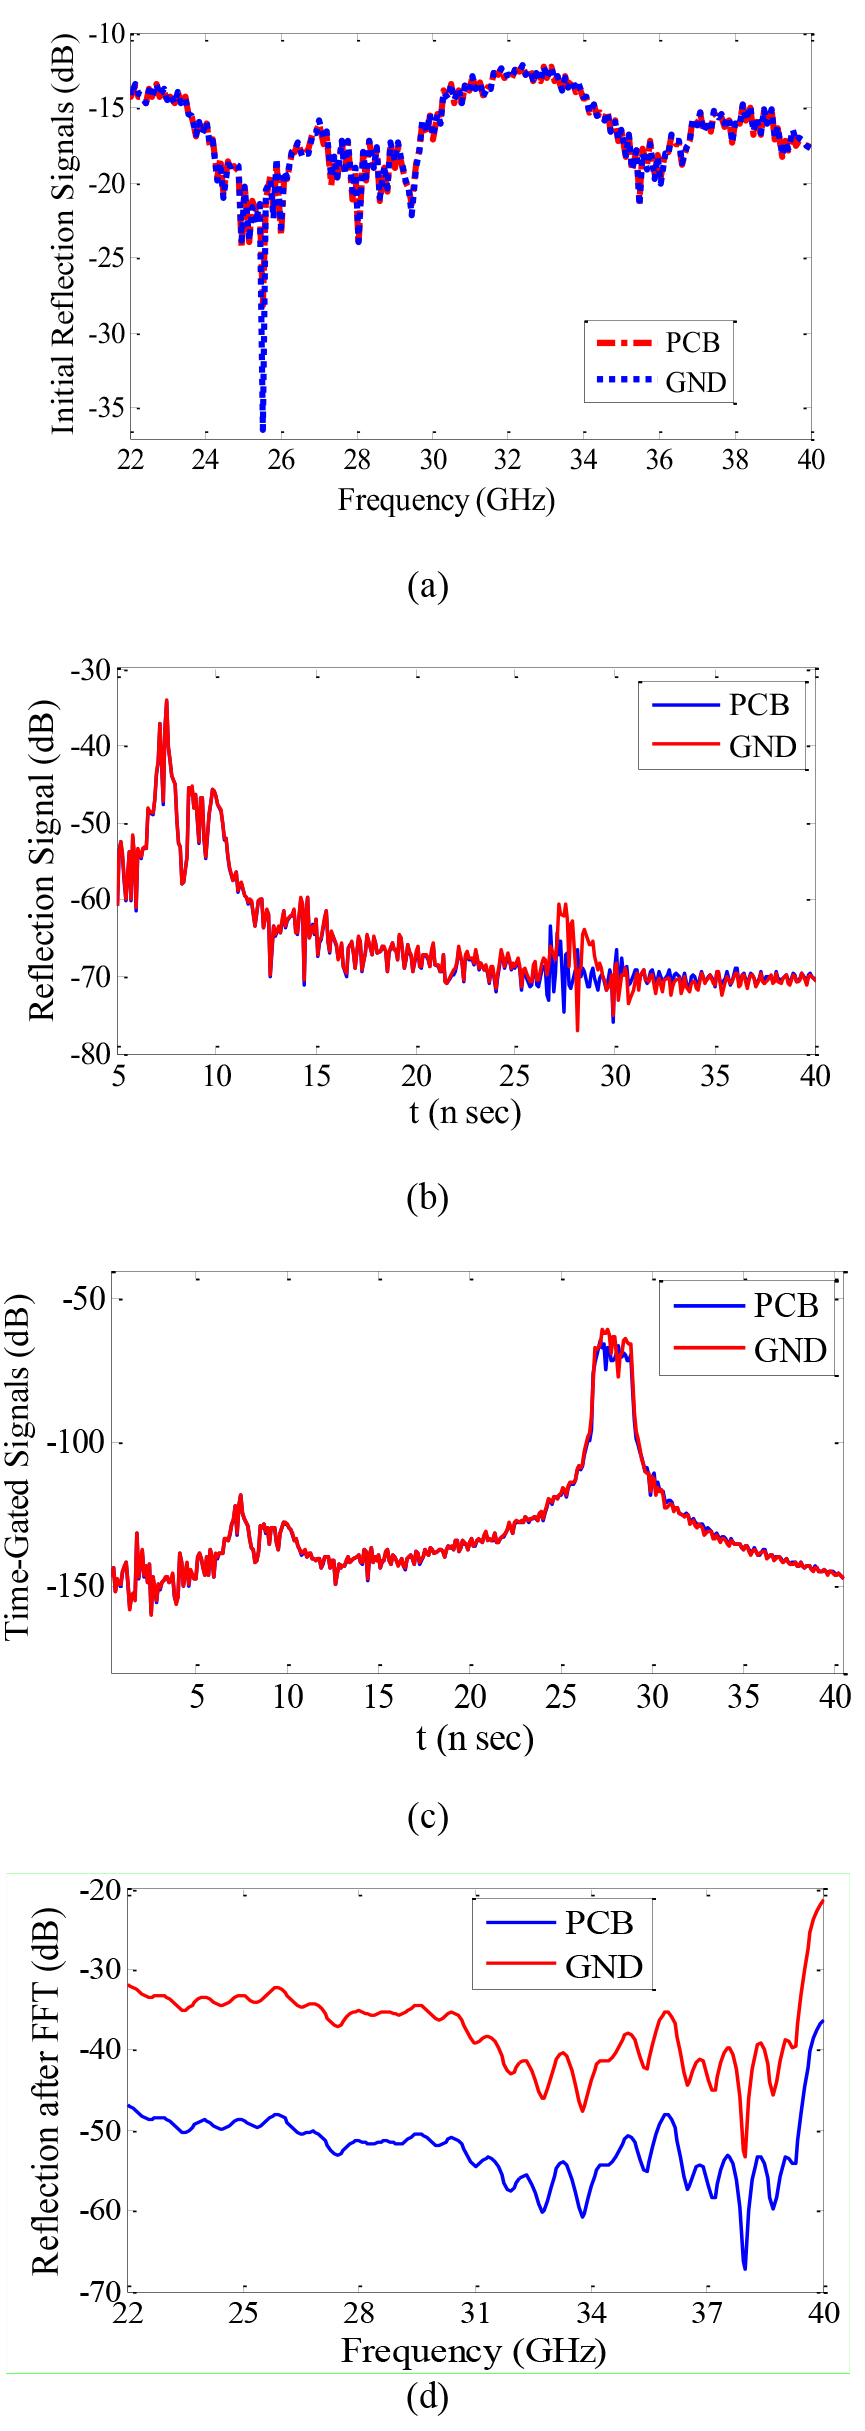
Figure 3: Time and frequency domain reflection results of the PCB/GND and RCS results. (a) Initial reflection signal of PCB/GND in frequency domain. (b) Time domain measurement results of PCB/GND. (c) PCB/GND reflection results after applying Kaiser time gating filter. (d) Reflection signal of PCB/GND after FFT. (e) RCSR measurement and simulation of the sample metasurface at .
It can be seen that there is a difference in the reflection amplitude of PCB and GND in the time interval of ns. Applying a proper time filter to the reflection signals in this time interval reduces the background noise, side-lobe signals (especially at ns range that is related to the side-lobes), and reflection from other environmental factors with more than 80 dB. Figure 3(c) shows the PCB/GND reflection results after the application of the high order (400) Kaiser time filter. The difference between the reflection signal of PCB and GND in the period of ns can be seen in Figure 3(c).
By applying the appropriate time filter (Kaiser) as well as FFT to the signals of this time period, the reflection of PCB and GND in the frequency domain and subsequently RCS result of considered sub-band, here 2240 GHz, can be calculated. It should be noted that all post-processing steps, i.e., IFFT, FFT, and Kaiser filter calculation, have been implementedin Matlab.
In the next step, the PCB/GND reflection for the considered frequency band (2240 GHz) at is obtained by applying the IFFT which is plotted in Figure 3 (d). It can be appreciated that in the frequency range, 22–40 GHz, the reflection from the PCB surface is less than that from the GND one. One can conclude that by considering the metasurface, a broadband RCSR performance has been achieved. At this stage, the difference between PCB and GND signal is extracted as a measured RCSR, which is plotted in Figure 3 (e). The simulation and measurement results in Figure 3 (e) are in good agreement with each other and there are small differences (lower than 1.5 dB) between simulated and measured results at 18 and 32 GHz, which indicate the efficiency of the proposed test method. Comparison of the simulation results provided by the full-wave CST Microwave Studio software with the measured ones proves the accuracy and reliability of the proposed method.
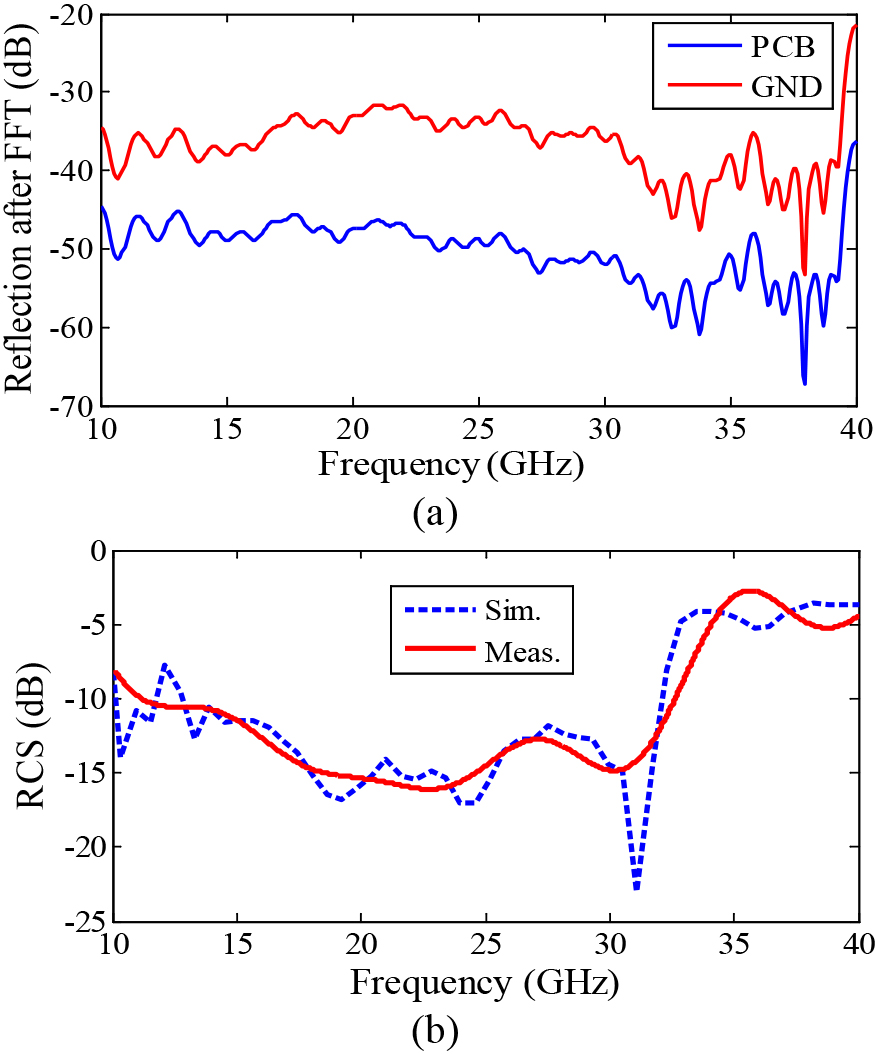
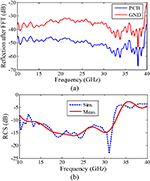
Figure 4: Frequencydomain reflection results of the PCB/GND and RCS results. (a) Initial reflection signal of PCB/GND in frequency domain. (b) Frequencydomain measurement results of PCB/GND.
In the same manner, RCS measurement of the metasurface in the other two frequency bands (1018 and 1822 GHz) has been carried out and the final RCS result was merged in Figure 4(a) and (b). Reflections of PCB and GND are plotted in Figure 4(a). Comparison between simulation and measurement results of sample metasurface is shown in Figure 4(b). It can be seen that there is a good agreement between measurement and simulation results in the overall 1040 GHz frequency band.
A. Bi-static RCS pattern extraction
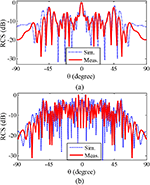
In the following, the reflection values are extracted from other angles as shown in Figure 2. By performing the above-described procedure for all of the other angles and extracting the reflection values from PCB/GND at 18 and 32 GHz (at any angle), the bi-static RCS pattern of sample metasurface was plotted in Figure 5(a) and (b), respectively.
For better presenting and validating the test method, the simulated and measured normalized PCB/GND RCS patterns are compared with each other. Due to the symmetry of the structure, the measurement results from to are mirrored to to . Note that the measurement results for are not applicable (because the Tx and Rx antennas should have shared the same location); when using two Tx/Rx antennas, the minimum measurableangle is .
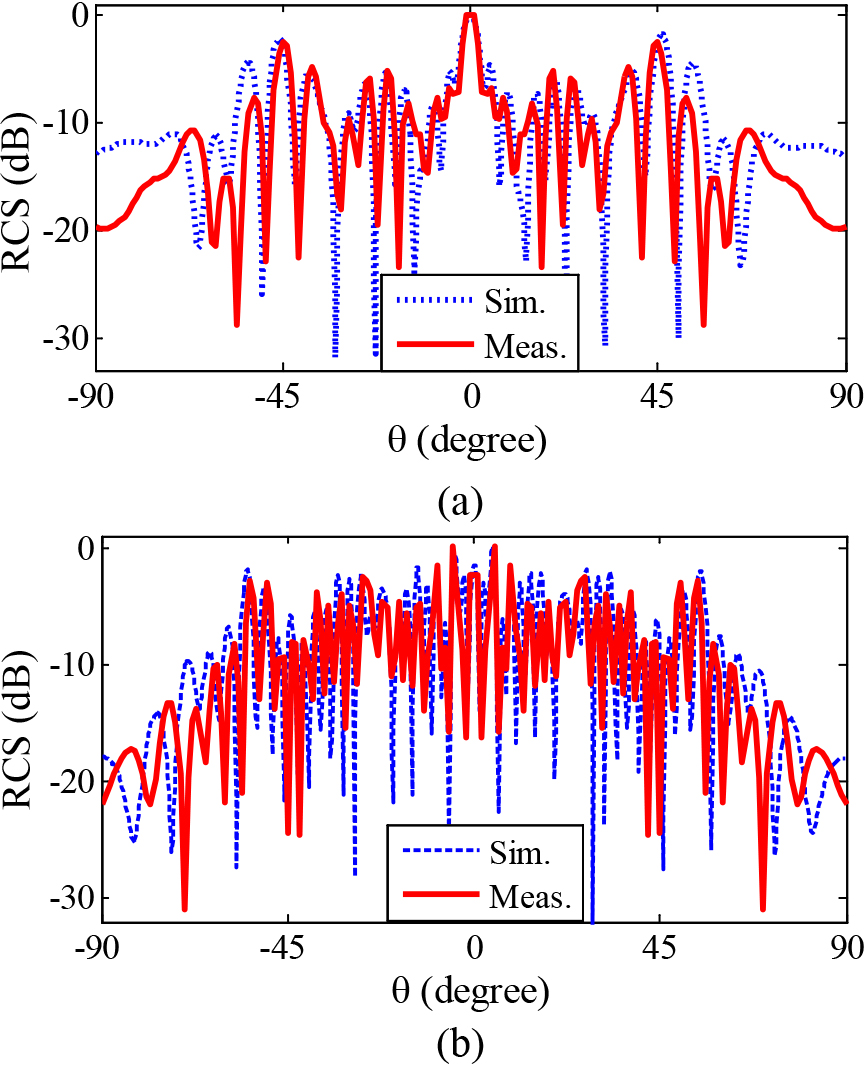
Figure 5: Measurement and simulation bi-static results of the proposed metasurface at (a) 18 and (b) 32GHz.
Comparison of measurement and simulation results at 18 GHz shows that there is a good agreement between them in the angular range of . According to 5(a), there is a difference up to several dB between the simulation results and the measurement at angles greater than . The reason for this difference can be the errors in the environmental factors such as set-up vibration, and errors related to the construction of metasurfaces and calibration of test equipment. In general, there is a good similarity and agreement between the measurement results with the proposed method and the simulation results at 18 GHz, which is due to the following reasons: (1) accurate angular calibration that is achieved using the Marconi set-up allowing accurate measurement of reflection at any angle; (2) elimination of the reflection noise effect from the environment by the high-order time filter, which reduces a significant part of the environmental measurement error (intrinsic advantage of time gating method). Similarly, a comparison between the measurement and simulation RCS pattern at 32 GHz shows that the proposed method has good accuracy. In this case, the number of resonances in the RCS pattern of the structure has increased, as can be seen in the measurement results. A comparison between the RCS pattern measurement and simulation results at 32 GHz proves that the proposed method has good accuracy. In this case, the number of resonances in the RCS pattern of the structure has increased, which can be appreciated in the measurement results.
Unlike the simulation results at 18 GHz and incident angles, there is good agreement between the measurement and simulation results.
IV. CONCLUSION
A low-cost, simple, and reliable bi-static test method was proposed using a calibrated Marconi scientific-educational test set-up to perform the measurements and post-process by time-gating method (using FFT, time filtering, and IFFT) used to extract scattering pattern of objects and structures. This method can be used as a suitable alternative to expensive bi-static measurement methods that require expensive hardware and software equipment. Using time gate and applying appropriate time filtering (in this case, the Kaiser filter was used) leads to eliminating the background and environment reflection, also. The performance of the proposed method is confirmed by testing a sample metasurface and comparing it with the simulation results. The sample metasurface has dimensions of 250 250 mm, which is printed on the Rogers 4003 substrate with a thickness of 1.6 mm. Comparison of simulation and measurement results shows that the proposed method has the potential to be widely used in laboratory and scientific applications by students and researchers. Also, the comparison between bi-static measurement results and simulation results (in accordance with the IEEE 1502 standard) validates the accuracy of the proposed method.
ACKNOWLEDGMENT
This work was supported by Iranian national science foundation (INSF) with grant number of 4003152. The authors are willing to express their gratitude to Mr. Gianluca Dassano and Gianfranco Albis for their cooperation and assistance in mounting the RCS measurement test set-up and extraction of results with the time gating method.
REFERENCES
[1] E. F. Knott, “Calibration,” in Radar Cross Section Measurements. New York, NY, USA: Van Nostrand Reinhold, pp. 183-187, 1993.
[2] C. G. Bachman, H. E. King, and R. C. Hansen, “Techniques for measurement of reduced radar cross-sections,” Microwave Journal, vol. 6, no. 1, pp. 61-67, Feb. 1963.
[3] W. A. Cummings, “Radiation measurements at radio frequencies: a survey of current techniques,” 27 Proceedings of the IRE, vol. 47, no. 5, pp. 705-735, May 1959.
[4] P. D. Kennedy, “Equipment and techniques for the measurement of radar reflections from model targets,” WESCON Convention Record, pt. 1, pp. 208-215, 1957.
[5] Special Issue on Ra2dar Reflectivity, Proceedings of the IEEE, vol. 53, no. 8, Aug. 1965.
[6] A. Gorji, B. Zakeri, and R. C. Janalizadeh, “Physical optics analysis for RCS computation of a relatively small complex structure,” Applied Computational Electromagnetics Society Journal, vol. 29, pp. 530-540, July 2014.
[7] C. Fang, X. Ye, Y. Zhang, Q. Wang, J. Zhao, N. Zhang, H. Jiang, C. Jin, and M. Bai, “Investigation of the RCS for finite bandpass frequency selective surface,”Applied Computational Electromagnetics Society Journal, vol. 34, no. 6, Jun. 2019.
[8] J. R. Huynen, “Measurement of the target scattering matrix,”Proceedings of the IEEE, vol. 53, no. 8, pp. 936-946, Aug. 1965.
[9] U. K. Chung, H. T. Chuah, and J. W. Bredow, “A microwave anechoic chamber for radar-cross section measurement,” IEEE Antenna and Propagation Magazine, vol 39, no. 3, pp. 21-26, Jun. 1997.
[10] A. Soltane, G. Andrieu, and A. Reineix, “Monostatic radar cross-section estimation of canonical targets in reverberating room using time-gating technique,” in 2018 International Symposium on Electromagnetic Compatibility (EMC EUROPE), IEEE, pp. 355-359, 2018.
[11] C. Larsson and M. Gustafsson, “Wideband measurements of the forward RCS and the extinction cross section,” Applied Computational Electromagnetics Society Journal, vol. 28, no. 12, Dec. 2013.
[12] H. C. Marlow, D. C. Watson, C. H. Van Hoozer, and C. C. Freeny, ”The RAT SCAT cross-section facility,” Proceedings of the IEEE, vol. 53, no. 8, pp. 946-954, Aug. 1965.
[13] I. D. Olin and F. D. Queen, “Dynamic measurement of radar cross-sections,”Proc. IEEE, vol. 53, no. 8, pp. 954-961, Aug. 1965.
[14] C. F. Hu, N. J. Li, and C. H. Fang, “Application of spectral extrapolation technique to stepped-frequency RCS measurement,” Applied Computational Electromagnetics Society Journal, vol. 35, no. 9, Oct. 2020.
[15] IEEE, 1502TM, “IEEE recommended practice for radar cross-section test procedures,” pp. 106-106, 1997.
[16] M. G. Cote, “Automated swept-angle bistatic scattering measurements using continuous-wave radar,” IEEE Trans. Instrum. Meas., vol. 41, no. 2, pp. 185-192, Apr. 1992.
[17] M. Z. Joozdani, M. K. Amirhosseini, and A. Abdolali, “Wideband radar cross-section reduction of patch array antenna with miniaturised hexagonal loop frequency selective surface,” Electron. Lett., vol. 52, no. 9, pp. 767-768, Apr. 2016.
[18] A. A. Toscano, “Marconi’s representations of the wireless, In Marconi’s wireless and the rhetoric of a new technology,“ Springer, Dordrecht, pp. 57-85, 2012.
[19] G. C. Corazza, “Marconi’s history,” Proc. IEEE, vol. 86, pp. 1307-1311, Jul. 1998.
[20] A. V. Oppenheim and R. W. Schafer, Discrete-Time Signal Processing, NJ, Upper Saddle River: Prentice-Hall, 1989.
BIOGRAPHIES
Yousef Azizi was born in Kermanshah, Iran, in 1989. He received his B.Ss degree in Electrical Engineering from Urmia University (UU), Urmia, Iran, in 2013. He also received his M.Sc. and Ph.D. degree all in Electrical Engineering from Iran University of Science and Technology (IUST), Tehran, Iran, in 2016 and 2021, respectively. He is currently a postdoctoral researcher in the Department of Electrical Engineering at ISUT. His major research interests are the design of Metasurface, Superstrate Antenna, planar and conformal Modulated surface for Radar Cross Section Reduction (RCSR).
Mohammad Soleimani received the B.Sc. degree in electrical engineering from the University of Shiraz, Shiraz, Iran, in 1978, and the M.Sc. and Ph.D. degrees from Pierre and Marie Curie University, Paris, France, in 1981 and 1983, respectively.
He is currently a Professor with the School of Electrical Engineering, Iran University of Sciences and Technology, Tehran, Iran and serves as the Director with the Antenna and Microwave Research Laboratory. He has also served in many executive and research positions. He has authored and coauthored 19 books (in Persian) and more than 200 journal and conference papers. His research interests include electromagnetics and high-frequency electronics and antennas.

Seyed Hassan Sedighy received the B.Sc., M.Sc., and Ph.D. degrees in electrical engineering from the Iran University of Science and Technology (IUST) in 2006, 2008, and 2012, respectively.
He is currently an Associate Professor with the School of Advanced Technologies, Iran University of Sciences and Technology. His current research interests include microstrips antenna, optical transformation, design and application of metamaterials, and RF radio links.

Ladislau Matekovits received the degree in electronic engineering from Institutul Politehnic din Bucureşti, Bucureşti, Romania, and the Ph.D. degree (Dottorato di Ricerca) in electronic engineering from Politecnico di Torino, Torino, Italy, in 1992 and 1995, respectively.
Since 1995, he has been with the Department of Electronics and Telecommunications, Politecnico di Torino, first with a post-doctoral fellowship, then as a Research Assistant. He joined the same department as an Assistant Professor in 2002 and was appointed as a Senior Assistant Professor in 2005 and as an Associate Professor in 2014. In February 2017, he received the Full Professor qualification (Italy). In late 2005, he was a Visiting Scientist with the Antennas and Scattering Department, FGAN-FHR (now Fraunhofer Institute), Wachtberg, Germany. From July 1, 2009, for two years, he has been a Marie Curie Fellow with Macquarie University, Sydney, NSW, Australia, where, in 2013, he also held a Visiting Academic position and, in 2014, was appointed as an Honorary Fellow. Since 2020, he has been an Honorary Professor with the Polytechnic University of Timisoara, Romania and an Associate of the Italian National Research Council. He has been appointed as a Member of the National Council for the Attestation of University Degrees, Diplomas, and Certificates (CNATDCU), Romania, for the term 2020–2024.
His main research activities concern numerical analysis of printed antennas and, in particular, development of new, numerically efficient full-wave techniques to analyze large arrays, and active and passive metamaterials for cloaking applications. Material parameter retrieval of these structures by inverse methods and different optimization techniques has also been considered. In the last years, bio-electromagnetic aspects have also been contemplated, as, for example, design of implantable antennas or development of nano-antennas, for example, for drug delivery applications.
He has published 375+ papers, including 100+ journal contributions, and delivered seminars on these topics all around the world: Europe, USA (AFRL/MIT-Boston), Australia, China, Russia, etc. Prof. Matekovits has been invited to serve as Research Grant Assessor for government funding calls (Romania, Italy, Croatia, and Kazakhstan) and as International Expert in Ph.D. thesis evaluation by several universities from Australia, India, Pakistan, Spain, etc.
Dr. Matekovits has been a recipient of various awards in international conferences, including the 1998 URSI Young Scientist Award (Thessaloniki, Greece), the Barzilai Award 1998 (Young Scientist Award, granted every two years by the Italian National Electromagnetic Group), and the Best AP2000 Oral Paper on Antennas, ESA-EUREL Millennium Conference on Antennas and Propagation (Davos, Switzerland). He is a recipient of the Motohisa Kanda Award 2018, for the most cited paper of the IEEE Transactions on Electromagnetic Compatibility in the past five years, and, more recently, he has been awarded with the 2019 American Romanian Academy of Arts and Sciences (ARA) Medal of Excellence in Science and by the Ad Astra Award 2020, Senior Researcher, for excellence in research.
He has been an Assistant Chairman and Publication Chairman of the European Microwave Week 2002 (Milan, Italy) and General Chair of the 11th International Conference on Body Area Networks (BodyNets) 2016. Since 2010, he has been a member of the organizing committee of the International Conference on Electromagnetics in Advanced Applications (ICEAA), and he is a member of the technical program committees of several conferences. He serves as an Associated Editor for the IEEE Access, IEEE Antennas and Wireless Propagation Letters, and IET Microwaves, Antennas & Propagation and as a Reviewer for differentjournals.
ACES JOURNAL, Vol. 37, No. 2, 184–190.
doi: 10.13052/2022.ACES.J.370206
© 2021 River Publishers