Solid Characterization Utilizing Planar Microwave Resonator Sensor
Ahmed Jamal Abdullah Al-Gburi, Zahriladha Zakaria, Imran Mohd Ibrahim,
Rahmi S. Aswir, and Syah Alam
1Fakulti Kejuruteraan Elektronik dan Kejuruteraan Komputer, Universiti Teknikal Malaysia Melaka, Hang Tuah Jaya, 76100 Durian Tunggal, Melaka, Malaysia
zahriladha@utem.edu.my
2Department of Electrical Engineering, Universitas Trisakti
Submitted On: October 31, 2021; Accepted On: March 15, 2022
Abstract
This paper outlines the design and the implementation of a planar microwave resonator sensor for sensing application using the perturbation concept in which the dielectric characteristics of the resonator influence the quality factor (QF) and the resonance frequency. The designed sensor is fabricated using Roger 5880, and it is operating at 2.27 GHz in ranges of 1-3 GHz for testing solid materials. In addition, applying a specific experimental methodology, practical material is used as material samples such as those in Roger 5880, Roger 4350, and FR4. To investigate the microwave resonator sensor performance, an equivalent circuit model (ECM) is introduced. The proposed sensor has achieved a narrow bandwidth and high QF value of 240 at an operating frequency of 2.27GHz. Besides, the sensitivity and accuracy of the sensor is more than 80%, which makes this sensor an excellent solution to characterize the material, especially in discovering the material characteristics and quality.
Keywords: Planar microwave resonator, solid sample, high Q-factor.
I. INTRODUCTION
A microwave sensor is possibly the most widely known sensor for the food sector, quality control, biomedical, and industrial use for material characterization detections [1–3]. Controls on the health and safety of fodder products are necessary in order to achieve the health and well-being of consumers whose presence can affect certain ingredients and end up causing specific diseases, such as allergic reactions, contaminating, and cancer. For such cases, the quality and safety of the product (e.g., drinks and cooking oils) must be ensured before even being marketed to the customers [3]. There have been two main types of resonant microwave methods: resonant and non-resonant methods for characterizing materials [4].
Microwave resonant technique is one of the potential methods which is used for highly accurate measurement of dielectric material characterization at a single or discrete frequency. According to the traditional method, material characterization was accomplished using high-sensitivity and precision waveguide, dielectric, and coaxial resonators [5]. However, the conventional resonator sensor is extremely large, costly to make, and requires a significant amount of material to be detected [material under test (MUT)] [5–8]. Besides that, this technique results in low sensitivity and Q-factor values, limiting the material’s characterization range.
An objective of this report was to identify the shortcomings of the prior one by developing a new microwave sensor that is compatible, low in cost, small, easy to handle, and has a higher Q-factor [9–12]. A complementary split-ring resonator (SRR) was proposed to accurately measure the material’s complex permittivity. The stated resonator operated at frequencies from 1.7 to 2.7 GHz [9]. Another study was conducted by utilizing a metamaterial resonator sensor for sensing applications. The proposed sensor was utilized at two main frequencies, 3.2 and 4.18 GHz, with Q-factors of 642 and 251, respectively [11]. A novel electromagnetic sensor operated at 1.4 GHz was proposed for real-time sensing liquid characterization [12].
In this study, a planar microwave resonator sensor is proposed to measure the corresponding permittivity for solid planar dielectric materials. The proposed method uses the sample under test as a substrate of a microstrip line with an impediment that has to be installed at various positions over the microstrip line for measurement determination. An equivalent circuit model (ECM) is proposed to confirm the design structure. Besides, this study looked into the drawbacks of the previous research studies through a new microwave sensor in terms of compatibility: low cost, simple structure, easy to fabricate, high Q-factor, and high precision.
II. SENSOR DESIGN AND CONFIGURATION
A. Design process
The proposed resonator sensor is performed at 2.27 GHz for frequencies of 1-3 GHz in order to explore the type of materials employing the solid technique. The formed radiator is designed by utilizing a CST microwave studio. The total dimensions of the modeled radiator are about 50 mm 40 mm, printed on Roger 5880 dielectric substrate comes with a thickness of 0.79 and 2.2 of dielectric constant and a loss tangent of 0.0009. The overall sensor geometry is duplicated in Figure 1 and recorded in Table 1.
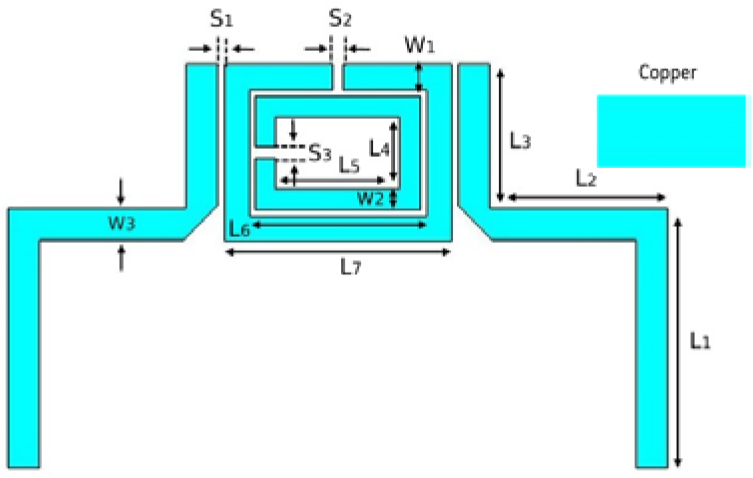
Figure 1: The geometry of the proposed sensor.
It is worth mentioning that the need for an inner ring to the existing resonator is to allow more current to pass through the ring resonator, which leads to high e-field concentrations.
Table 1: Proposed sensor parameters
| S | V (in mm) | S | V (in mm) | S | V (in mm) |
| L | 40 | W | 50 | L | 11.4 |
| L | 16.25 | S | 0.3 | L | 14.59 |
| L | 10.42 | S | 0.4 | W | 1.7 |
| L | 10.5 | S | 0.5 | L | 4.5 |
| L | 8 | W | 1.6 | W | 1.5 |
S = symbols and V = values.
The mathematical analysis of the proposed sensor through compatible folding arm loading the length and breadth of the patch, the length of the resonator is the half of the wavelength as presented in the followingequation [12]:
| (1) |
Based on the sensor length, the resonance frequency (f) can be determined using the following equation [13]:
| (2) |
where c is the speed of light (8.98755179 1016 m/s), L denotes the resonator length, and is the effective dielectric constant of the stated resonator.
The width of microstrip patch antenna resonator W can be calculated using the following equation:
| (3) |
The effective permittivity of the patch can be calculated as proposed in eqn (4), for the fringing field and the wave propagation in the line [14].
| (4) |
where h is the height of the substrate and w is the width of the patch.
The Q-factor is acknowledged in this study as a quality factor embedded in a resonant circuit, which is involved as an infinite value together to reflect the unwanted energy with a specific resonant. It designates spectrum in relevant incidence at the center offrequency [15]
| (5) |
where Q represents the Q-factor, f denotes the center of frequency, and the resonant frequency is characterizedas f.
B. Equivalent circuit model and analysis
Before analyzing the ECM configuration, it is very important to discover the sensing region of the proposed microwave sensor, which is based on the electric field distributions. The more electric field concentration is found to be near the square gap (red color), as shown in Figure 2(b). The 3D view of the proposed resonator is duplicated in Figure 2(a).
The sensitive area with the highest electric field concentration was located around the ring gap, and the excellent sensing region was only 378 nL. Setting the channel very close to the resonator sensor guarantees that the sample interacts with field lines concentrated by the resonator. An advance design software (ADS) is used in this stage to investigate the influence of material characteristics on the resonator sensor. The overall microwave sensor was designed with an effective length of 40 mm to operate at ranges from 1 up to 3 GHz.
The operational mechanism of the proposed ECM is mainly divided into two lump components: inductance (L) and capacitance (C) to achieve an LC circuit as duplicated in Figure 2(c). The ECM configuration is formed from the metallic co-planar with two square radiated rings. The metallic co-planar is equivalent inductance, as presented in [16], the ring resonators are structured from resonant inductance L, and the gaps between them are provided with a resonant capacitance (C) as suggested in [17] and calculated by approximating it between two identical co-planar strips with unlimited substrate thickness, as shown in eqn(6) and (7) [18]:
| (6) |
where w denotes the width of the resonator feed line, k(m) is an elliptic integral, k(m) is its complement, h is the copper thickness of the resonator feed line, and s is the spaces between the two inner and outer rings. The operational factor Z can be derived as
| (7) |
Table 2 outlines the implemented ECM values of the proposed resonator. When samples are placed on top of the patch sensor’s copper track, which has a high electric field concentration, the interaction of MUT and the structured patch electrical field results in changes in a resonant frequency which leads to affecting the functional parameters C and R, respectively, by presenting permittivity and loss variation in the sensor’s profile. Permittivity variation was designed and simulated by sweeping the value of C, and the loss effect was simulated by evaluating simultaneous linear interpretation on R based on the following equation:
| (8) |
where is the empirical constant, C denotes the initial value of matching gap capacitance, and R describes the initial equivalent loss of the bare resonator’s gap area.
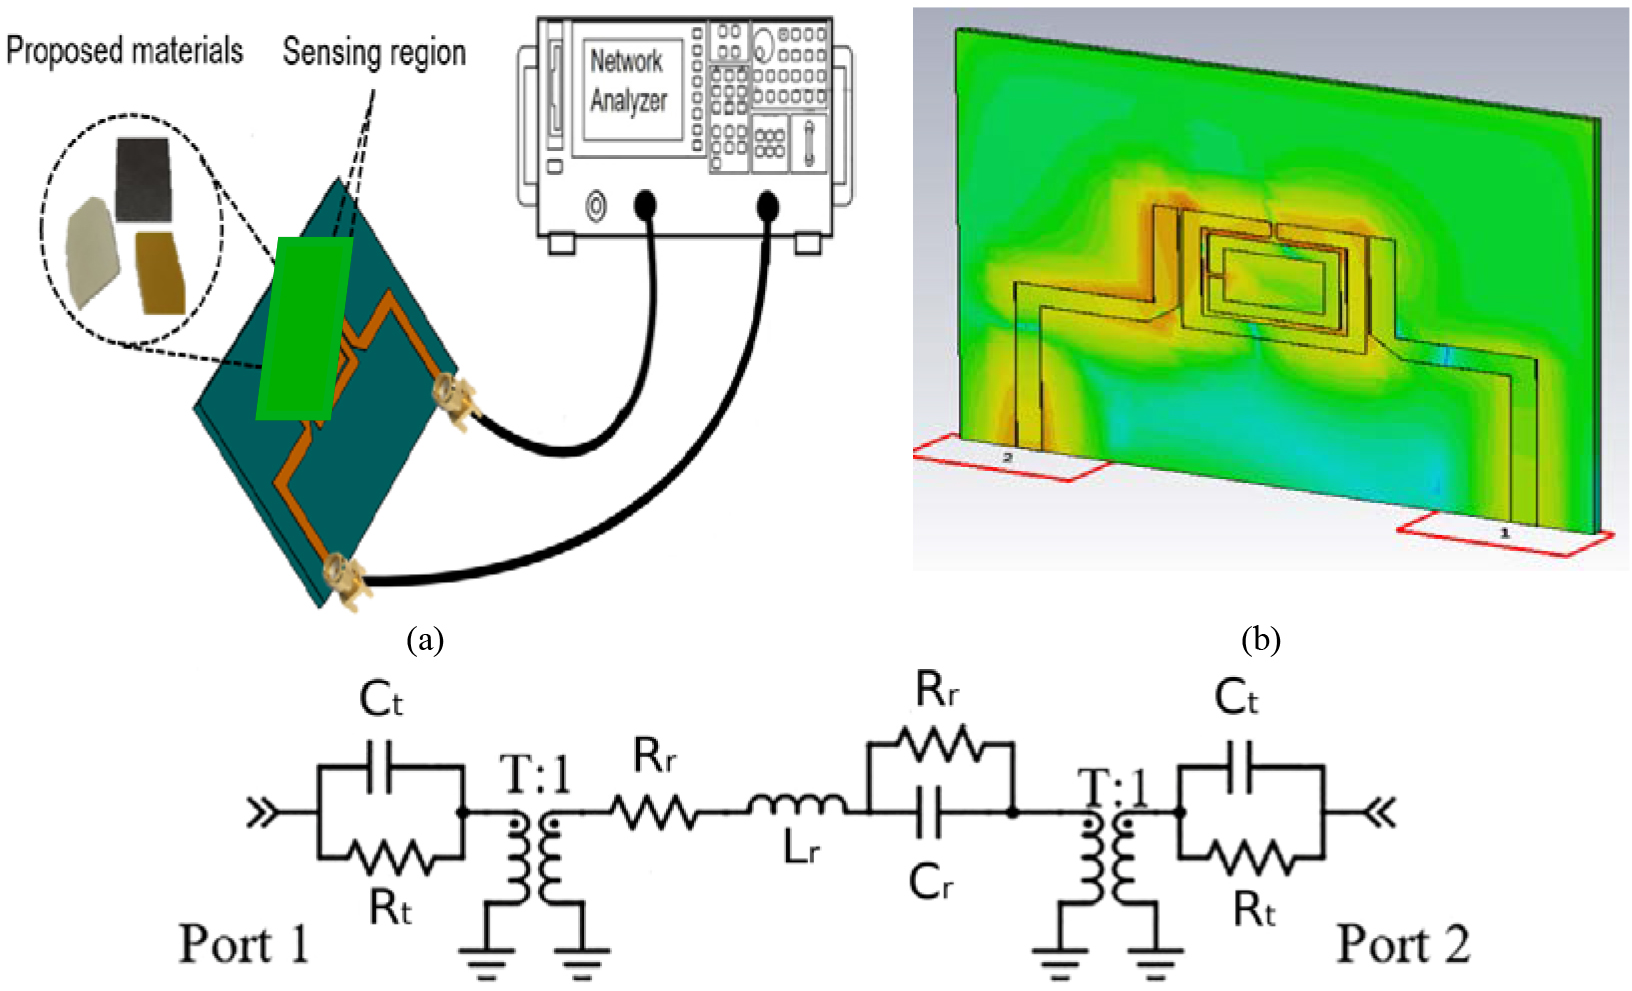
Figure 2: Microwave sensor representation. (a) 3D view. (b) E-field. (c) ECM of all microwave sensors.
Table 2: Optimized values of the proposed ECM resonator
| Circuit Parameters | Values |
|---|---|
| C | 51 pF |
| R | 100 k0 |
| T | 0.31 |
| R | 0.9 M. |
| L | 76 nH |
| C | 50 fF |
| R | 5.4 O |
| a. | 10 |
C. Simulation process
The modeled sensor is designed by utilizing CST software. This sensor’s classification is proposed based on the theoretical and mathematical analysis obtained from the justification parameters. Therefore, the tuning approach was proposed to deliver a more reliable insertion loss plot. Besides, the pair waveguide-ports are introduced to characterize the transverse electric and magnetic and their effect on the S-parameter.
The simulation process is carried out based on the MUT material characterization. The MUT characterization mainly depends on the red color region of the resonator electric-field as presented in Figure 2(b). The material units will be installed on the resonator patch, which leads to main electric field radiations. The sensitive area with the highest electric field concentration was located around the ring gaps and more from the left ring side of the resonator. Besides, the integration of material samples on the top of resonator sensors leads to a shifting in the resonant frequency.
D. Fabrication and measuring resonator
After understanding and upgrading the mathematical and the simulation process, the scheduled resonator is fabricated and measured in this study. The Roger 5880 is used for the fabrication process. The proposed microwave sensor is experimentally assessed by employing a VNA for frequencies of 1-3 GHz. The network analyzer verifies the sensor by connecting the two waveguide ports with 50 . The MUT samples are installed at the radiated electric field of the radiated resonator patch.
The dimensions of the MUT are 10 mm 12 mm for the types of materials such as FR4, Roger 5880, and Roger 4350. The fabrication and measurement process was set up by employing a VNA device, as shown in Figure 3.
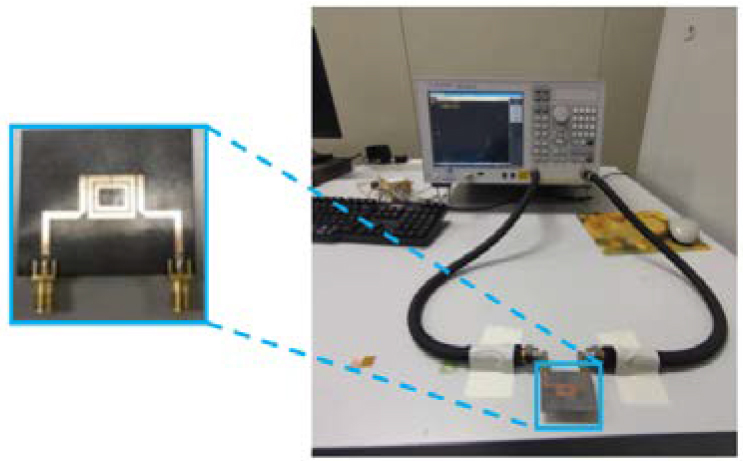
Figure 3: Measurement setup using VNA.
Table 3: Comparison simulation and measurement results
| MUT | Simulation results | Measurement results | ||||||||||
|---|---|---|---|---|---|---|---|---|---|---|---|---|
| Q-factor | S21 | BW | f (GHz) | f | Error% | Q-factor | S21 | BW | f (GHz) | f | Error% | |
| Free space | 110.05 | 1.796 |
0.04129 | 2.272 | 0 | 0 | 240 | 10.9 | 0.02 | 2.4 | 0 | 0 |
| Roger 5880 | 110.14 | 1.862 | 0.03915 | 2.156 | 0.166 | 5.1056 (94.894) |
140 | 7.17 | 0.0329 | 2.31 | 0.09 | 3.75 (96.25) |
| Roger 4350 | 103.98 | 2.2356 | 0.04043 | 2.102 | 0.17 | 7.4824 (92.517) |
64.92 | 8.25 | 0.06875 | 2.21 | 0.19 | 7.916 (92.084) |
| FR4 | 72.66 | 4.9350 | 0.05373 | 1.952 | 0.32 | 14.0845 (85.9155) |
168.8 | 14.07 | 0.025 | 2.11 | 0.29 | 12.083 (87.917) |
The comparison between the simulation and measurement results of the modeled resonator is recorded in Table 3.
III. RESULT AND ANALYSIS
A. Resonant frequency
Figure 4 presents the simulated and measured transmission coefficient (S21) of the finalized sensor. From Figure 4, we can observe that the shifting in the resonant frequency defined the efficiency of the microwave sensor. During simulation, the resonant wavelength of the stated sensor is shifted from 2.272 for simulation to 2.4057 GHz for the measured one, with a slight variation of about 0.1337 GHz. The results of the resonant frequency regarding simulation results are appropriately matched. However, there are slightly shifted resonances compared to the measured results. This shifting because of a lack of feed lines and SMA connectors, and even the fabrication tolerances, can influence simulation accuracy.
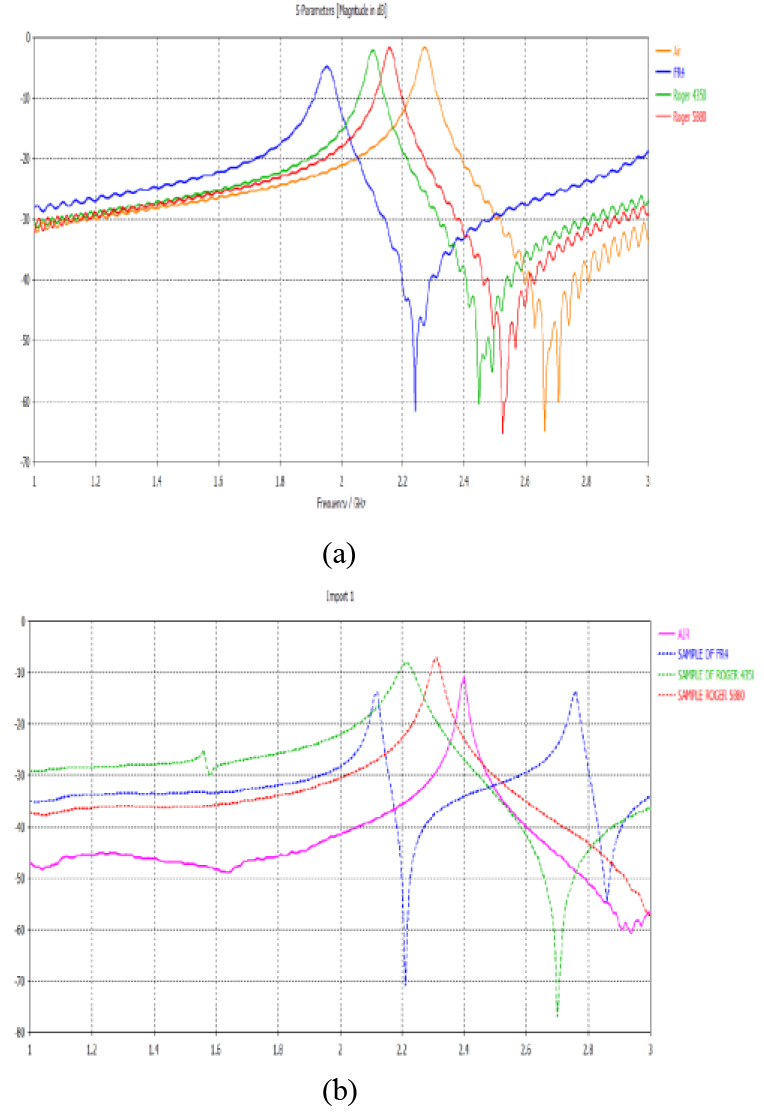
Figure 4: Predicted and measured S21 results.
B. Q-factor analysis
The Q-factor magnitude was calculated based on eqn (5). The proposed sensor was first operated at 2.272 GHz. Referring to eqn (5), the Q-factor is equal to 110 for simulation results; moreover, at the same frequency of 2.272 GHz, the measured Q-factor is about 240. It can be noticed that the measured Q-factor is higher than the simulated one.
The simulated and measured results slightly differ due to inaccuracies when fabricating using manual cutting tools, besides the inhomogeneous dielectric constant of the substrate [19]. The differences between simulations and measurements are also affected by the SMA connector losses in practice, as an ideal connector is modeled in simulations. Besides that, the amount of power fed into the antenna in measurements is also affected by the way the epoxy is applied to galvanically connect the SMA connector and fabric [20].
Furthermore, the Q-factor rises as the change in the resonance frequency reduces to the lowest frequency. Hence, a narrow bandwidth is expected, which points to improving and increasing the Q-factor value at its maximum magnitude.
Referring to the permittivity value of the experimented materials, which are FR4, Roger 4350, and Roger 5880, which have various thickness values of 1.6, 0.78, and 0.5mm. The simulated MUT materials are resonating at frequencies of 1.952, 2.1, and 2.156 GHz, respectively, meanwhile, for the measured part. The resonant frequencies are shifted due to the mutual coupling effect between the two co-planars on the resonator patch. The shifted frequencies were 2.11 GHz for FR4, 2.21, and 2.31 for Roger 5880 GHz at 2.4 GHz, sequentially. Figure 5 shows the simulated and measured transmission coefficient (S21) at different resonant frequencies.

Figure 5: Comparison of S21 MUT results for (a) simulation and (b) measurement.
C. Dielectric and loss tangent analysis
The shifted frequencies are strongly dependent on the impedance of the signal within the highest E-field concentrations and the MUT’s permittivity. The relationship between resonance turned resonant frequency and the conventional permittivity can be categorized by the second polynomial method utilizing experimental outcomes as displayed in formula (9):
| (9) |
where is the MUT permittivity.
Applying data shifts of resonance frequencies as shown in Figure 6, the curve fitting (CF) method is modeled based on the second-order polynomial role. The technical procedure is proposed for estimating the actual permittivity magnitude.
The outcomes of the estimated permittivity are recorded in Table 4. From Table 4, we can notice that the error in permittivity related to the second polynomial comparison is between 0.34% and 1.40%, respectively. The permittivity magnitude of the representation materials was an increase when the error got decreased.
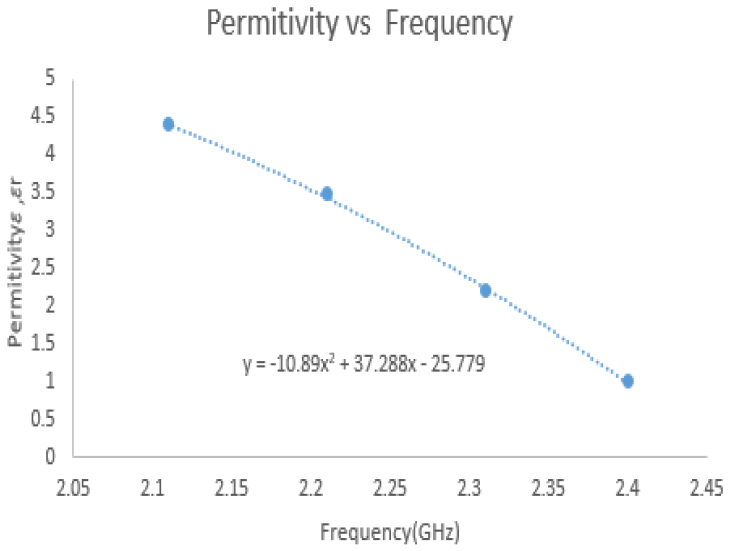
Figure 6: Polynomial CP permittivity.
Table 4: Analyzing permittivity values under MUT
| MUT | Reference tan | Measured tan | % Error |
|---|---|---|---|
| Air | 0 | 0 | 0 |
| Roger 5880 | 0.0009 | 0.000897 | 0.33 |
| Roger 4350 | 0.0037 | 0.003694 | 0.162 |
| Fr4 | 0.025 | 0.024991 | 0.036 |
The loss tangent is a frequency-dependent loss that produces a loss that is proportional to the frequency. When the tangent loss value is low, it shows a greater effect on the peak amplitude S21. So, when the tangent loss value is the smallest, the S21 parameter becomes smaller. The third-order polynomial expression established the link between loss tangent and resonant frequency change. The difference between the reference and measurement loss tangent was analyzed based on the percentage error trend line. From the third-order polynomial expression, the measurement tangent loss value can be obtained. The third-order polynomial expression is illustrated in Figure 7.
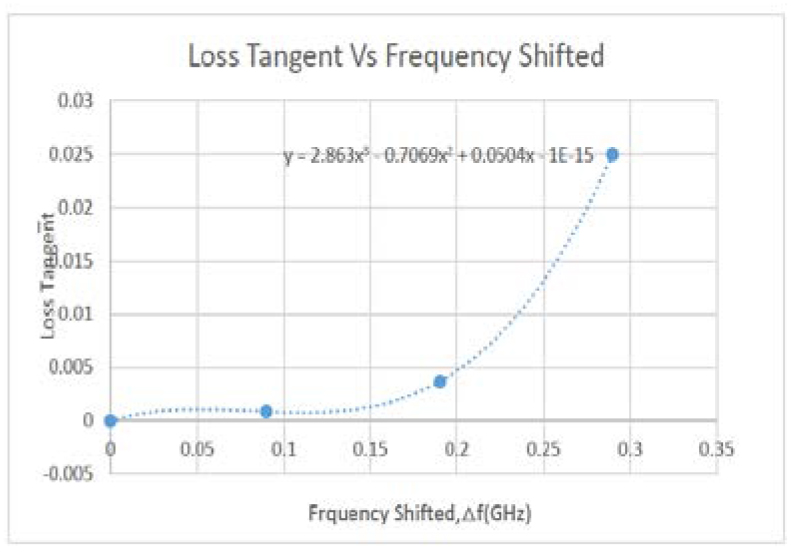
Figure 7: Third-order polynomial curve fitting of loss tangent.
Figure 7 is structured from the particular input data collection regarding the model tangent loss to generate expression based on the CF method. It can be observed that the combination of and is not consistent, and the result is described by the eqn (8). However, the relationship between both parameters can be described as a polynomial representation of third order to create an efficient mathematical equation as follows:
| (10) |
III. CONCLUSION
This paper presented a planar microwave resonator sensor which proves that it can be used to detect the properties of solid material. Thus, high accuracy sensor works on 2.27 GHz. The sensor produces a high Q-factor value which is 240 compared to previous research. A mathematical model is developed for the determination of the dielectric constant and loss tangent of MUT. The polynomial CF was also applied to determine the dielectric properties of the material. The percentage error for permittivity of measurement and tangent loss is below 5%. The accuracy for this sensor is more than 85% which makes the sensor suitable to be applied in industrial.
III. FUTURE WORK
While the research is thriving, a few ideas for potential enhancements are presented as follows. Principally, to improve the sensor’s sensitivity, the electric field should be highly concentrated. Besides, the area around the resonator will reflect all over the energies. Then, checking the soldering connectivity must be considered to block the loss in radiation behavior for both input and output terminals.
ACKNOWLEDGMENT
This work was supported by Universiti Teknikal Malaysia Melaka (UTeM).
REFERENCES
[1] S. N. Jha, “Measurement techniques and application of electrical properties for nondestructive quality evaluation of f oods-a review,” J. Food Sci. Technol., vol. 48, no. 4, pp. 387–411, 2011.
[2] N. A. Rahman, Z. Zakaria, R. Abd Rahim, M. Alice Meor Said, A. Azuan Mohd Bahar, R. A. Alahnomi, and A. Alhegazi, “High quality factor using nested complementary split ring resonator for dielectric properties of solids sample,” Applied Computational Electromagnetics Society (ACES) Journal, vol. 35, no. 10, pp. 1222–1227, 2020.
[3] J. Tang, “Unlocking potentials of microwaves for food safety and quality,” J. Food Sci., vol. 80, no. 8, pp. E1776–E1793, 2015.
[4] P. M. Narayanan, “Microstrip transmission line method for broadband permittivity measurement of dielectric substrates,” IEEE Trans. Microw. Theory Tech., vol. 62, no. 11, pp. 2784–2790, 2014.
[5] N. Abd Rahman, Z. Zakaria, R. Abd Rahim, R. A. Alahnomi, A. J. A. Al-Gburi, A. Alhegazi, W. N. Abd Rashid, and A. A. M. Bahar, “Liquid permittivity sensing using teeth gear-circular substrate integrated waveguide,” IEEE Sensors Journal, pp. 1–8, 2022, doi: 10.1109/JSEN.2022.3166561.
[6] K. Shibata and M. Kobayashi, “Measurement of dielectric properties for thick ceramic film on an substrate at microwave frequencies by applying the mode-matchig method,” 2016 IEEE MTT-S Int. Conf. Numer. Electromagn. Multiphysics Model. Optim. NEMO 2016, pp. 1–4, 2016.
[7] A. A. Mohd Bahar, Z. Zakaria, M. K. Md. Arshad, A. A. M. Isa, Y. Dasril, and R. A. Alahnomi, “Real time microwave biochemical sensor based on circular SIW approach for aqueous dielectric detection,” Sci. Rep., vol. 9, no. 1, pp. 1–12, 2019.
[8] A. Azuan, M. Bahar, Z. Zakaria, S. Rosmaniza, A. Rashid, and A. A. Isa, “Microstrip planar resonator sensors for accurate dielectric measurement of microfluidic solutions,” in 3rd International Conference on Electronic Design (ICED), pp. 416–421, 2016.
[9] M. A. H. Ansari, A. K. Jha, and M. J. Akhtar, “Design and application of the CSRR-based planar sensor for noninvasive measurement of complex permittivity,” IEEE Sens. J., vol. 15, no. 12, pp. 7181–7189, 2015.
[10] R. A. Alahnomi, Z. Zakaria, E. Ruslan, and A. A. M. Isa, “Optimisation analysis of microwave ring resonator for bio-sensing application,” Int. J. Appl. Eng. Res., vol. 10, no. 7, 2015.
[11] S. R. Harry, Z. Zakaria, M. A. M. Said, R. Alahnomi, and M. Harris Misran, “Design of dual band meta-material resonator sensor for material characterization,” Applied Computational Electromagnetics Society (ACES) Journal, vol. 36, no. 4, pp. 473–478, 2021.
[12] M. H. Zarifi, S. Farsinezhad, K. Shankar, and M. Daneshmand, “Liquid sensing using active feedback assisted planar microwave resonator,” IEEE Microwave and Wireless Components Letters. 2015 Jul 14;25(9):621-3.
[13] M. S. Boybay and O. M. Ramahi, “Material characterisation using complementary split-ring resonators,” IEEE Trans. Instrum. Meas., vol. 61, no. 11, pp. 3039–3046, 2012, doi: 10.1109/TIM.2012.2203450.
[14] K. Chang and L.-H. Hsieh, “Microwave ring circuits and related structures,” Microw. Ring Circuits Relat. Struct., 2005, doi: 10.1002/0471721298.
[15] D. K. Ghodgaonkar, V. V. Varadan, and V. K. Varadan, “Free-space measurement of complex permittivity and complex permeability of magnetic materials at microwave frequencies,” IEEE Trans. Instrum. Meas., vol. 39, no. 2, pp. 387–394, 1990.
[16] S. Mohammadi, R. Narang, M. Mohammadi Ashani, H. Sadabadi, A. Sanati-Nezhad, and M. H. Zarifi, “Real-time monitoring of Escherichia coli concentration with planar microwave resonator sensor,” Microw. Opt. Technol. Lett., vol. 61, no. 11, pp. 2534–2539, 2019.
[17] M. A. H. Ansari, A. K. Jha, and M. J. Akhtar, “Design and application of the CSRR-based planar sensor for noninvasive measurement of complex permittivity,” IEEE Sens. J., vol. 15, no. 12, pp. 7181–7189, 2015.
[18] Cheng-Cheh Y, Chang K. Novel compact elliptic-function narrow-band bandpass filters using microstrip open-loop resona- tors with coupled and crossing lines. IEEE Trans Microw Theory Tech. 1998;46(7):952-958.
[19] A. Mehdi, K. Abdennacer and S. Mounir, “Analysis of the discrepancies fabricating error of microstrip antenna,” International Journal of Research and Reviews in Applied Sciences, vol. 9, no. 3, pp. 405– 412, 2011.
[20] K. Y. Yazdandoost and K. Sato, “Fabrication error in resonant frequency of microstrip antenna,” in Proc. Int. Conf. on Micromechatronics and Human Science, Nagoya, Japan, pp. 41–44, 2001.
BIOGRAPHIES

Ahmed Jamal Abdullah Al-Gburi is currently a Postdoctoral fellowship at UniversitiTeknikal Malaysia Melaka (UTeM).He received aPhD in Electronics Engineering from UTeM university within Graduate on Time (GoT).He has received the Best Paper Award from the IEEE Community and won several Gold, Silver, and Bronze medals in international and local competitions.

Zahriladha Zakaria is currently a Professor at UniversitiTeknikal Malaysia Melaka. His research areas include microwave filters, resonators, amplifiers and antennas, data communication and radio-wave propagation in wireless communication systems.

Imran Mohd Ibrahim a Senior Lecturer at UniversitiTeknikal Malaysia Melaka. He has published more than 80 journals articles and conference papers. His research interests are antennas and propagations.

Rahmi Silvia Binti Aswir received her Bachelor of Electronic Engineering with Honors from UniversitiTeknikal Malaysia Melaka. Her research areas include Sensors design.

SyahAlam was born in Jakarta, Indonesia. He received Bachelor Education of Engineering (S.Pd) degree in electrical engineering from Universitas Pendidikan Indonesia (UPI) and M.Eng (M.T) degree in telecommunication engineering from UniversitasTrisakti in 2010 and 2012, respectively.In 2021, he is pursuing his PhD at UniversitiTeknikal Malaysia Melaka (UTeM) in the field of RF and Microwave.
ACES JOURNAL, Vol. 37, No. 2, 222–228.
doi: 10.13052/2022.ACES.J.370211
© 2021 River Publishers