Research on the Characteristics of the Pantograph Arc and Analyzing its Influence on the ILS
Yingchun Xiao, Feng Zhu, Nan Lu, Zixuan Wang, and Shengxan Zhuang
1Department of Electrical Engineering
Southwest Jiaotong University, Chengdu 611756, China
1134748712@qq.com, zhufeng@swjtu.cn, LuNan946@qq.com, 942043313@qq.com
2Lanzhou City University, Lanzhou 730070, China
Submitted On: November 8, 2021; Accepted On: June 14, 2022
Abstract
In this article, a radiation model is proposed to estimate the emission of the pantograph arc. An improved least-square regression analysis method is given for studying the pantograph arc characteristics at various sites on electrified railways and at various train speeds. The radiation model and the improved least-square method were both validated using the test data. The impact of arc on the airport instrument landing system (ILS) was investigated using electromagnetic wave propagation theory and the signal-to-noise ratio requirement of the ILS. We deduced the position limit of the articulated neutral section (ANS) and verified it through experiments. This research provides a theoretical foundation and technological methodology for civil aviation and high-speed railway electromagnetic compatibility studies as well as helps for airport site selection and high-speed railway route planning.
Index Terms: Airport instrument landing system, electromagnetic emission, electromagnetic interference, improved leastsquare method, pantograph arc.
I. INTRODUCTION
With the development of high-speed electrified railways, more and more high-speed electrified railways are built near the airport to facilitate people’s travel and transportation. When the pantograph of the high-speed train is not in good contact with the contact wire, it will produce a pantograph arc [1, 2]. Especially when the high-speed train passes through the articulated neutral section (ANS), the contact wire voltage magnitude and phase will change greatly, and a large number of arcs will be produced, which last for hundreds of milliseconds [3, 4]. If the electrified railway ANS is located near the airport beacon, the transient pantograph arc may interfere with the communication between the airport beacon and the aircraft. Therefore, it is necessary to study the emission characteristics of the pantograph arc and their influence on the airport’s instrument landing system (ILS).
Different methods have been proposed to study the characteristics of the pantograph arc. Mayr [5], Habedank [6], and Cassie [7] each proposed three different theoretical models of the arc. Wang et al. [8] proposed an extended model EMTP based on Habedank’s equation and Liu et al. [9] proposed an extended black-box model considering the dynamic separation process of pantograph and contact wire. Some experimental methods have been proposed to study the relationship between the pantograph arc and train speed, pantograph gap, voltage, current, weather, measurement methods, etc.[10–12]. However, the theoretical models are limited by certain assumptions. For the experiments established in the laboratory, the train speed and power are not as high as that in the real railway environment, and there are some safety risks. It is also possible to study electromagnetic radiation through actual tests [13, 14]. China’s first national electromagnetic radiation test for electrified railways was conducted in the 1980s. However, the electrical characteristics of the contact wire are completely different from those in the early 1980s. The train speed has increased by five times, and the test equipment is also very different. These differences will inevitably affect the pantograph arc characteristics. In addition, the previous test was aimed at the pantograph arc of the ordinary position (OP) of the contact network, but the pantograph arc generated as the ANS was larger than that at the OP. Therefore, it is necessary to retest and analyze the electromagnetic emission (EME) of high-speed electrified railways. Some studies have shown that the emission from the pantograph arc may interfere with airport communication systems [15–17]. However, these studies have not verified the effect of pantograph arc on ILS signal through experiments.
To address the above issues, we proposed a radiation model for the pantograph arc and an improved least-square (LS) regression method. Based on the test data, the pantograph arc characteristics of different positions of the electrified railway and different train speeds are analyzed. The position limit of the railway ANS under the condition that the airport ILS signal is not disturbed is deduced and verified by experiments.
II. THE RADIATION MODEL OF THE PANTOGRAPH ARC
We build the radiation model based on electric dipoles. For a unit electric dipole of length , is very small and its current is . Due to the limitation of test conditions, the test distance is generally tens of meters away, and the test location is in the far field. So the E-field strength of the unit dipoles is
| (1) |
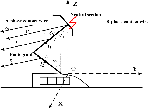
Here, is the angle between the arc radiation direction and the vertical direction. It is a spherical wave, which continuously radiates energy along the direction of . The pantograph arc radiation model can be expressed as shown in Figure 1. is the upper arm and is the lower arm of the pantograph, and the angles to the Z-axis areand, respectively. is the distance between the arc and the field, and the angles to and are and respectively. Suppose the current on is , and the current on is . If the E-field strength generated by and in the far field are and , the induced current of contact wire is , the length is , and the E-field strength is . So, the E-field strength generated by the pantograph arc is the superposition of , and in space. So,
| (2) |
As reported in [18], can be calculated by
| (3) |
Here, is the reflection coefficient of the contact wire. If the projection of on the YOZ is , and the angles of to and Z-axis are and , respectively, then
| (4) |
The E-field strength of the pantograph arc calculated by this model is related to the contact line current, the structure of the pantograph, and the relative position of the pantograph arc and the receiving point. This model does not take into account the influence of train speed. So, we also want to use test data and regression analysis methods to study the pantograph arc characteristics.
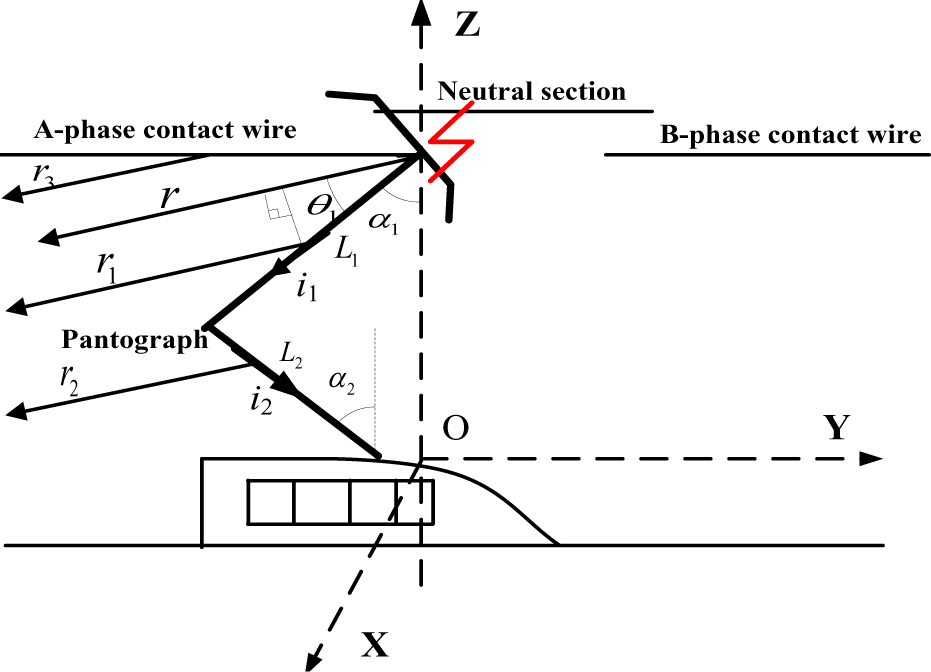
Figure 1: Pantograph arc radiation model.
III. THE IMPROVED LEAST-SQUARES METHOD
Regression analysis is an effective tool to analyze the statistical characteristics of the test data. The basic process of regression analysis includes the model assumption, parameter calculation, and the rationality of the assumed model. The LS method is an existing linear regression method. It has been used to fit the test data [19–21]. The LS model is
| (5) |
where is the E-field strength, and is the frequency. and can be calculated through the frequency domain test data.
| (6) |
where N is the number of test frequencies.
However, the error between different samples corresponding to the same frequency point is usually different, called the heteroscedasticity of the data. Therefore, the LS method cannot be used directly. We presented an improved LS model as
| (7) |
where is the number of samples, and each sample contains 1001 data. is the tested value of E-field strength. is the estimated value of the , and obtained by model fitting. and are called regression coefficients, and is the error. The variance of the error is . Only when is a constant, the regression coefficient can be directly calculated using the LS method. To make equal to the constant , we supposed is a variable and let. So,
| (8) |
where is the coefficient of , and is the coefficient of . Since is a constant, and can be directly estimated by (6). Therefore, according to (7), the fitted relationship of E-field strength and frequency can be represented by and .
In the process of calculating and , if the residual calculated is outside of the range (-2, 2), the sample should be discarded. The residual is
| (9) |
where is the average E-field strength of corresponding to . Let the estimate of the variance at be ; then
| (10) |
There are two parameters for investigating the rationality of the regression analysis model, the definition coefficient and the standard residual. The definition of coefficient is defined as follows:
| (11) |
When is close to 1, it means that most of the changes of can be explained by , which shows that the assumption model is reasonable.
The standardized residual is
| (12) |
It can be seen that the more concentrated the value of is, the closer is to . When , which can explain the rationality of the assumption model.
IV. THE CHARACTERISTICS OF THE PANTOGRAPH ARC
In this section, the improved LS method is compared with the LS method and the radiation model. The improved LS method is used to analyze the pantograph arc characteristics when the train passes through different positions of the railway at different speeds.
A Measurement
The airport ILS includes localizer (LOC), glideslope (GS), and marker beacon (MB). The corresponding working frequencies are 108.1-111.975, 328.6-335.4, and 75 MHz, respectively. Only arc emissions of the same or similar frequency to the ILS will affect its operation. So, we only measured the EME of the pantograph arc at the frequencies of 108-350 and 75 MHz. It is hard to test every frequency during the short time that the train passes. Therefore, we used the frequency sweeping technique of the electromagnetic interference receiver to test the emission of 108-350 MHz.
On the other hand, the electrified railway is generally provided with an ANS every 15–35 km, and the length of each ANS is about 300 m. The speed of the high-speed rail is about 200–380 km/h; so the train passes through an ANS every 140–630 s, which takes 2.8–5.4 s each time. The arc duration is about several hundred milliseconds. So, the measurement time must be greater than the time it takes for the train to pass through the ANS. During this time, the receiver scans several times to obtain the test results.
The EMI test receiver of R&S is used to test the electric field (E-field) strength, which works in the frequency range of 9 kHz to 3 GHz. The Log periodic antenna is used to receive the E-field, whose operating frequency ranges from 30 MHz to 2 GHz. The parameters of the test instrument should be set in strict accordance with IEC Standard 62236-2 [22].
The test layout is shown in Figure 2 (a). The height of the ANS is and away from the antenna, and m and m. The height of the antenna is , and m. The test distance is 10 m. The antenna is on the X-axis; so . Therefore, based on these parameters and the radiation model proposed above, the E-field strength of the pantograph arc can becalculated.
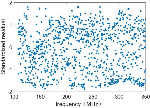
We put the experimental equipment next to the OP and ANS of different speed railway lines for multiple tests. The test method strictly follows the regulations of the standard. First, place the test instrument in an open area near the location to be tested. Second, connect the antenna to the EMI test receiver. Then, turn on the receiver and set the parameters. Set up two traces, one to record the maximum value (Max/Hold) and the other to record the instantaneous value (Clear/Write). When the train passes, the pantograph arc is generated and the recording starts. When the train leaves, pause the recording and save the data. Figure 2 (c) is an example of the measurement data that was tested next to ANS. The upper blue curve is the Max/Hold of multiple sweeps. The lower curve is the Clear/Write of a single sweep result.
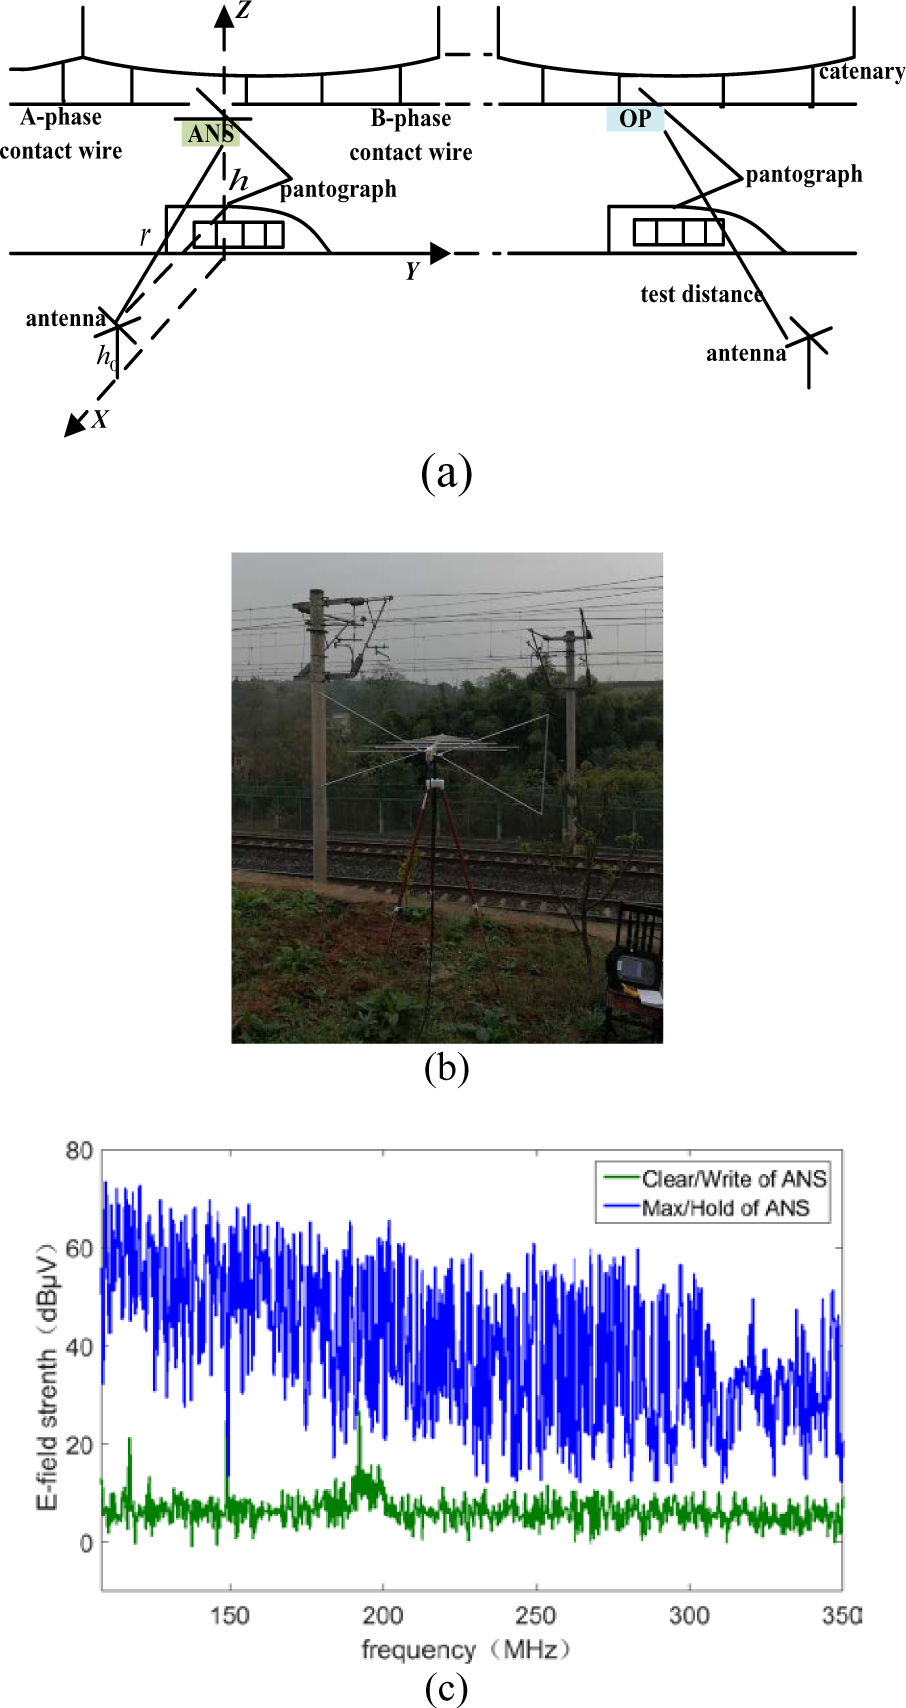
Figure 2: Test layout. (a) Test diagram. (b) Test site. (c) Measurement data when a train passes through ANS.
The measurement data includes the background noise and the EME when the train passes through the OP and ANS of the railway at different speeds. The train speeds are 120, 250, and 350 km/h, respectively. The test data plus the antenna coefficients are converted into the E-field strength values. Each sample has 1001 data points. According to these samples, the model parameters of the LS method and the improved LS method can be calculated.
V. COMPARISON OF DIFFERENT METHODS
According to the previous introduction, the E-field strength at different frequencies can be calculated based on the radiation model of the pantograph arc. Based on the test data, the fitting relationship between the E-field strength and the frequency can be obtained through the LS method and the improved LS method. For example, when the train passes through the ANS at a speed of 120 km/s, we use 16 sample data to calculate the parameters of the LS model and the improved LS model. The test data and the EME of some frequencies calculated by different methods are shown in Table 1. The frequency in Table 1 belongs to the working frequency band of airport ILS.
Table 1: The test data and the EME are calculated by different methods (dBV/m)
| Frequency (MHz) | Radiation model | LS method | Improved LS method | Test data |
| 75 | 80.23 | 76.04 | 78.60 | 79.75 |
| 108 | 76.14 | 75.20 | 76.21 | 76.56 |
| 110 | 76.30 | 74.65 | 76.07 | 75.97 |
| 112 | 76.16 | 74.12 | 75.93 | 74.16 |
| 328 | 62.17 | 52.17 | 60.33 | 61.40 |
| 330 | 61.99 | 51.99 | 60.19 | 58.90 |
| 332 | 59.63 | 51.81 | 60.04 | 60.76 |
| 334 | 61.46 | 51.63 | 59.90 | 60.62 |
| 336 | 60.48 | 51.46 | 59.75 | 58.95 |
From Table 1, the LS method, the radiation model, and the improved LS method from the test data had mean errors of 5.33, 1.18, and 0.89, respectively. The E-field strength obtained by the radiation model and the improved LS method proposed in this article has fewer errors with the test data, and both are better than the LS method. However, the radiation model does not consider the influence of train speed, which has limitations. It is not suitable for analyzing the influence of different train speeds on pantograph arc emission. So, the improved LS model is more general. We use the improved LS method to analyze the emission characteristics of the pantograph arc based on the test data.
A Emission characteristics of the pantograph arc
We analyzed the emission characteristics of the pantograph arc when trains with the same speed pass through the OP and ANS of the same railway. When the train speed is about 120 km/h, calculate the parameters of the improved LS model using 16 sample data. Calculate the definition coefficient and the standard residual. If the standardized residuals of one sample data are not concentrated in (2, 2), remove the sample data and re-fit until K is close to 1 and all standard residuals are concentrated in (2, 2). Among them, the standard residual of one sample is shown in Figure 3.
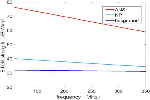
We call the pantograph arc of the train passing ANS of the ANS arc and the pantograph arc of the train passing OP of the OP arc. The curves of E-field strength and frequency under different positions of the railway are shown in Figure 4. The E-field strength of the background is small and the value is the same in the entire frequency band. When the train passes the ANS, the maximum E-field strength of the EME is about 37 dB higher than when it passes the OP and is about 45 dB higher than the background. The average E-field strength of the ANS arc is 31 dB greater than the OP arc and about 37 dB higher than that of the background.
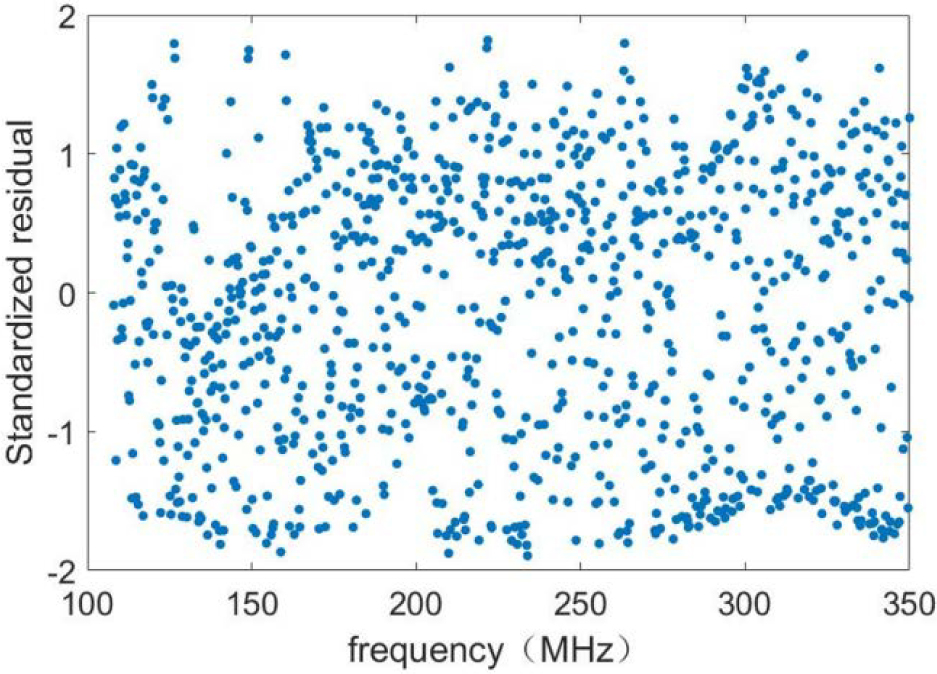
Figure 3: Standardized residual of one ANS sample data.
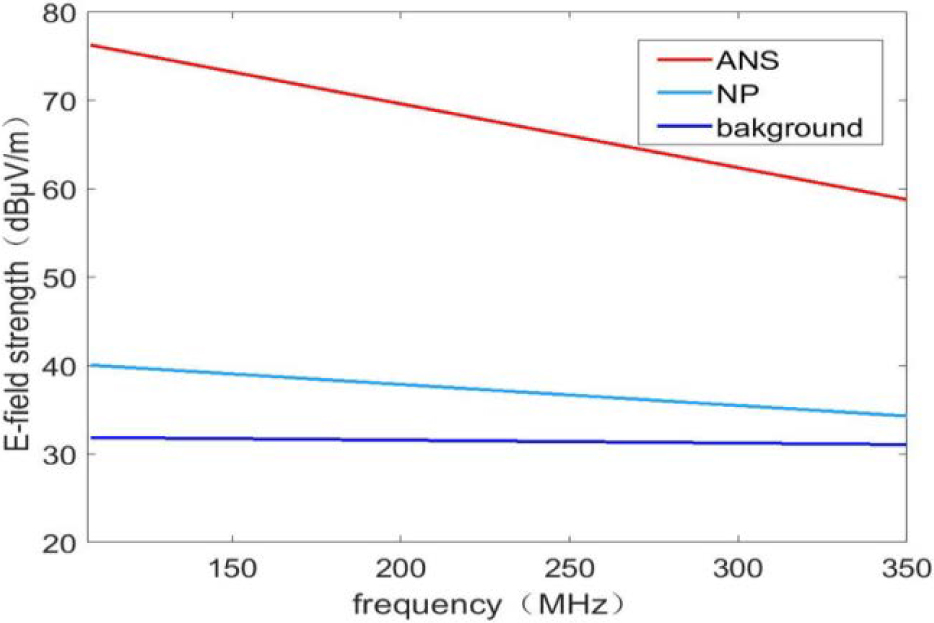
Figure 4: E-field strength and frequency curves of pantograph arc at different positions of the railway.
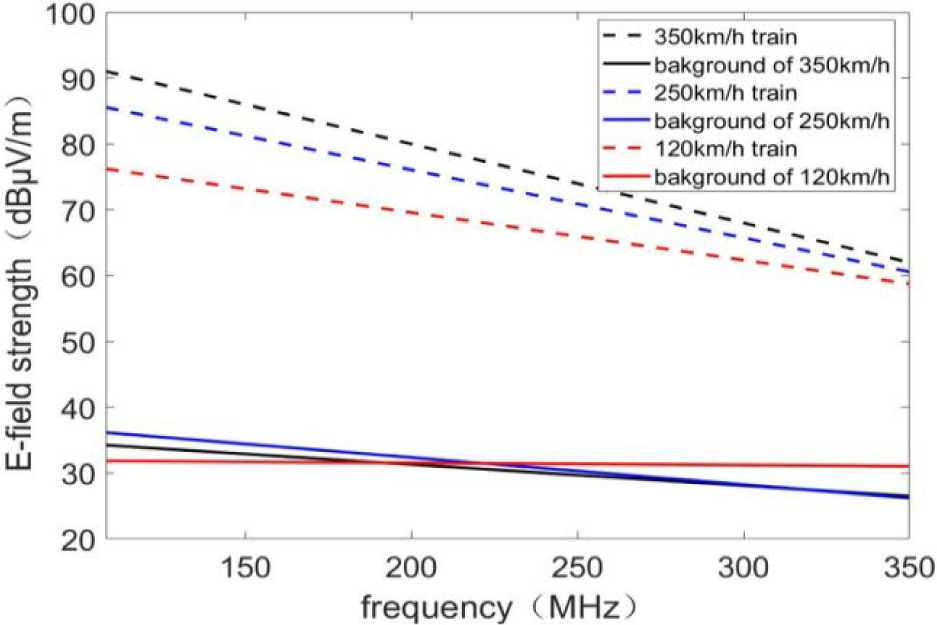
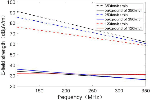
Figure 5: The E-field strength and frequency curves of the ANS arc at different train speeds.
We analyzed the emission characteristics of the pantograph arc when trains of different speeds pass through the ANS. The train speeds are 120, 250, and 350 km/h, respectively. Like the above method, the parameters of the improved LS model are calculated. E-field strength and frequency curves of ANS arc at different train speeds are shown in Figure 5. It can be seen that the maximum E-field strength of the ANS arc can reach 91 dBV/m. The three background noises are similar, and the average EME of the ANS arc generated by 350 km/h train is about 3.5 dB higher than that of 250 km/h train and about 9 dB higher than that of 120 km/h train. In addition, as the frequency increases, the speed has less influence on EME.
VI. THE EFFECT OF THE ANS ARC ON AIRPORT ILS
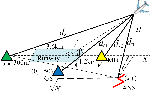
The ILS cooperates with aircraft receivers to provide a virtual path to make the aircraft land safely. The LOC guides the runway entrance horizontal position by transmitting fan-shaped radio signals; the GS guides the vertical position of the runway entrance through the radio signal beam with an elevation angle of 2.5-3.5; the MB provides the rough distance information relative to the runway entrance. The airborne ILS receiver receives the signal transmitted by the LOC, GS, and MB on the ground. The ANS arc generated by the high-speed train may affect the quality of the ILS signal received by the aircraft. Take one Chinese airport as an example to analyze the influence of EME on airport ILS when the high-speed train passes through the ANS.
A Airport ILS electromagnetic environment requirements
The LOC signal and the GS signal have similar signal formats, and both adopt the composite amplitude modulation system of 90 and 150 Hz audio amplitude modulation, which is a combination of carrier with sideband (CSB) signal and sideband only (SBO) signal in space. The airborne receiver receives the signal transmitted by the beacon, detects the 90 and 150 Hz audio components from it, and outputs the difference of depth of modulation (DDM). The DDM value can reflect the degree of deviation from the centerline of the runway and the GS, and equal to 0 on the centerline of the runway and the GS. The DDM on both sides of them are symmetrical. The International Civil Aviation Organization (ICAO) stipulates the deviation limit of DDM; the minimum deviation error of LOC is 0.004 DDM and that of GS is 0.006 DDM. To ensure the ILS signal does not interfere, the ground ILS signal received by the airborne ILS receiver must meet its signal-to-noise ratio requirements for the interference signal. One Chinese airport’s ILS parameters are shown in Table 2.
B Analysis on the EMI of ANS arc to ILS
The locations of the ILS and the ANS are shown in Figure 6 The height of the aircraft is , the distance from the ANS is , and the glide angle is which is equal to 3. The landing point is 300 m away from the runway entrance. Take the landing point as the origin of the coordinates, assuming that the coordinates of ANS are (x, y). , , and are the distances of the aircraft from LOC, GS, and MB, respectively.
Table 2: The ILS parameters
| Beacon station | MB | LOC | GS |
|---|---|---|---|
| Working frequency, f (MHz) | 75 | 108.1-111.975 | 328.6-335.4 |
| Antenna transmit power, P (W) | 2 | 15 | 9.5 |
| Antenna gain, G (dB) | 10 | 9.5 | 14.3 |
| Signal-to-noise ratio, R (dB) | 23 | 20 | 20 |
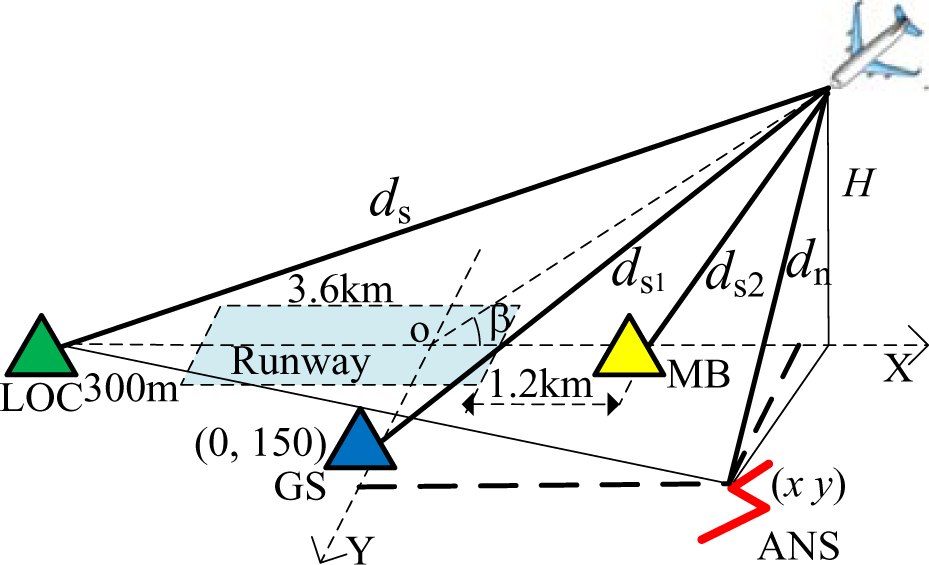
Figure 6: Schematic diagram of the ILS and the ANS.
Table 3: Experimental results.
| Experiments | 1 | 2 | 3 | 4 | 5 | 6 | 7 | 8 |
| Position of the N9310 (x, y)/m | (10, 205) | (20, 210) | (30,-215) | (37, 0) | (140, 100) | (240,-50) | (250,150) | (250,205) |
| Test values for DDM of LOC | 0.091 | 0.093 | 0.093 | 0.088 | 0.087 | 0.089 | 0.092 | 0.093 |
| Test values for DDM of GS | 0.092 | 0.093 | 0.093 | 0.087 | 0.086 | 0.087 | 0.093 | 0.093 |
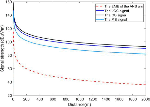
From Figure 5, the EME maximum of the ANS arc at 10 m is about 91 dBV/m. We can deduce that the EME of the ANS arc received by the airborne ILS receiver is
| (13) |
where is related to , , , and . It can be expressed as
| (14) |
According to the theory of radio wave transmission, we can deduce that the ILS signal received by the airborne ILS receiver is
| (15) |
where is the distance between the ILS beacon on the ground and the aircraft. , , and are all related to and .
According to (11), (13), and the ILS parameters in Table 2, we got the curve of various signals received by the aircraft to distance, as shown in Figure 7. During an aircraft landing, the various signals received by the aircraft increase as the distance decreases. The EME of the ANS arc changes more obviously with distance.
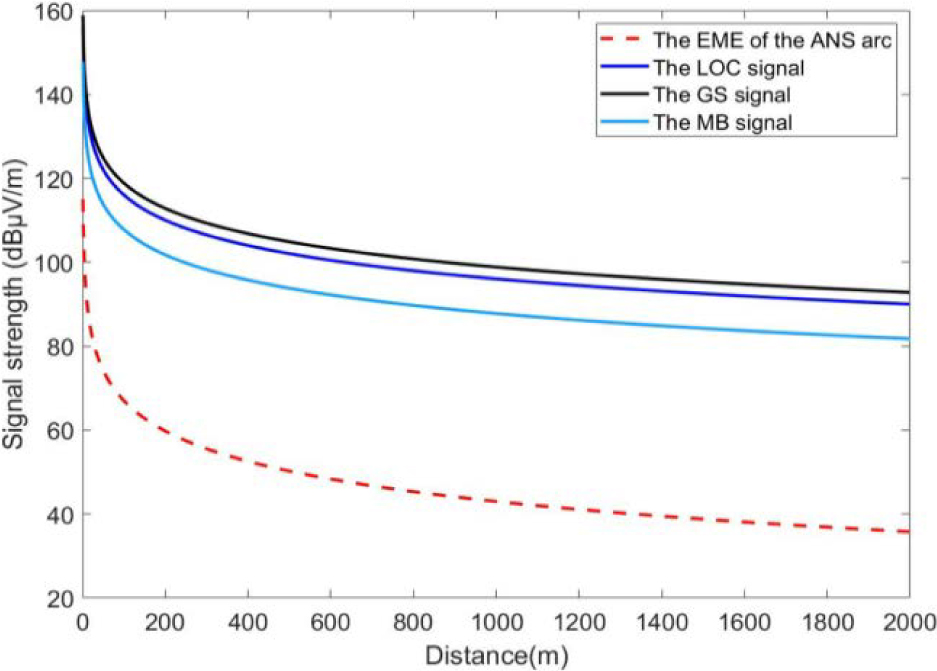
Figure 7: Signals received by the airborne ILS receiver.
To make the aircraft communicate with the beacon on the ground normally, the signal-to-noise ratio must satisfy
| (16) |
The LOC transmit power is 15 W and the antenna gain is 9.5 dB. The distance between aircraft and LOC is ,
| (17) |
It can be deduced that the position of the ANS must meet the following conditions:
| (18) |
When the aircraft is about to land at a height of 1.5 km, the vertical distance between the ANS and the runway must be greater than 990 m, and the horizontal distance from the runway entrance must be greater than 29.49 km. Otherwise, the ANS arc will affect the communication of the airport LOC.
The GS transmit power is 9.5 W and the antenna gain is 14.3 dB. The distance between aircraft and GS is ,
| (19) |
To make the GS signal not be affected by the ANS arc, we deduced that the position of the ANS must meet the following conditions:
| (20) |
The MB launches a vertical cone-shaped composite field into the air, with a signal coverage range of 60-80 m high and a lateral width of 200-400 m. The MB only provides position information to the pilot. Take the MB near the entrance of the runway as an example to analyze the influence of the ANS arc on the MB signal. As shown in Figure 6, the distance between the aircraft and MB is ,
| (21) |
To make the MB signal not be affected by the ANS arc, we deduced that the position of the ANS must satisfy
| (22) |
In fact, the altitude of the aircraft when receiving the MB signal is 60-80 m. Therefore, the ANS arc has little effect on the MB and will not cause EMI to the MB signal. To prevent the communication between the aircraft and ILS from being affected during the landing, the position of the ANS must satisfy both(18) and (20).
C Verification experiment
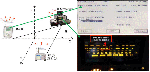
We set up an experiment to verify the above conclusion. The layout of the verification experiment is shown in Figure 8. The Avionics tester (IFR4000) transmits DDM adjustable LOC or GS signals, and the signal generator (N9310A) as an interference signal source transmits interference signal through the logarithmic antenna. The airborne ILS receiver receives the ILS signal and displays the received DDM.
At the beginning of the experiment, both IFR4000 and N9310A were about 10 m away from the airborne ILS receiver. The H is set to 0.002 km and the transmit power of the IFR4000 is 10 dbm. According to the above conclusion (18) and (20), when H is 0.002 km, the ANS position must satisfy
| (23) |
First, IFR4000 is connected to the logarithmic antenna, sets the frequency to 108.1MHz, and transmits the LOC signal (or GS signal) with a 0.093 DDM. Adjust the position of the antenna so that the DDM of the received signal is also 0.093 DDM, as shown in Figure 8.
Second, turn on the N9310A. The power is set to 91 dBV/m, and the frequency is 108.1 MHz. So, the frequency of the interference signal is the same as the working frequency of the ILS, and its amplitude is the maximum E-field strength of the ANS arc radiated.
Third, several experiments were performed by moving the position of the N9310 so that it was at different distances from the ILS receiver. During the experiment, record the DDM value displayed by the ILS receiver. The test results when the N9310 is in some positions are shown in Table 3.
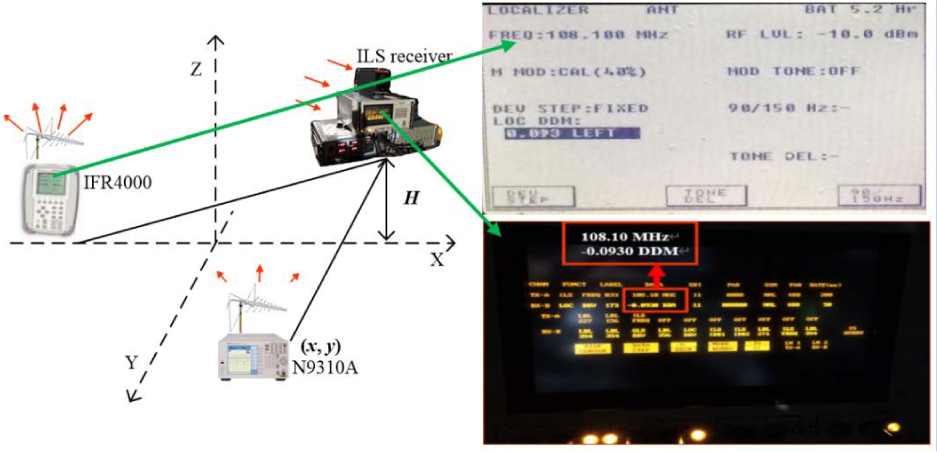
Figure 8: The verification experiment. (a) The layout of the verification experiment. (b) Parameters of the transmitted ILS signal. (c) Parameters of the received ILS signal.
The ILS communication will not be interfered with only when the DDM error between the LOC transmitted signal and the received signal is less than 0.004, and the DDM error between the GS transmitted signal and the received signal is less than 0.006. Otherwise, the communication of the airport ILS will be affected.
From Table 3, in the fourth, fifth, and sixth experiments, the coordinates of N9310 did not meet the safe distance indicated by (23). The DDM emitted by the IFR4000 is 0.093; so the DDM error of LOC is greater than 0.004 and the DDM error of GS is greater than 0.006. In other experiments, the position coordinates of N9310 satisfy the relationship of (23) and the DDM error does not exceed the limit. Multiple experiments were performed with the same results.
It can be concluded that when the ANS coordinates satisfy conditions (18) and (20), no matter whether the LOC signal or the GS signal is transmitted, the deviation error of the DDM will not be out of its range. When the ANS coordinate does not meet (18) and (20), the deviation error of DDM will exceed its range. That is, the ILS signal received by the ILS receiver will be interfered. The experiment verified our theoretical results.
VII. CONCLUSION
We proposed a radiation model of the pantograph arc and an improved LS method to analyze the emission characteristics of the pantograph arc. It concluded that when the train passes through the ANS, it will generate broadband arc emission. The average EME of the ANS arc is 31 dB higher than that of the OP arc. The higher the speed of the train is, the greater the EME of the ANS arc. The average EME of the ANS generated by a 350 km/h train is about 3.5 dB higher than that of a 250 km/h train and about 9dB higher than that of a 120 km/h train. We deduced the position limit of the electrified railway ANS relative to the airport runway, and verified it through experiments. When the aircraft is about to land at a height of 1.5 km, the vertical distance between the ANS and the runway must be greater than 990 m, and the horizontal distance from the runway entrance must be greater than 29.49 km. The MB signal will not be interfered with by the ANS arc. When the ANS position satisfies (16) and (18), the LOC and GS signals will not be interfered with by the ANS arc.
REFERENCES
[1] Y. Tang, F. Zhu, H. Lu, and X. Li, “Analysis and suppression of EMI for traction control unit speed sensors of CRH380BL electric multiple unit,” The Applied Computational Electromagnetics Society (ACES) Journal, vol. 33, no. 5, pp. 553-560, Jul. 2018.
[2] Y. Tang, F. Zhu, and Y. Chen, “Analysis of EMI from Pantograph-catenary arc on speed sensor based on the High-speed train model,” The Applied Computational Electromagnetics Society (ACES) Journal, vol. 36, no. 2, pp. 205-212, Feb. 2021.
[3] S. Midya, D. Bormann, T. Schütte, and R. Thottappillil, “DC component from Pantograph arcing in AC Traction system—Influencing parameters, impact, and mitigation techniques,” IEEE Transactions on Electromagnetic Compatibility, vol. 53, no. 1, pp. 18-27, Feb. 2011.
[4] A. Verdicchio, P. Ladoux, H. Caron, and C. Courtois, “New Medium-voltage DC railway electrification system,” IEEE Transactions on Transportation Electrification, vol. 4, no. 2, pp. 591-604, Jun. 2018.
[5] O. Mayr, “Contribution to the theory of static and dynamic arcs,” Arch. Elektrotechnik, vol. 37, no. 1, pp. 589-608, 1943.
[6] U. Habedank, “On the mathematical-description of arc behavior in thevicinity of current zero,” etzArchiv, vol. 10, no. 11, pp. 339-343, Nov. 1988.
[7] M. T. Cassie and D. B. Fang, “An improved arc model before current zero based on the combined Mayr and Cassie arc models,” IEEE Transactions on Power Delivery, vol. 20, no. 1, pp. 138-142, Jan. 2005.
[8] Y. Wang, Z. Liu, X. Mu, K. Huang, H. Wang, and S. Gao, “An extended Habedank’s equation-based EMTP model of Pantograph arcing considering Pantograph-catenary interactions and train speeds,” IEEE Transactions on Power Delivery, vol. 31, no. 3, pp. 1186-1194, Jun. 2016.
[9] Z. Liu, H. Zhou, K. Huang, Y. Song, Z. Zheng, and Y. Cheng, “Extended Black-box model of Pantograph-catenary detachment arc considering Pantograph-catenary dynamics in electrified railway,” IEEE Transactions on Industry Applications, vol. 55, no. 1, pp. 776-785, Jan.-Feb.2019.
[10] G. Gao, J. Hao, W. Wei, H. Hu, G. Zhu, and G. Wu, “Dynamics of Pantograph–catenary arc during the Pantograph lowering process,” IEEE Transactions on Plasma Science, vol. 44, no. 11, pp. 2715-2723, Nov. 2016.
[11] F. Guo, X. Feng, Z. Wang, J. You, X. Wang, D. Liu, and Z. Chen, “Research on time domain characteristics and mathematical model of electromagnetic radiation noise produced by single arc,” IEEE Transactions on Components, Packaging and Manufacturing Technology, vol. 7, no. 12, pp. 2008-2017, Dec. 2017.
[12] W. Wei, J. Wu, G. Gao, Z. Gu, X. Liu, G. Zhu, and G. Wu, “Study on Pantograph arcing in a laboratory simulation system by high-speed photography,” IEEE Transactions on Plasma Science, vol. 44, no. 10, pp. 2438-2445, Oct. 2016.
[13] D. Bellan, G. Spadacini, E. Fedeli, and S. A. Pignari, “Space-frequency analysis and experimental measurement of magnetic field emissions radiated by high-speed railway systems,” IEEE Transactions on Electromagnetic Compatibility, vol. 55, no. 6, pp. 1031-1042, Dec. 2013.
[14] R. Geise, O. Kerfin, B. Neubauer, G. Zimmer, and A. Enders, “EMC analysis including receiver characteristics - pantograph arcing and the instrument landing system,“ 2015 IEEE International Symposium on Electromagnetic Compatibility (EMC), Dresden, pp. 1213-1217, 2015.
[15] Z. Y. Ming and W. Z. An, “Analysis of airport electromagnetic environment effects from synthesized passenger transportation,” Environ. Technol., vol. 2014, no. S1, pp. 181-186, 2014.
[16] Y. Tang, F. Zhu, and Y. Chen, “Research on the influence of train speed change on the EMI of Pantograph-catenary arc to main navigation stations,” The Applied Computational Electromagnetics Society (ACES) Journal, vol. 36, no. 4, pp. 450-457, Apr. 2021.
[17] Y. Tang, F. Zhu, and Y. Chen, “For more reliable aviation navigation: Improving the existing assessment of airport electromagnetic environment,” IEEE Instrumentation & Measurement Magazine, vol. 24, no. 4, pp. 104-112,Jun. 2021.
[18] X. Li, F. Zhu, H. Lu, R. Qiu, and Y. Tang, “Longitudinal propagation characteristic of Pantograph arcing electromagnetic emission with high-speed train passing the articulated neutral section,” IEEE Transactions on Electromagnetic Compatibility, vol. 61, no. 2, pp. 319-326, Apr.2019.
[19] S. Chatterjee and A. S. Hadi, Regression Analysis by Example, 5th ed., New York: Wiley, 2013.
[20] M. G. Alijani and M. H. Neshati, “A new closed-form expression for dispersion characteristics of fundamental mode of SIW by least squares method,” The Applied Computational Electromagnetics Society (ACES) Journal, vol. 30, no. 8, pp. 930-933, Aug. 2021.
[21] N. Lu, F. Zhu, and T. Zhou, “Test and analysis of electromagnetic emission characteristics of electrified railway to airport GP,” 2019 International Applied Computational Electromagnetics Society Symposium - China (ACES) , Nanjing, China, pp. 1-2, 2019.
[22] Railway Applications – Electromagnetic Compatibility - Part 2. Emission of the Whole Railway System to the Outside World, IEC Standard 62236–2, 2018.
BIOGRAPHIES

Yingchun Xiao was born in Gansu Province, China, in 1990. She received the B.S. degree in electronic information science and technology from the Lanzhou University of Technology, Lanzhou, China, in 2012, and is currently working toward the Ph.D. degree in electrical engineering with Southwest Jiaotong University, Chengdu, China. At the same time, she is a Lecturer with Lanzhou City College.
Her research interests include electromagnetic environment test and evaluation, electromagnetic compatibility analysis and design, and identification and location of electromagnetic interference sources.

Feng Zhu received the Ph.D. degree in railway traction electrification and automation from the Southwest Jiaotong University, Sichuan, China, in 1997.
He is currently a Full Professor with the School of Electrical Engineering, Southwest Jiaotong University. His current research interests include locomotive over-voltage and grounding technology, electromagnetic theory and numerical analysis of electromagnetic field, and electromagnetic compatibility analysis and design.

Nan Lu was born in Anhui Province, China, on June 3, 1990. He received the master’s degree in electrical engineering from the Anhui University of Science & Technology, Anhui, China, in 2016, and is currently working toward the Ph.D. degree in electrical engineering with Southwest Jiaotong University, Chengdu, China.
His research interests include electromagnetic compatibility, electromagnetic environment test and evaluation, and transmission-line analysis.

Zixuan Wang was born in Shanxi Province, China, in 1998. He received the B.S. degree in electrical engineering and automation from Southwest Jiaotong University, Chengdu, China, in 2020.
He is currently working as a Research Assistant with the EMC Laboratory of Southwest Jiaotong University. His research interests include electromagnetic compatibility analysis and electromagnetic signal processing.

Shengxian Zhuang is currently working with the School of Electrical Engineering at Southwest Jiaotong University as a professor. He got his M.S and Ph.D degrees, respectively, at Southwest Jiaotong University and the University of Electronic Science and Technology of China in 1991 and 1999. From 1999 to 2003, he did postdoctoral research at Zhejiang University and Linkoing University of Sweden. He was a visiting professor at Paderborn University in Germany in 2005 and at the University of Leeds, UK in 2017.
His research interests include power conversion for sustainable energy, motor control and drive systems, power electronics and systems integration, modeling, diagnosis, and suppression of electromagnetic interference of power electronic converters.
ACES JOURNAL, Vol. 37, No. 5, 639–647.
doi: 10.13052/2022.ACES.J.370514
© 2021 River Publishers