Satellite Communication Effectiveness Evaluation Based on Distributed Multi-Node Receptions
Junbo Gu, Dongfang Zhou, Hailin Deng, Binggang Huang, Qiang Peng, Dewei Zhang, Dalong Lv and Qing Liu
1Academy of Information System Engineering, Information Engineering University, Zhengzhou, 450001, China.
junbogu@163.com
2Satellite Communication, Southwest Electronic and Telecommunication Technology Research Institute, Chengdu, 610000, China.
Submitted On: December 17, 2021; Accepted On: March 21, 2022
Abstract
Satellite-communication effectiveness evaluation is one of the key issues in the field of satellite communication links for satellite operation, maintenance, and emergency communication. However, conventional model-based calculation methods require accurate meteorological parameters, thus not applicable to practical engineering problems. In this paper, a hybrid method, combing direct calculation and equilibrium approximation, is proposed to evaluate the effectiveness of a satellite communication system, with distributed multi-node receiver stations on the earth. Especially, the proposed equilibrium approximation approach is resilient to meteorological factors. Field tests corroborate the feasibility of this new method for real-world problems.
Keywords: Satellite communication, effectiveness evaluation, equilibrium approximation.
I. INTRODUCTION
The effectiveness evaluation of satellite communication links has attracted more and more attention in recent years, as it plays a critical role for the satellite operation/maintenance, emergency/disaster relief, counter-terrorism, and stability maintenance. When natural disasters or human-made emergencies interrupt the operators’ network communication, satellite communications are more advantageous than other communication tools for rescue activities, because it has broader coverage scopes and is resilient to human attacks and weather conditions. However, the satellite communication is vulnerable to electromagnetic interference, due to various factors, such as time, path, and meteorological conditions (temperature, humidity, air pressure). Therefore, it is mandatory to evaluate the effectiveness of satellite communications.
The effectiveness of satellite communication refers to its quality and ability. Previous research on satellite performance assessment mainly focuses on the calculation of satellite links based on the attenuation model, as the effectiveness is mainly affected by various attenuations in the process of satellite signal transmission, such as free space propagation loss, rain attenuation, cloud attenuation, atmospheric gas attenuation, etc. The rain attenuation, cloud attenuation, and atmospheric gas attenuation are closely related to climatic conditions. Because of the complexity of these attenuation calculations and their important impact on satellite communications, they have attracted extensive attention. In the past few decades, many classic attenuation models have been proposed and widely used, such as (1) cloud attenuation models: the Salonen and Uppala (SU) model [1] and Dissanayake’s model [2, 3]; (2) rain attenuation models: the Recommendation ITU-R P.838-3 [4], Karasawa model [5], and SAM model [6]; (3) atmospheric gases attenuation models: Liebe’s models [7, 8] and the RecommendationITU-R P.676-12 [9].
Some recent studies have focused on refining these existing models with local climate conditions. In [10], the precipitable water vapor (PWV) data, from the Global Navigation Satellite System (GNSS), is introduced into the ITU-R cloud attenuation model, which helps achieve higher temporal and spatial resolutions for the tropical region. In [11], annual and monthly CCDF (Complementary Cumulative Distribution Functions) of rainfall rate and rain attenuation are proposed by analyzing the collected data of the Guiana Space Centre (CSG) in Kourou (French Guiana). In [12], by using rainfall rate measurements collected in Howard College at University of Kwa-Zulu Natal, the rainfall attenuation time series generated by the Synthetic Storm Technique [13] are compared with other raindrop size distribution models (the Lognormal (LGN), Gamma (GM), and Weibull (WBL) distributions). In the model-based calculation method, accurate meteorological parameters, such as rainfall height, rainfall, temperature, and cloud height, must be known. However, in the real operation, due to the limitations of geographic space, the real-time effectiveness evaluation of satellite communications often faces the following difficulties: (1) The data are generally statistical data over the years, thus poorly available [14]; (2) Because most models are sampled from several specific areas, their universality is doubtful [15]. Therefore, most model-based methods are usually limited to ideal scenarios, but not applicable to real-world engineering problems.
To resolve this problem, we propose a hybrid method, based on the direct calculation and equilibrium approximation. The innovation of this method lies in the introduction of the distributed satellite earth stations network for the effectiveness evaluation of satellite communication links. It is worth noting that the meteorological conditions in a certain area are relatively stable and consistent [16]. By building a distributed network of satellite earth stations, we use the data collected by multiple earth stations to calculate the transmission loss of the target station, so the long-term historical data is not required; instead, only short-term or real-time measurement data is needed. This hybrid method, based on the traditional model-based link calculation method, decomposes the satellite transmission loss calculation into multiple parts, and combines the theoretical direct calculation with the equilibrium approximation calculation. It is simple to use the theory to directly calculate the losses that are not related to the weather and the atmosphere. However, the direct use of the theory to calculate the losses related to the atmosphere and meteorological factors is not only complicated to calculate the model, but also difficult to obtain related meteorological parameters. Therefore, the losses related to atmospheric and meteorological factors are calculated using the equilibrium approximation method. The meteorological variables required by this method are simple, and the corresponding model is relatively simple. The combination of the two reduces the computational complexity, and makes it easier to use in practical engineering. Furthermore, we perform field experiments, corroborating that this new method can effectively eliminate the impact of uncertain meteorological factors. Therefore, this hybrid method has important application value for satellite communication effectivenessevaluation.
The novelties from this study, for the effectiveness evaluation of satellite communication links, are summarized as follows:
1. The network of distributed satellite ground stations is constructed, which enables real-time performance evaluation.
2. A new hybrid method combining direct calculation and equilibrium approximation to evaluate the effectiveness of satellite communications is proposed. This new technique has more accurate predictions and wider application scopes than conventional methods.
The remainder of this paper is structured as follows. In Section 2, we analyze the satellite communication links and their influencing factors. Section 3 describes satellite communication effectiveness evaluation based on the topology structures. In Section 4, We explain the rain attenuation model based on multi-node reception in this method in detail. The field experiments are shown in Section 6. Finally, Section 7 draws the concluding remarks.
II. ANALYSIS OF SATELLITE COMMUNICATION LINKS AND INFLUENCING FACTORS
A. Transmission characteristics of satellite communication
As shown in Figure 1, the one-way satellite communication link is composed of the uplink from the earth station to the satellite, and the downlink from the satellite to the earth station [17]. is the transmitting power at the output of the earth station. is the total path loss of the uplink. is the received power of the satellite transponder. is the transmitting power of the satellite transponder. is the total path loss of the downlink. is the received power at the input of the earth station. The effectiveness of satellite communication mainly depends on the signal quality received by the receiving station. So, this paper mainly focuses on the downlink transmission from the satellite to the earth station.
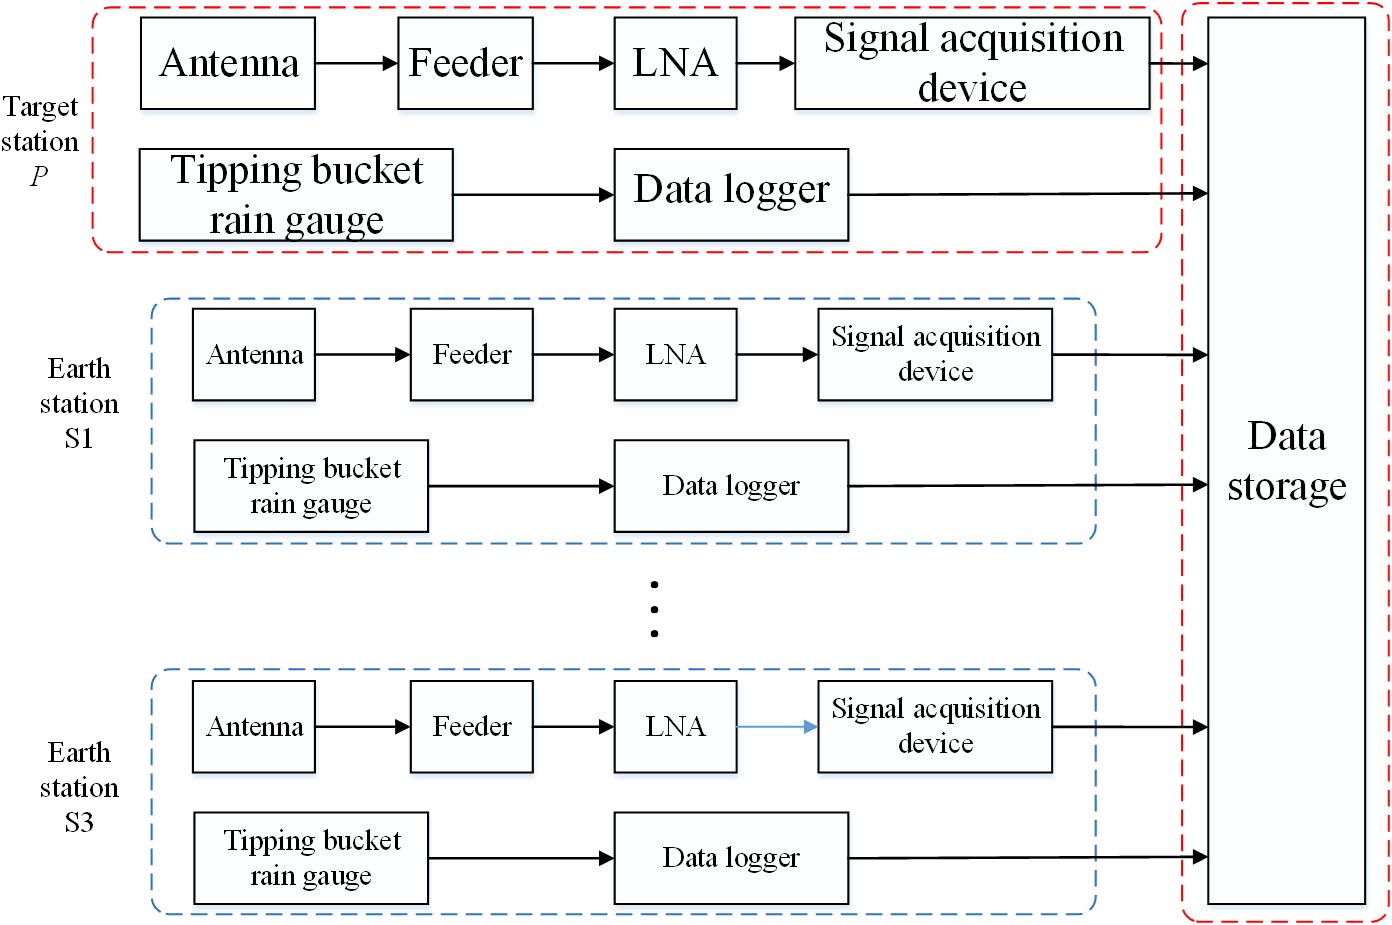
Figure 1: The diagram of one-way satellite communication link.
B. Influencing factors of satellite communication effectiveness
In the satellite downlink, the main factors affecting the receiving signal of the earth station are the transmission power of the satellite transponder and the loss from the transmission process of the satellite antenna to the ground receiving system.
When there is no interference, satellite communication executes strict power control to ensure that the transparent transponders operate in linear regions [18]. However, in practice, satellite communications may be interfered by uplink or downlink. When there is uplink interference, the transponder will change from linear state to nonlinear state or even saturated state with the increasing of the interference power, thus affecting the communication. In order to evaluate the effectiveness of satellite communications, it is necessary to measure the transmission power of the satellite transponder in real time.
In the transmission process from the satellite antenna to the ground receiving system, the signal passes through the upper atmosphere, the ionosphere, the stratosphere, and the troposphere] in turn. From the perspective of computational electromagnetics, such large-scale long-distance wave propagation can be well resolved by the total/scattered-field transmission technique [19]. It is noteworthy that [20] proposes a comprehensive computational electromagnetic algorithm, which is a remarkable tool in recent years for accurate modeling of electromagnetic wave propagation in multi-scale complex media.
The transmission loss in this process mainly includes the following two types:
1. Free space transmission loss : The loss is caused by energy diffusion with the increase of transmission distance in the process of radio wave propagation in free space.
2. Atmosphere and ionosphere loss : When the radio wave propagates through the atmosphere, it is affected by the absorption loss of the atmosphere, including the absorption of the ionosphere, and the absorption and scattering of oxygen molecules and water vapor molecules in the troposphere, clouds, fog, rain, snow, etc. These losses are closely related to the frequency of the electromagnetic wave [21], the elevation of the beam [20], and meteorological conditions.
The methods to predict the rain attenuation for a given path can be grouped into two categories, namely, physical and semi-empirical approaches. When a physical approach is used, all the input parameters are required [17]. Most prediction models resort to semi-empirical approaches. However, these semi-empirical approaches are mainly developed and evaluated using data collected in several specific areas. Therefore, they are not very effective to predict attenuation in other regions. In order to enable them to have a sufficiently preventative effect on the attenuation in other regions, an extensive meteorological database has to be used; however, these data are not usually available in most regions of the world. Therefore, in this paper, we propose a new method, combing direct calculation and equilibrium approximation to measure its effectiveness. The free space transmission loss can be directly calculated by the formula under the condition that the longitude, latitude, and altitude of the target point are known. Atmospheric and ionospheric loss is related to the real-time atmospheric and space conditions, but it is difficult to accurately measure the atmospheric and space parameters in real time, so the indirect equilibrium approximation approach isapplied.
III. SATELLITE COMMUNICATION EFFECTIVENESS EVALUATION BASED ON TOPOLOGY STRUCTURE
A. System model
According to the working orbit, the satellite communication system can be divided into high orbit satellite communication system (GEO), medium orbit satellite communication system (MEO), low orbit satellite communication system (LEO). Among them, the high orbit satellite communication system is a geostationary orbit satellite communication system. At present, communication satellites are mainly concentrated in the geostationary orbit. The geostationary orbit satellite is farther from the ground than other satellites, so it has a longer propagation delay and larger link loss. This paper focuses on the effectiveness evaluation of high orbit satellite communication systems. The satellites mentioned below refer to the geostationary communication satellites.
The coverage area of the satellite communication system is very wide. The beam of one geostationary communication satellite can cover 38% of the earth’s surface, so the corresponding satellite signal can be received by the earth station at any point in the satellite beam coverage area. In this paper, it is assumed that meteorological conditions within 50 km are stable and consistent. The network with certain topological structures is formed, by setting a certain number of earth stations near the target earth station. According to the stability and consistency of meteorological conditions, the relevant parameters of the target earth station are calculated, by using the signals from the nearby earth stations.
Considering the problem of satellite communication effectiveness evaluation under the condition of distributed multi-node reception, its topological structure model is shown in Figure 2. is the target station, and is the satellite. Suppose that a total of earth stations are selected for effectiveness calculation, and their set is expressed as . Due to the different methods used to calculate the transmitting power of satellite transponder and the loss of atmosphere and ionosphere, these earth stations are divided into two sets and . Note that and can have intersection. The data obtained from earth stations in are used to calculate the transmitting power of the satellite transponder, and the data obtained from earth stations in is used to calculate the atmospheric and ionospheric losses.

Figure 2: The distributed multi-node reception model.
B. Transmission power of the satellite transponder
Due to the large beam area of the satellite antenna, earth stations can be selected as within the range of our observation ability, when measuring the transmitting power of the satellite transponder. The meteorological conditions of these earth stations can be directly measured, that is, is known. The longitude and latitude of the earth station and the orbital position of the satellite are known. The calculation formula of the free space transmission loss is
| (1) |
where is the distance from the satellite to the earth station and is the signal wavelength, the corresponding of the earth station can be directly measured. Then the transmission power of the satellite repeater can be obtained
| (2) |
Note that the square brackets imply that
| (3) |
C. Losses of the atmosphere and ionosphere
The atmospheric and ionospheric losses are mainly composed of the ionospheric absorption loss , atmospheric absorption loss , cloud attenuation , fog attenuation , snow attenuation , and rain attenuation ,
| (4) |
As shown in (4), the atmospheric and ionospheric losses are mainly affected by meteorological factors, such as the atmosphere, clouds, rain, snow, and fog. Therefore, the following two situations should be considered, when we select earth stations to calculate atmospheric and ionospheric losses:
1. The distance between the earth station and the target point should be less than 50 km to ensure the similarity of meteorological and atmospheric conditions between the earth station and the target earth station (50 km is an empirical value derived from meteorological data, and reasons for choosing it will be detailed in the following content.). And the closer to the target station, the more similar the meteorological and atmospheric conditions in the transmission path of the signal received by the earth station are to those of the transmission path of the signal received by the target station.
2. Selected earth stations should be evenly distributed around the target points. When the earth stations are uniformly deployed near the target point, the information near the target point can be obtained more comprehensively, and the correlation of the data received by the earth stations can be reduced.
According to the above criteria, earth stations within 50 km from the target point are selected as . When using the data collected by these earth stations to calculate the atmospheric and ionospheric losses of the target station, we divide the atmospheric and ionospheric losses into two categories, the rain attenuation and losses other than rain attenuation. The reason for this classification is as follows.
Firstly, the ionospheric absorption, atmospheric absorption, cloud, and fog attenuation are usually small for satellite communications using C, Ku, and Ka bands. The ionospheric absorption loss is generally 0.23 dB [22, 23], and the atmospheric absorption loss, cloud attenuation, and fog attenuation are relatively small, generally 0.03 dB to 0.2 dB [24]. In particular, the weather such as snowfall is relatively rare, and the snowfall process is often relatively short-lived. So we do not consider snow attenuation in this article, i.e., . However, the raindrop radius is about 0.025 cm to 0.3 cm. When the wave wavelength is comparable to the raindrop radius, such as Ku-band wave wavelength is about 1.5 cm to 2.5 cm, the rainfall will often cause considerable attenuation, which may be as high as 10 dB.
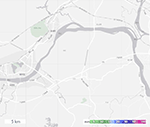
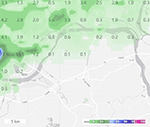
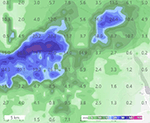
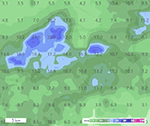
Then the ionosphere, atmospheric gases, cloud, and fog are often evenly distributed in a certain area, while the rainfall is often uneven. This is determined by the formation conditions of rainfall. As the water vapor rises, the surrounding air pressure gradually decreases; its volume expands, its temperature decreases, and it gradually turns into tiny water droplets or ice crystals floating in the air to form clouds. When the cloud droplet grows to overcome the resistance of the air and the top support of the updraft, and it does not evaporate when it falls, precipitation can be formed. For example, a typical convective rain is rain formed by local heating of the air near the ground or strong cooling of the upper air, which causes convection of the upper and lower air, the lower air to rise, the water vapor cools and condenses at high altitude. Its intensity is relatively large. Strong convective rain may be accompanied by strong wind, thunder and lightning, hail or tornado, but the rain is shorter and the rain area is smaller, or distributed in discontinuous strips. Figure 3 shows a convective rain process in a region with short-duration heavy rainfall [25]. The resolution of these images is 5 km. It can be seen from the figure that even if the two points are only about 5 km apart, their rainfall intensity may differ by 16.9 mm/h and cause about 5 dB attenuation. In contrast, as shown in Table 1, the ionosphere, atmospheric gases, cloud, and fog are relatively the same in a certain area. Table 1 shows the meteorological data for parts of Qingdao, China [25]. The rainfall in the table is the cumulative rainfall for one hour. Although the difference in rainfall in some areas is large, their other meteorological conditions are not much different. By analyzing the meteorological data of previous years and considering the size of the town comprehensively, we choose 50 km as the standard, that is, in this article we consider that the ionosphere, atmosphere, cloud and fog in the area within 50 km range are similar.
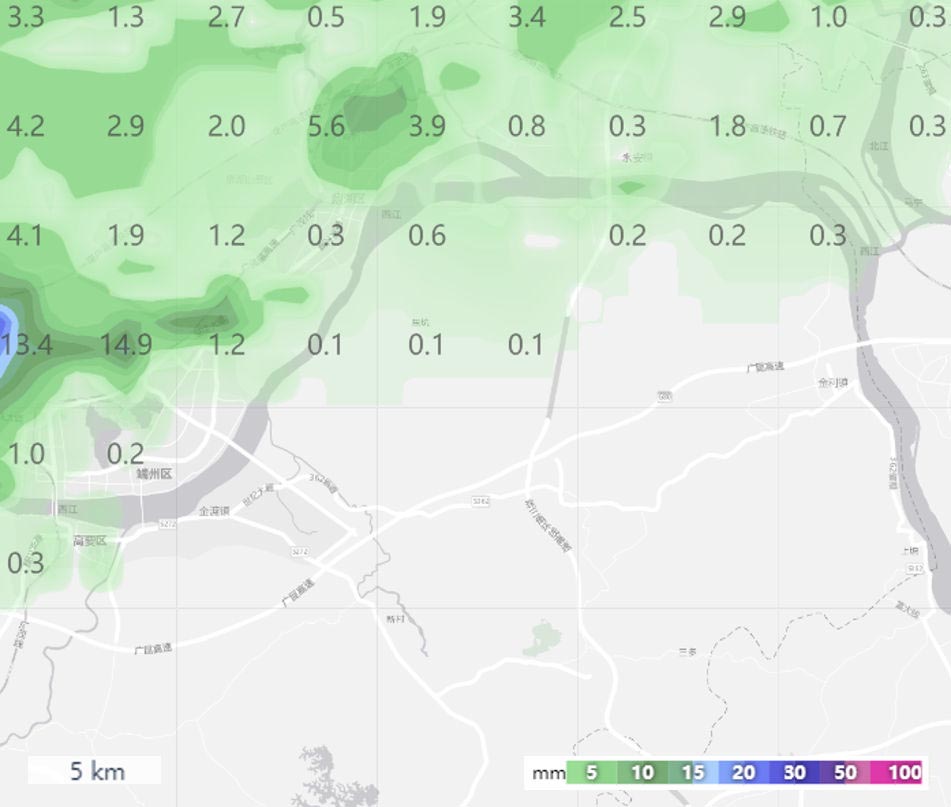
Figure 3: A convective rain process.
To sum up, considering the fact that ionospheric absorption loss, atmospheric absorption loss, cloud attenuation, fog attenuation, and snow attenuation are small, and the ionosphere, atmosphere, cloud and fog conditions are consistent within 50 km, we assume that the ionospheric absorption loss, atmospheric absorption loss, cloud attenuation, fog attenuation, and snow attenuation of the earth station are the same as those of the target station, and they are constant. Then of earth station can be written as
| (5) |
where
| (6) |
Table 1: Meteorological data of several areas in Qingdao
| Time | Location |
|
|
|
|
|
||||||||||
|---|---|---|---|---|---|---|---|---|---|---|---|---|---|---|---|---|
| Pingdu | 996.66 | 29.04 | 0.00 | 72.03 | 0.71 | |||||||||||
| Chengyang | 999.42 | 28.31 | 1.10 | 79.04 | 1.00 | |||||||||||
| Laoshan | 997.74 | 27.70 | 0.50 | 81.64 | 0.99 | |||||||||||
| 2021.07.26 03:00 | Huangdao | 994.60 | 26.95 | 3.22 | 86.64 | 1.00 | ||||||||||
| Pingdu | 996.56 | 29.26 | 0.01 | 69.13 | 0.91 | |||||||||||
| Chengyang | 999.29 | 27.51 | 3.00 | 84.85 | 0.96 | |||||||||||
| Laoshan | 997.40 | 27.28 | 2.13 | 84.54 | 1.00 | |||||||||||
| 2021.07.26 04:00 | Huangdao | 994.44 | 26.16 | 7.83 | 90.58 | 0.85 | ||||||||||
| Pingdu | 996.21 | 29.81 | 0.47 | 68.51 | 1.00 | |||||||||||
| Chengyang | 998.65 | 27.12 | 4.33 | 88.18 | 1.00 | |||||||||||
| Laoshan | 996.87 | 27.23 | 2.61 | 86.29 | 1.00 | |||||||||||
| 2021.07.26 05:00 | Huangdao | 993.88 | 25.93 | 11.32 | 92.01 | 1.00 | ||||||||||
| Pingdu | 995.80 | 29.35 | 1.31 | 73.79 | 0.99 | |||||||||||
| Chengyang | 998.26 | 27.14 | 5.07 | 88.73 | 0.99 | |||||||||||
| Laoshan | 996.54 | 27.47 | 2.06 | 83.42 | 0.99 | |||||||||||
| 2021.07.26 06:00 | Huangdao | 993.48 | 25.97 | 11.05 | 92.41 | 1.00 | ||||||||||
| Pingdu | 995.43 | 28.65 | 0.00 | 79.53 | 0.99 | |||||||||||
| Chengyang | 998.07 | 27.19 | 0.10 | 87.38 | 0.98 | |||||||||||
| Laoshan | 996.40 | 27.14 | 0.12 | 87.06 | 0.99 | |||||||||||
| 2021.07.26 07:00 | Huangdao | 993.26 | 26.24 | 0.56 | 91.92 | 1.00 |
When calculating the rain attenuation of the target station, it is mainly divided into two situations for discussion.
1. When the rainfall difference between all the earth stations in
| (7) |
with
| (8) |
and is the distance from the earth station to the target station. is added, considering that the closer the earth station is to the target station, the closer their meteorological conditions are in theory; so the data from the earth station closer to the target station is of more reference value.
2. When the difference of rainfall between some earth stations in and target stations is greater than 2 mm/h, we need to use earth stations’ data to predict the rain attenuation of the target station. The specific method will be explained in Section 4.
IV. RAIN ATTENUATION MODEL BASED ON MULTI-NODE RECEPTION
Due to the greater impact of rain attenuation on satellite links and the complexity of its calculations, it has been a hot issue in the field of satellite communications for decades. Although more than 20 rain attenuation models have been proposed so far, there are still many related studies on rain attenuation in recent years. These models can be divided into five categories: empirical models, physical models, statistical models, gradual models, and learning-based models. Among them, statistical models are widely used due to their simple input parameters. Commonly used statistical models include M-K model, ITU-R model, MARIMA model, etc. The method in this article is also mainly improved on the basis of ITU-R model.
A. ITU-R rain attenuation model
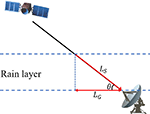
The Recommendation ITU-R P.838-3[4] is based on the model proposed by Fedi, and its core is to adopt the concept of equivalent path length, that is, to homogenize the non-uniformity of rainfall by introducing a shortening factor with an equivalent effect. The shortened path length is multiplied by the unit path attenuation (attenuation rate) to obtain the actually measured rain attenuation. The schematic diagram of the rainfall attenuation of the ground-air path is shown in Figure 4. The calculation of the ITU-R model is equipped with the following steps:
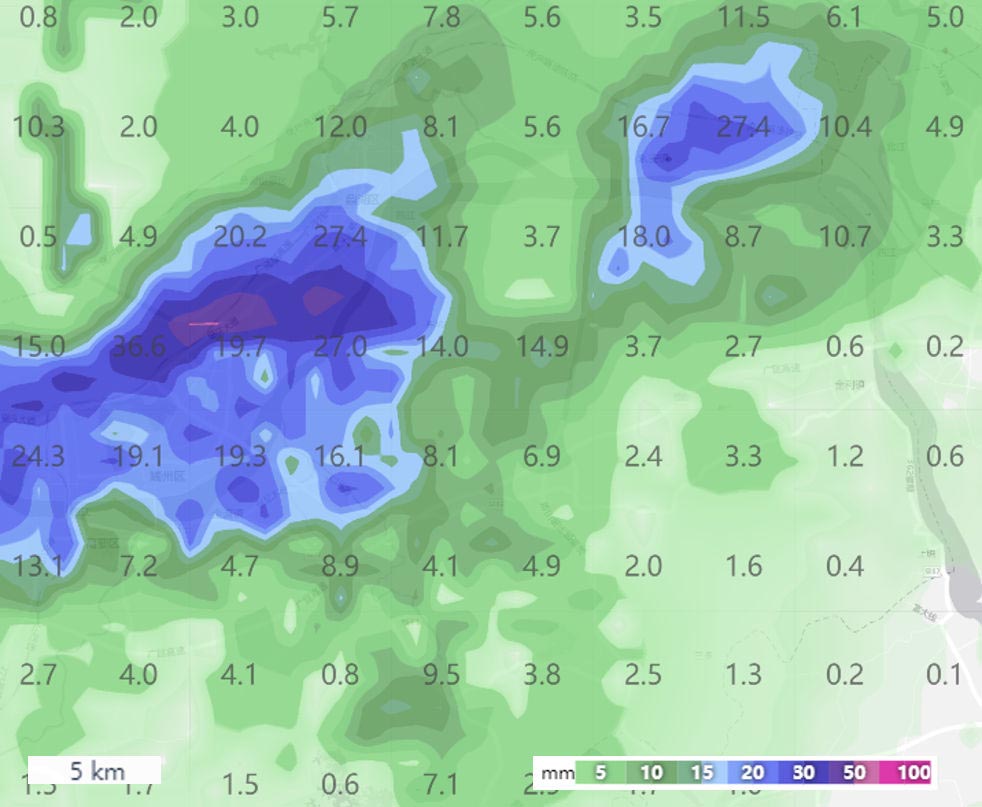
Figure 4: Schematic diagram of rain attenuation on oblique paths.
1. Calculate the slant distance of the radio wave passing through the rain area, i.e., in Figure 4.
2. Calculate the rain attenuation rate . The rain attenuation rate (dB/km) indicates the amount of rain attenuation per unit of transmission distance, which is determined by the rainfall rate (mm/h) and the polarization mode of the radio wave. It can be calculated by (9).
| (9) |
where and are functions related to frequency, path elevation, and polarization inclination.
3. Calculate the horizontal reduction factor :
| (10) |
where , is the horizontal projection of the slant-path as shown in Figure 4 and is given by the following expression:
| (11) |
4. The total predicted path attenuation (dB) is obtained from:
| (12) |
where is the effective path length.
B. A robust new attenuation model
The calculation of rain attenuation rate and effective path length is very important for the ITU-R model. But , , and are difficult to measure directly. If empirical values are used, the effect may not be ideal when the ITU-R model is applied in different climate zones. There are also many papers dedicated to solving this problem. For example, they use data from previous years in a certain area to revise and . The method in this paper is different from this, we use the data measured at nearby stations to calculate , , and . Since each earth station is close enough to the target station and receives the same signal from the transmitting station, their frequency, path elevation and polarization inclination are the same. Therefore, it can be considered that and of each earth station and those of the target station are the same, and their equivalent rain decline paths are approximately equal. The atmospheric and ionospheric losses of the earth station can be written as
| (13) |
where , , , and are the undetermined parameters. From the signals received by earth stations, groups of observation data can be obtained. A nonlinear optimization problem is set up to obtain the parameters , where we minimize the objective function for given groups of observation data,
| (14) | ||
Then, the atmospheric and ionospheric losses of the target station can be calculated by estimating the rainfall of the target station.
V. DATA COLLECTION AND PROCESSING
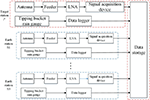
In order to verify the reliability of the method in this paper, we selected a synchronous orbiting satellite in orbit 113°E and some earth stations in Qingdao, China for field measurement. The relevant parameters of the satellites and earth stations are shown in Table 2. In order to collect the required signal reception power and rainfall intensity data, we set up a data collection system between the target station and the earth stations , and . The schematic diagram of the system is shown in Figure 5.
Table 2: System parameters
| Class | Name | Parameter |
| Orbital position | 113°E | |
| Satellite | Downlink frequency (MHz) | 12334 |
| Antenna aperture (m) | 7.5 | |
| Antenna efficiency | 0.6 | |
| Position | 36.104°N, 120.460°E | |
| Target station P | Elevation (m) | 45 |
| Antenna aperture (m) | 13 | |
| Antenna efficiency | 0.6 | |
| Position | 36.109°N, 120.444°E | |
| Elevation (m) | 46 | |
| Earth station | Distance from target station (km) | 1.6065 |
| Antenna aperture (m) | 16 | |
| Antenna efficiency | 0.6 | |
| Position | 36.446°N, 120.666°E | |
| Elevation (m) | 84 | |
| Earth station | Distance from target station (km) | 42.2625 |
| Antenna aperture (m) | 16 | |
| Antenna efficiency | 0.6 | |
| Position | 36.456°N, 120.646°E | |
| Elevation (m) | 84 | |
| Earth station | Distance from target station (km) | 42.5299 |
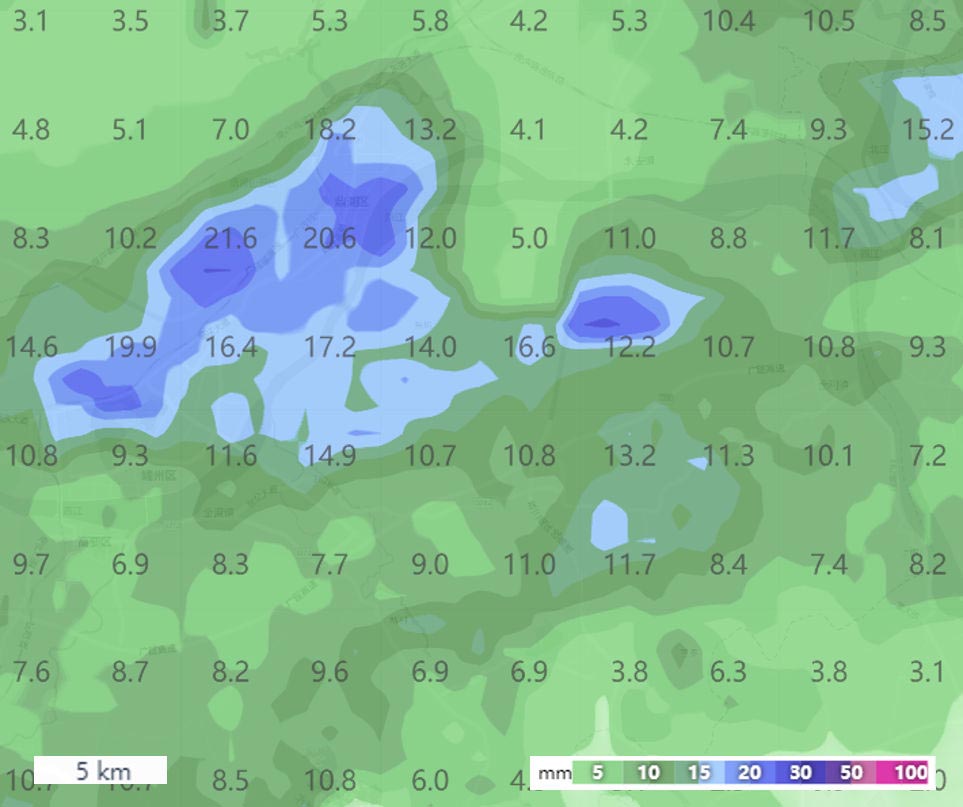
Figure 5: Data collection systems.
The system is divided into two parts: the data storage center set up in the target station, and the data acquisition subsystem distributed in earth stations (including the target station). Its data acquisition subsystem mainly realizes the following functions.
1. Signal acquisition. Each earth station has a Cassegrain antenna to receive satellite signals. As shown in Table 2, the antenna parameters of different sites are different. All antennas have been adjusted to point to the target satellite. The signal received by the antenna is transmitted to the computer room via the feeder and the low-noise amplifier (LNA). Then we use signal acquisition equipment to analyze its carrier and collect its power. Finally, the collected data is transmitted to the data storage center of the target station through the network.
2. Rain intensity measurement. A tipping bucket rain gauge is installed at each station. The rain gauge can output the rainfall in the form of digital information, which is on-off value. Through the data recorder, it is sampled every one minute, and the rainfall intensity of one-minute time integration can be obtained. Then the rainfall intensity data is also transmitted to the data storage center of the target station through the network.
The data collected by this system needs to be preprocessed when applied to the calculation of the method in this paper. The collected carrier power needs to be equivalent to the antenna receiving end in order to facilitate link calculations. The signal power actually received by the earth station mentioned in the next section refers to the carrier power equivalent to the antenna receiving end. To this end, it is necessary to know the antenna gain, feeder loss and LNA gain. The receiving gain of the antenna can be calculated by (15) from the antenna diameter and antenna efficiency.
| (15) |
where is the area of the antenna aperture, is the wavelength, and is the antenna efficiency. The sum of the feeder loss and LNA gain of the earth station is measured at the input end of the feeder and the output end of the LNA using data acquisition equipment. Therefore, the signal power actually received by the earth station mentioned in the next section is obtained from
| (16) |
where is the signal power recorded by the signal acquisition equipment of the earth station .
VI. EXAMPLE VERIFICATION
In order to verify the accuracy of the proposed algorithm, field measurements are carried out under different meteorological conditions, and the signal power of the target station calculated by the proposed method is compared with the actual received power and the theoretical calculation power of ITU-R model. The ITU-R model in the calculation below comes from the latest ITU-R 2019 standard (Recommendation ITU-R P.341-7 [26], Recommendation ITU-R P.676-12 [9], Recommendation ITU-R P.838-3 [4], Recommendation ITU-R P.839-4 [27], Recommendation ITU-R P.840-8 [1]).
Table 3: Weather conditions
| Time | ||||
|---|---|---|---|---|
| Cloudy | Rain (41 mm/h) | Cloudy | Sunny | |
| Cloudy | Rain (33 mm/h) | Cloudy | Sunny | |
| Cloudy | Cloudy | Sunny | Cloudy | |
| Cloudy | Rain (5.8 mm/h) | Sunny | Cloudy |
We measured the target station and three earth stations at four time points (, , and ) during 26/07/2021 to 30/07/2021, and calculated the theoretical value of by using the data obtained from , and . The atmospheric and ionospheric losses of station are known. The meteorological conditions at , , and are shown in Table 3. Tables 4 and 5 show the measured power of the four stations, the results calculated by the method in this paper, the results calculated by the ITU-R model, and their corresponding differences. In order to more intuitively show the difference between the measured data, calculated values and ITU-R model values, we draw Figures 6 and 7. In Figures 6 and 7, we compare the measured data, calculated values, and ITU-R model values for carries with center frequencies of 12.334 GHz and 12.700 GHz, respectively. Except for , there was no rain at the four earth stations. So, (7) was only needed to be used for calculation at other times. At , , and have rain, and the rainfall of them is quite different. Therefore, (14) was used for calculation. As shown in the above tables and figures, at , when the carrier frequency is 12.334 GHz, the calculation accuracy of the method proposed in this paper is slightly lower than that of the ITU-R model by 0.03 dB, which is very small, and the calculation errors of the two methods are very small, indicating that the two methods are relatively accurate. In addition, in other cases, the method proposed in this paper has better computational accuracy than the ITU-R model. Especially in the weather with heavy rain at , it can still maintain good accuracy.
Table 4: The power of each station and the calculated power of at the time of , , and , frequency 12.334 GHz.
| Power(dBW) | ||||||
|---|---|---|---|---|---|---|
|
148.79 | 152.52 | 148.77 | 148.97 | ||
|
149.66 | 147.82 | 147.82 | 150.17 | ||
|
150.76 | 148.61 | 148.68 | 150.30 | ||
|
-149.06 | 154.01 | 148.15 | 148.49 | ||
|
148.90 | 154.32 | 147.80 | 148.85 | ||
|
149.19 | 153.27 | 148.58 | 149.64 | ||
|
0.16 | 0.31 | 0.35 | 0.36 | ||
|
0.13 | 0.74 | 0.43 | 1.15 |
Table 5: The power of each station and the calculated power of at the time of , , and , frequency 12.700 GHz.
| Power(dBW) | ||||||
|---|---|---|---|---|---|---|
|
160.93 | 164.12 | 161.19 | 161.06 | ||
|
161.39 | 160.60 | 160.02 | 161.52 | ||
|
162.36 | 161.63 | 160.60 | 162.36 | ||
|
160.99 | 164.82 | 160.22 | 160.90 | ||
|
160.12 | 164.71 | 160.71 | 160.41 | ||
|
159.28 | 165.81 | 159.14 | 159.72 | ||
|
0.87 | 0.11 | 0.49 | 0.49 | ||
|
1.71 | 0.99 | 1.08 | 1.18 |
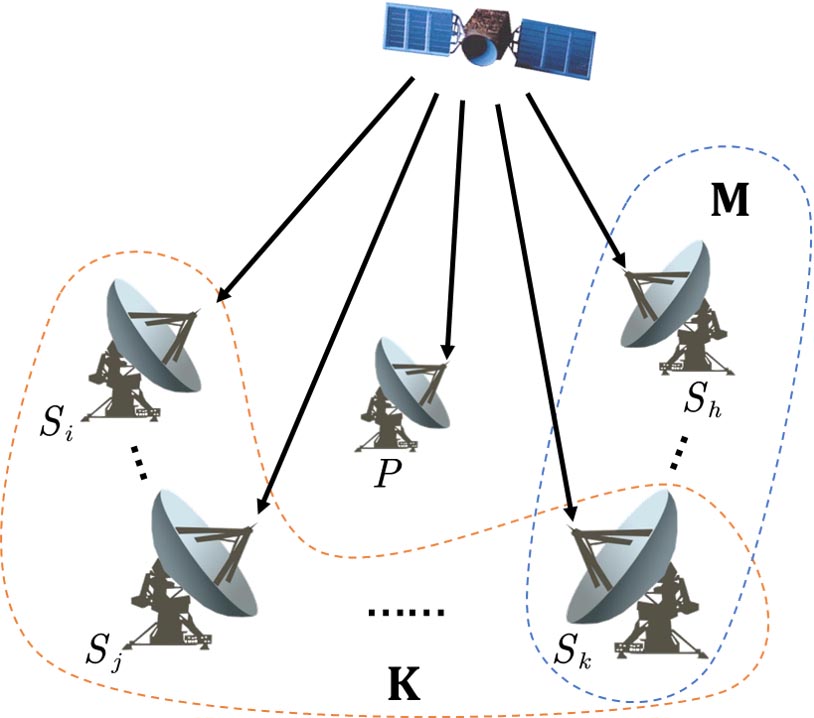
Figure 6: The actual received signal power and calculated signal power of the target station , frequency 12.334 GHz.
To confirm whether this method is suitable for different frequencies, we selected , and stations and measured nine carriers on 19/10/2021. There was no rain at each station. The measurement data of each station and calculation data are shown in Table 6. Figure 8 shows the error curve between the measured received signal power of the target station and the theoretical calculation value. As shown in Figure 8, for different frequencies, the calculation error of the method proposed in this paper is less than 1 dB. Therefore, we can conclude that the variation of frequency has little effect on the accuracy of the method.
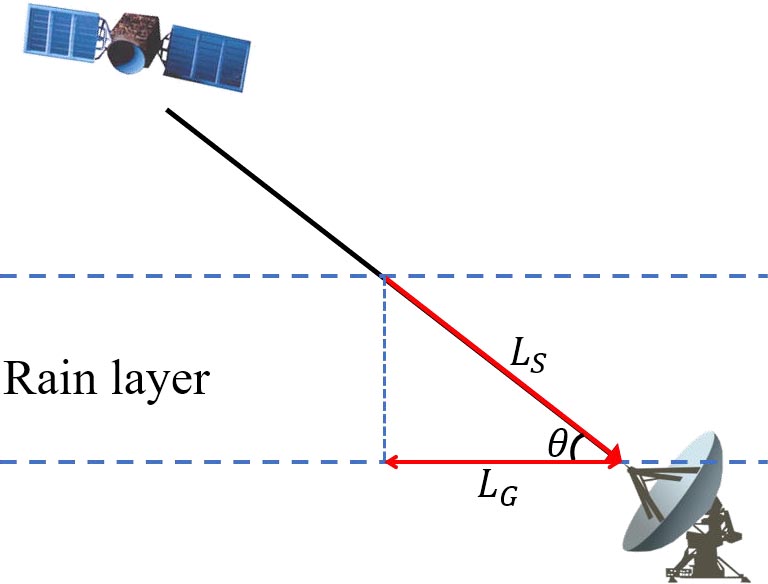
Figure 7: The actual received signal power and calculated signal power of the target station , frequency 12.700 GHz.

Figure 8: The absolute errors of different carriers.
VII. CONCLUSION
In Table 7, we refer to some attenuation calculation models newly proposed in recent years to compare with our proposed model, in terms of function, model complexity, dependent database, and university. Compared with other methods, the method proposed in this paper has the following advantages.
Table 6: The actual received signal power and measured attenuation of different carriers
| Frequency (GHz) | 12.334 | 12.347 | 12.417 | 12.498 | 12.514 | 12.59 | 12.602 | 12.676 | 12.700 |
| (dBW) | 140.24 | 136.19 | 135.29 | 129.52 | 140.35 | 128.62 | 133.23 | 142.5 | 139.13 |
| (dBW) | 140.11 | 135.22 | 134.9 | 129.59 | 139.97 | 129.21 | 133.97 | 142.19 | 139.55 |
| (dBW) | 141.55 | 135.56 | 135.7 | 130.97 | 142.9 | 121.87 | 132.72 | 141.27 | 138.26 |
| Calculation Result (dBW) | 140.16 | 135.24 | 134.93 | 129.64 | 140.08 | 128.94 | 133.93 | 142.16 | 139.5 |
| Absolute Error (dB) | 0.08 | 0.95 | 0.36 | 0.12 | 0.27 | 0.32 | 0.7 | 0.34 | 0.37 |
Table 7: Comparison of several attenuation methods
| Study | Model | Function |
|
Dependent database | Universality | |||||||||||||||
| [1, 4, 9, 26, 27] | ITU-R Model |
|
Complex |
|
Universal | |||||||||||||||
| [28] |
|
|
|
|
Universal | |||||||||||||||
| [29] |
|
|
|
None | Universal | |||||||||||||||
| [30] |
|
|
Complex |
|
Universal | |||||||||||||||
| [16] |
|
|
Simple |
|
Universal | |||||||||||||||
| [10] |
|
|
|
|
|
|||||||||||||||
|
|
|
Simple |
|
Universal |
1. The computational complexity of our model is low. Moreover, the data needed in this method are only the received signal power and rainfall intensity of the earth stations, which can be obtained through ordinary signal acquisition equipment and rain gauges. In contrast, the rain height and the storm velocity required by E-SST and the precipitable water vapor (PWV) data required by the high resolution ITU-R cloud attenuation model can only be obtained through special equipment, which means the data can only be obtained from professional institutions. It increases the difficulty of data acquisition and may result in insufficient spatial accuracy of the acquired data.
2. The total attenuation of the link can be directly calculated. The models in the table can only calculate one or more attenuation except the ITU-R model. Although the ITU-R model can calculate all attenuations, its computational complexity is higher than the method in this paper.
3. The dependent database is simple. As mentioned in the first item, the data required is simple. More importantly, it only needs to collect the ground data in a short time. Except rainfall model based on a multilayer medium model, other methods require data collected over the years to ensure the accuracy of the model.
4. Our model has universal applicability. The high resolution ITU-R cloud attenuation model is mainly applicable to the tropics, because it uses the database of the tropics to modify its model. Although the ITU-R model is a universal model, current studies have shown that its adaptability in some areas (such as the tropics) is not very good. The universality of modeling of effective path-length based on rain cell statistics is also questionable, as it drives parameters of rain cell statistics from Korea domestic meteorological-radar measurement data. The method in this paper is calculated by the earth station deployed near the point of interest, so its adaptability to different regions can be guaranteed.
In conclusion, this paper presents a hybrid method combing direct calculation and equilibrium approximation to evaluate the satellite communication effectiveness. This method only needs to use short-term or real-time data to calculate the attenuation, and the corresponding link effectiveness can be accurately calculated under the condition where the transmitting power of the satellite is uncertain and the meteorological conditions of the target earth station cannot be measured. Since this method does not modify the attenuation model by using historical data, it only needs to select the station near the target point, thus insensitive to the target point. Therefore, this method is applicable to regions with different climates. Furthermore, we perform field tests on a synchronous orbiting satellite in orbit 113°E and some earth stations in Qingdao, the predicted results using our proposed model are compared. The results show that the proposed method has an improved performance than conventional ITU-R model.
REFERENCES
[1] ITU-R, “Attenuation due to Clouds and Fog,” Recommendation ITU-R P. 840-8, Geneva, 2019.
[2] A. Dissanayake, J. Allnutt, and F. Haidara, “Cloud Attenuation Modelling for SHF and EHF Applications,” International Journal of Satellite Communications, vol. 19, pp. 335-345, 2001.
[3] A. Dissanayake, J. Allnutt, and F. Haidara, “A Prediction Model that Combines Rain Attenuation and other Propagation Impairments along Earth-satellite Paths,” IEEE Transactions on Antennas and Propagation, vol. 45, no. 10, pp. 1546-1558, 2002.
[4] ITU-R, “Specific Attenuation Model for Rain for use in Prediction Methods,” Recommendation ITU-R P. 838-3, Geneva, 2005.
[5] M. Yamada, Y. Karasawa, M. Yasunaga, and B. Arbesser-Rastburg, “An Improved Method for Rain Attenuation in Satellite Communications Operating at 10 to 20 GHz,” Radio Science, vol. 22, no. 6, pp. 1053-1062, 1987.
[6] W., L., Stutzman, K., M., and Yon, “A Simple Rain Attenuation Model for Earth-space Radio Links Operating at 10–35 GHz,” Radio Science, 1986.
[7] H. Liebe, “An Atmospheric Millimeter Wave Propagation Model”, pp. 118, 1983.
[8] H. Liebe, “An Updated Model for Millimeter Wave Propagation in Moist Air,” Radio Science - RADIO SCI, vol. 20, pp. 1069-1089, 1985.
[9] ITU-R, “Attenuation by Atmospheric Gases and Related Effects,” Recommendation ITU-R P. 676-12, Geneva, 2019.
[10] F. Yuan, Y. H. Lee, Y. S. Meng, S. Manandhar, and J. Ong, “High Resolution ITU-R Cloud Attenuation Model for Satellite Communications in Tropical Region,” IEEE Transactions on Antennas and Propagation, pp. 1-1, 2019.
[11] X. Boulanger, B. Benammar, and L. Castanet, “Propagation Experiment at Ka-Band in French Guiana: First Year of Measurements,” IEEE Antennas and Wireless Propagation Letters, pp. 1-1, 2019.
[12] D. Sumbiri and T. Afullo, “An Overview of Rainfall Fading Prediction Models for Satellite Links in Southern Africa,” Progress In Electromagnetics Research B, vol. 90, pp. 187-205, 2021.
[13] E. Matricciani, “Physical-mathematical Model of the Dynamics of rain Attenuation based on Rain Rate Time Series and Two Layer Vertical Structure of Precipitation,” Radio Science - RADIO SCI, vol. 31, pp. 281-296, 1996.
[14] J. Ojo, O. Ajewole, and S. Sarkar, ‘‘Rain Rate and Rain Attenuation Prediction for Satellite Communication in Ku and Ka Bands over Nigeria,” Progress in Electromagnetics Research B, vol. 5, pp. 207-223, 2008.
[15] S. Shrestha and D. Y. Choi, “Diurnal and Monthly Variations of Rain Rate and Rain Attenuation on ka-band Satellite Communication in South Korea,” Progress In Electromagnetics Research B, vol. 80, pp. 151-171, 2018.
[16] L. Luini, G. Siles, J. Riera, C. Riva, and J. Nessel, “Methods to Estimate Gas Attenuation in Absence of a Radiometer to Support Satellite Propagation Experiments,” IEEE Transactions on Instrumentation and Measurement, pp. 1-1, 2019.
[17] T. Pratt, C. Bostian, and J. Allnutt, Satellite Communications, 2003.
[18] D. Cimini, F. Marzano, M. Biscarini, R. Gil, P. Schluessel, F. Concaro, M. Marchetti, M. Pasian, and F. Romano, “Applicability of the Langley Method for Non-Geostationary In-Orbit Satellite Effective Isotropic Radiated Power Estimation,” IEEE Transactions on Antennas and Propagation, pp. 1-1, 2021.
[19] Q. Zhan, Q. Ren, Q. Sun, H. Chen, and Q. H. Liu, “Isotropic Riemann Solver for a Nonconformal Discontinuous Galerkin Pseudospectral Time-domain Algorithm,” IEEE Transactions on Geoscience and Remote Sensing, vol. 55, no. 3, pp. 1254-1261, 2017.
[20] Q. Zhan, Y. Wang, Y. Fang, Q. Ren, S. Yang, W. Y. Yin, and Q. H. Liu, “An Adaptive High-Order Transient Algorithm to Solve Large-Scale Anisotropic Maxwell’s Equations,” IEEE Transactions on Antennas and Propagation, pp. 1-11,2021.
[21] Q. Zhan, M. Zhuang, Q. Sun, Q. Ren, Y. Ren, Y. Mao, and Q. H. Liu, “Efficient Ordinary Differential Equation-based Discontinuous Galerkin Method for Viscoelastic Wave Modeling,” IEEE Transactions on Geoscience and Remote Sensing, vol. 55, no. 10, pp. 5577-5584, 2017.
[22] C. G. Little and H. Leinbach, “Some Measurements of High-Latitude Ionospheric Absorption Using Extraterrestrial Radio Waves,” Proceedings of the Ire, vol. 46, no. 1, pp. 334-348, 1958.
[23] L. Zheng, Q. Zhao, and X. Xing, ‘‘Effect of Plasma on Electromagnetic Wave Propagation and THz Communications for Reentry Flight,” Applied Computational Electromagnetics Society (ACES) Journal, vol. 30, pp. 1241-1245, 2015.
[24] T. V. Omotosho, M. L. Akinyemi, J. S. Mandeep, and M. Abdullah, “Total Atmospheric Absorption of Fixed Satellite Communication Signal due to Oxygen and Water Vapor in Nigeria,” IEEE Antennas and Propagation Magazine, vol. 56, no. 2, pp. 108-121, 2014.
[25] National Meteorological Information Center, Republic of China, No. 46, Zhongguancun South Street, Haidian District, Beijing, http://data.cma.cn.
[26] ITU-R, “The concept of Transmission Loss for Radio Links,” Recommendation ITU-R P. 341-7, Geneva, 2019.
[27] ITU-R, “Rain height model for Prediction Methods,” Recommendation ITU-R P. 839-4, Geneva, 2013.
[28] L. Luini, A. Panzeri, and C. Riva, “Enhancement of the Synthetic Storm Technique for the Prediction of Rain Attenuation Time Series at EHF,” IEEE Transactions on Antennas and Propagation, pp. 1-1, 2020.
[29] J. Tian and J. Shi, “A New Method for Analyzing the Attenuation Characteristics of Satellite Radar Altimeter Signals Due to Rainfall Based on a Multilayer Medium Model,” Radio Science, vol. 55, 2020.
[30] W. G. Kang, T. H. Kim, S. W. Park, I. Y. Lee, and J. K. Pack, “Modeling of Effective Path-Length Based on Rain Cell Statistics for Total Attenuation Prediction in Satellite Link,” Communications Letters, IEEE, vol. 22, no. 12, pp. 2483-2486,2018.
BIOGRAPHIES

Jun-Bo Gu was born in 1998. She received the B.S. degree in information engineering from the Information Engineering University, Zhengzhou, China, in 2019. She is currently pursuing the M.S. degree in the Information Engineering University, Zhengzhou, China. Her current research interests include satellite communication and satellite link calculation.

Dong-Fang Zhou was born in 1963. He received the Ph.D. degree from Zhejiang University, Hangzhou, China. He is currently working at the Information Engineering University, Zhengzhou, China. His current research interests include microwave antennas and satellite communication.

Hai-Lin Deng was born in 1992. He received the Ph.D. degree from the National Digital Switching System Engineering and Technology Research and Development Center, Zhengzhou, China, in 2019. He is currently working at the information engineering university. His current research interests include RF/microwave devices for wireless communications and radar systems and satellite communication.

Bing-Gang Huang was born in 1980. He received the Ph.D. degree from the PLA University of Science and Technology, Nanjing, China, in 2008. He is currently working at the Southwest Electronic telecommunication Technology Research Institute, Chengdu, China. His current research interests include satellite communication and signal processing.

Peng Qiang was born 1987.He received the master degree from College of Information Engineering, Zhengzhou, China. He is an engineer with Southwest Electronic telecommunication Technology Research Institute, Chengdu, China.He current research interests include Satellite communication and microwave technology, signal processing.

De-Wei Zhang was born in 1973. He received the Ph.D. degree from the Information Engineering University, Zhengzhou, China, in 2005. He is currently working at the Information Engineering University. His current research interests include RF/microwave devices for wireless communications and radar systems and satellitecommunication.

Da-Long Lv was born in 1981. He received the Ph.D. degree from the Information Engineering University, Zhengzhou, China, in 2013. He is currently working at the Information Engineering University. His current research interests include RF/microwave devices and satellite communication.

Qing Liuq was born in 1991. He received the B.S. degree in communications engineering from Hunan University, Changsha, China, in 2014, and received the Ph.D. degree from the Information Engineering University, Zhengzhou, China, in 2020. He is currently working at the information engineering university. His current research interests include microwave filters and satellite communication.
ACES JOURNAL, Vol. 37, No. 3, 335–347.
doi: 10.13052/2022.ACES.J.370311
© 2021 River Publishers