Evaluation of Pipe Cracks Based on Cloud Contour of Three-Dimensional Induced Eddy Current Field
Feng Jiang, Li Tao, Long Geng, and Tong Xu
1School of Electrical and Information Engineering, Changzhou Institute of Technology, Changzhou 213032, China
jiangf@jsit.edu.cn
2Library and Information Center, Jiangsu Vocational College of Information Technology, Wuxi 214153, China
tao_li_@126.com
Submitted On: January 25, 2022; Accepted On: April 5, 2022
Abstract
Considering the problem of non-destructive testing and quantitative evaluation of metal materials, an electromagnetic method for visual and quantitative evaluation of surface defects on metal pipe is proposed in this paper. The dual-excitation probe with the combination of arc-shaped and rectangular coils is constructed. The eddy current magnetic field on the outer cylindrical surface of metal pipe is calculated and analyzed by COMSOL Multiphysics finite-element software, and then the influences of crack location and geometric parameters on three-dimensional magnetic field characteristics are studied. The results show that the cloud contours constructed by the magnetic induction intensity norm can accurately evaluate the information such as the location, size, depth, and orientation of the surface crack. In addition, the cloud contours constructed separately by the magnetic induction intensity in three directions can be used for auxiliary judgment to further determine the relevant important parameters of the surface crack to be tested.
Keywords: Eddy current magnetic field, pipe, cloud contour of magnetic induction intensity.
I. INTRODUCTION
With the development of modern industrial technology, metals play an important role in various fields, and people’s daily life has been inseparable from a variety of metals. Due to long-term use or aging of the equipment, the metal surface is often damaged and broken, which seriously affects the performance of the equipment, and may cause dangerous goods leakage, explosion, and other serious safety accidents [1–3]. Therefore, it is important to carry out a comprehensive inspection of metal products to ensure their integrity. Non-destructive testing (NDT) technology can obtain the surface condition of materials by processing and analyzing the changes caused by material physical characteristics. Eddy current testing (ECT) is the most popular and mature testing method in online testing [4–7]. Current research mainly focuses on theoretical model and application development [8–10]. It is used to detect defects and check the condition of samples, such as surface cracks, sub-surface cracks, and degeneration-related defects of samples. Of course, ECT itself has great limitations, such as many interference factors, large lift-off effect [11], etc. It is difficult to judge the type and shape of defects and carry out equivalent analysis of defects. In addition, eddy current technology has traditionally relied on changes in the impedance of the pickup coil. In order to detect deep defects in conductive materials, it is necessary to reduce the current frequency to obtain sufficient penetration depth. Because the sensitivity of the detection coil is proportional to the current frequency, eddy current technology is not suitable for the detection of deep buried defects. Therefore, it is advantageous to measure the magnetic field directly, rather than the change rate of the magnetic field [12, 13]. With the development of ECT technology, it is urgent to explore the response analysis of defects to magnetic field signals and extract more useful characteristic information to establish the quantitative relationship between the crack geometry and the surrounding magnetic field [14–16]. Therefore, research on magnetic field detection, analysis methods, and extraction of more characteristic quantities are the trend of improving detection accuracy for ECT development.
In order to solve the shortcomings of ECT, improve the testing ability and accuracy; the NDT of cracks in pipe surface is studied in this paper by using three-dimensional induction eddy current field measurement. COMSOL simulation software is used to obtain the magnetic induction intensity of the outer surface of the pipeline under various conditions, to build the magnetic induction intensity cloud contour. The defect parameter information is extracted from the image to realize the visualization of the defect and improve the accurate evaluation of the pipe.
II. PRINCIPLE OF DETECTION
According to the principle of electromagnetic induction, an excitation coil with alternating current is close to the pipe, and then an induced current will be generated on the surface of the pipe, which is called induced eddy current. The magnitude of the induced eddy current is related to the excitation current parameters and is also related to the state of the pipe, such as the physical characteristics and surface quality of the pipe. In the case of a crack on the surface of the pipe, as shown in Figure 1, the originally evenly distributed current is broken by the crack, and the induced current will change the original path and choose a new path to pass through. As shown in Figure 1 (b), when the eddy current is perpendicular to the crack, the eddy current is disturbed by the defect to the maximum. However, when the eddy current is parallel to the crack, the disturbance caused by the defect to the eddy current is minimal, which can be obtained from Figure 1 (c). At the same time, the change of the direction and size of eddy current will cause the change of the space magnetic field around it, that is, the change of eddy current field. Therefore, the variation of eddy current inside the pipe can be inferred by measuring the variation of eddy current field around the pipe, and then the condition of the surface the pipe can beevaluated.
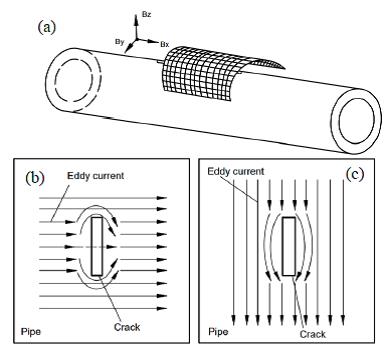
Figure 1: Schematic diagram of pipe crack detection.
The magnetic field at any position outside the pipe is actually equal to the vector sum of the source field generated by the excitation current and the eddy current field generated by the induced current.
| (1) |
where
III. RESULTS AND ANALYSIS
A. Establishment of 3D model
The model which is composed of two excitation coils and pipe is established by COMSOL software, as shown in Figure 2. The outer coil is two arcs with the same center as the pipe, and the shape of the inner coil is a rectangle. The upper and lower arc radii of arc-shaped coil are 24 and 35 mm, respectively, with a width of 40 mm and a thickness of 1 mm. The rectangular coil is 38-mm long, 30-mm wide, 17-mm high, and 1-mm thick. The inner surface of the arc-shaped coil fits exactly with the outer surface of the rectangular coil. The inner and outer radii of metal pipe are 10 and 15 mm, respectively. The number of turns for the two coils is 200, and the conductivity of the coil is 6 10 S/m, the cross-sectional area is m, the excitation current is 10 A, and the frequency is 200 Hz. The pipe material is aluminum, with a relative permeability of 1, a relative permittivity of 1, and a conductivity of 3.774 10 S/m. Ampère’s law automatically applies on all the domains. To ensure the accuracy of electromagnetic field in local small space, a cube air domain with length of 400 mm is established, and appropriate boundary conditions should be applied to the solution domain. Magnetic insulation boundaries are employed to six surfaces of the air domain. The magnetic vector potential of all regions is initially set to 0. To better resolve the induced current in the pipe and the coil, use a fine mesh. The fine mesh processing is generated, and the mesh is divided into 267,440. The MUMPS direct solver is used and the relative tolerance is set to 0.001. Since the actual measurement is the magnetic field of the pipe surface, a cylindrical three-dimensional section concentric with the pipe is established above the pipe surface, and the magnetic induction intensity distribution on the three-dimensional section is calculated and analyzed.

Figure 2: 3D model.

Figure 3: Induced current in the pipe.
According to the three-dimensional simulation model established above, the distribution of the induced current in the pipe is shown in Figure 3. It is the vector sum of the induced current generated under the excitation of two coils together that presents a ring shape around the pipe. Careful observation revealed that there are slight disturbance changes in the induced current near the crack, the arrow of the induced current slightly deviated from the original track, and the eddy current distribution near the crack also changed. Although the change of induced current is not obvious, this slight change will lead to the corresponding change of the external magnetic field around the pipe. The three-dimensional magnetic field distribution of the cylindrical surface near the pipe will be studied and analyzed in detailbelow.
In actual measurement, the magnetic field on the surface of the pipe is collected. Therefore, a cylindrical support plate coaxial with the pipe is designed between the circular coil and the pipe, which is kept in a relatively static state with the coil. A removable slender circuit board is designed between the cylindrical support plate and the coil. The circuit board is mounted on the cylindrical support plate to provide a fixed, stable lift-off from the pipe surface. The magnetic field sensor arrays are uniformly distributed on the circuit board, and magnetic field sensors are arranged on the circuit board in an axis direction. A row of interface circuits are designed on one side of the circuit board to connect the sensor with the external circuit. During measurement, the circuit board will first scan in both directions along the circumference after the probe coil reaches an area and remains stationary. When the circumferential scanning is finished, the circuit board is moved to the next position along the axis to fill the detection area between two adjacent magnetic field sensors. The circuit board is then scanned in both directions along the circumference. Repeat the above steps until the area covered by one position of the probe is completely scanned.

Figure 4: The cloud contour of the magnetic induction intensity with cracks at different orientations: (a) crack-free, (b) transverse crack, (c) longitudinal crack, and (d) 45 oblique crack.
B. Evaluation of pipe cracks based on cloud contour of induced eddy current field
(1) Cracks at different orientations on the surface of the pipe.
Under the double coil excitation, the magnetic induction intensity norm on the three-dimensional cylindrical surface above the pipe is calculated by COMSOL as shown in Figure 4. Figures 4 (a)-(d), respectively, represent the cloud contour formed by the magnetic induction intensity norm on the cylindrical surface with no crack, transverse crack, longitudinal crack, and 45 oblique crack on the pipe surface. The longitudinal crack size is 12 1 1 mm, and the transverse crack size is 40 central angle, 1-mm width and 1-mm depth. Different colors of cloud contours represent different magnetic induction intensities. By measuring the distribution of magnetic induction intensity in this region, the cloud contours of magnetic induction intensity norm and three-dimensional component magnetic induction intensity are obtained, and the related information of pipe crack is analyzed from the image. In this way, the visualization of cracks arerealized.
Under the action of double-coil excitation, there is no obvious “shadow” in the cloud contour of magnetic induction intensity norm in the case of no crack, as shown in Figure 4 (a). The regular magnetic field distribution of the cloud contour is broken due to the crack on the pipe. A very obvious “shadow” will be generated at the corresponding position of the crack, and the “shadow” reflected in the figure is basically consistent with the position, size, and direction of the crack, as shown in Figures 4 (b)–(d). This phenomenon proves that under the co-excitation of double coils, the existence of cracks in pipe can be judged by detecting whether there is “shadow” in the cloud contour of magnetic induction intensity above the pipe, and the crack location and orientation can also be accurately obtained. In addition, regardless of whether the crack is longitudinal or oblique, the coil can be directly placed above the pipe for measurement without rotating or moving the coil to ensure that the induced current is perpendicular to the defect. The “shadow” in the figure is an intuitive representation of the pipe crack, realizing the “visualization” of the crack.

Figure 5: The cloud contour of x-direction magnetic induction intensity with cracks at different orientations: (a) crack-free, (b) transverse crack, (c) longitudinal crack, and (d) 45 oblique crack.

Figure 6: Cloud contour of magnetic induction intensity norm with different crack lengths: (a) 10, (b) 12, (c) 15, and (d) 18 mm.
Figures 5 (a)–(d) show the cloud contours of x-direction magnetic induction intensity caused by cracks at different orientations under double coil excitation. It can be found that the basic law of the cloud contour in x-direction under various crack conditions is similar to that shown in Figure 4, but the value of magnetic induction intensity is weakened. The “shadow” corresponding to the crack exists in the cloud contours shown in Figures 5 (b) and (d), and the degree of the “shadow” decreases compared with Figure 4, which is related to the decrease of magnetic induction intensity in the x-direction. As shown in Figure 5 (c), the cloud contour formed by longitudinal crack in the pipe cannot well show the existence and related information of cracks, and the detection effect is obviously inadequate compared with Figure 4 (c). By analyzing the magnetic induction intensity in y- and z-directions, the detection effect is similar to the magnetic induction intensity in x-direction, which some information of pipe defects can be determined according to the corresponding cloud contour. Therefore, the information provided by the cloud contour independently constructed by the magnetic induction intensity of the three axes is not complete, and the magnetic induction intensity norm with complete information is still needed to accurately analyze pipe defects.
(2) Cracks in different length on the surface of the pipe.
Under the excitation of double coil, the crack length is changed and other conditions remain unchanged. The cloud diagram of magnetic induction intensity norm on the pipe surface is shown in Figure 6, in which Figures 6 (a)–(d) show that the longitudinal crack lengths are 10, 12, 15, and 18 mm, respectively. According to the four groups of magnetic induction intensity norm obtained, the following conclusions can be inferred. (1) The change of surface crack does not change the overall distribution of magnetic induction intensity on the cylindrical surface, and the cloud diagrams shown in Figures 6 (a)–(d) are basically consistent. (2) As the length of the crack on the pipe surface increases, the “shadow” corresponding to the crack also becomes longer, and the magnitude of the change is the same as that of the crack change. (3) Comparing the length units on the right side of the figure, it can be found that the length of the “shadow” in the cloud diagram is actually the length of the pipe crack. Therefore, the length information of the pipe crack and defect can be accurately judged according to the change of the “shadow” length in the cloud diagram. Similarly, the crack width information can also be obtained by the change of “shadow” width in the cloud diagram.
Crack depth is important information worth paying attention to. Under dual-coil excitation, other conditions remain unchanged and only the crack depth is changed. The corresponding cloud diagram of magnetic induction intensity is shown in Figure 7, where Figures 7 (a)–(d) show that the longitudinal crack depths are 1, 2, 3, and 3.5 mm, respectively.
The following conclusions can be drawn from Figure 7. (1) Different from the influence of crack length on magnetic induction intensity, the change of crack depth not only reflects the “shadow” part corresponding to the crack but also has certain influence on the magnetic induction intensity around the crack. With the increase of crack depth, the surrounding magnetic induction intensity decreases obviously. (2) The weakening of the magnetic induction intensity around the crack will bring disadvantages to the crack detection. At this time, the “shadow” appears to be fuzzy, and the boundary with the surrounding area is not obvious. (3) Although the “shadow” corresponding to the crack is not very obvious, the crack depth can still be evaluated according to the change of the “shadow.” With the increase of crack depth, the size of magnetic induction intensity norm within the crack area decreases obviously. The reason why the magnetic induction intensity decreases in this region can still be explained by the principle of eddy current field. As the crack depth increases, the eddy current magnetic field around the pipe increases, resulting in the decrease of total magnetic field. As a result, the phenomena shown in Figures 7 (a)–(d)appear.

Figure 7: Cloud contour of magnetic induction intensity norm with different crack depths: (a) 1, (b) 2, (c) 3, and (d) 3.5 mm.
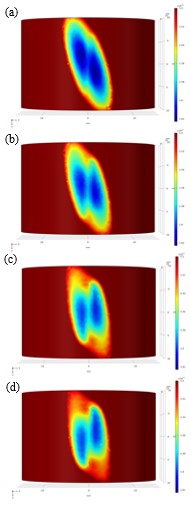
Figure 8: Cloud contour of magnetic induction intensity in y-direction with different crack depths: (a) 1, (b) 2, (c) 3, and (d) 3.5 mm.
As the depth of the crack increases, the “shadow” corresponding to the crack becomes fuzzy, which is unfavorable for the actual detection; so other methods must be used to assist the analysis. Figure 8 is the cloud contour of magnetic induction intensity in y-direction under the action of cracks with different depths. Figures 8 (a)-(d) also show that the longitudinal crack depths are 1, 2, 3, and 3.5 mm, respectively. By analyzing the cloud contour shown in Figure 8, it can be seen that the “shadow” of crack as shown in Figure 7 does not appear in the cloud contour of magnetic induction intensity in the y-direction; so it cannot be mainly used to evaluate cracks. However, as the crack depth increases, its image also changes regularly. The positions of the two “blue areas” in Figure 4 (a) are high on the left and low on the right. Starting from Figure 4 (b), the relative positions of the two “blue areas” change. The deeper the crack, the higher the “blue area” on the right in the cloud contour. As shown in Figure 4 (d), the two “blue areas” have appeared as low on the left and high on the right. In addition, as the crack depth increases, the transverse distance between the two “blue areas” also becomes wider. Therefore, the crack depth can be determined by means of the magnetic induction intensity norm, which can be supplemented by the magnetic induction intensity in the y-direction.
C. Influence of coil excitation mode on detection results
(1) Independent excitation of arc-shaped coil.
Considering that other conditions remain unchanged and only the arc-shaped coil is used, the magnetic induction intensity above the crack is studied through COMSOL calculation, and the cloud contour of magnetic induction intensity is obtained as shown in Figure 9. Figure 9 (a) shows the magnetic induction intensity distribution in the presence of longitudinal cracks on the pipe surface, and Figure 9 (b) shows the magnetic induction intensity distribution in the presence of transverse cracks on the pipe surface. The influences of different coil excitation on detection results are investigated by analyzing different cracks under the action of arc-shaped coilalone.
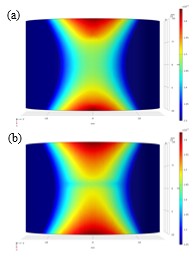
Figure 9: Cloud contour of magnetic induction intensity excited by arc-shaped coil: (a) longitudinal crack; (b) transverse crack.
It can be found that there is no obvious “shadow” corresponding to the crack in the magnetic induction cloud contour under the longitudinal crack, while there is a clear ”shadow” corresponding to the crack in the magnetic induction intensity cloud contour under the transverse crack. At this time, the cloud contour is divided into two symmetrical parts by the transverse crack. As can be seen from the previous introduction, the direction of eddy current generated on the surface of the pipe is the circumferential direction under the excitation of the circular coil. Therefore, it can be concluded that crack-related information can be obtained in the magnetic induction intensity norm as the winding direction of the excitation coil is consistent with the crack length. However, the crack cannot be determined if the direction of crack length and coil winding is perpendicular to each other.
(2) Independent excitation of rectangular coil.
Using only rectangular coil excitation, the cloud contour of magnetic induction intensity norm on the pipe surface is shown in Figure 10, where Figures 10 (a) and (b) are the magnetic induction intensity under the action of longitudinal crack and transverse crack, respectively. It can also be observed that since the rectangular coil generates longitudinal induced current inside the pipe at this time, there is an obvious “shadow” in the magnetic induction intensity cloud contour corresponding to the longitudinal crack, while there is no obvious “shadow” in the magnetic induction intensity cloud contour corresponding to the transverse crack. Combining the magnetic induction intensity generated by the above arc-shaped coil alone, it is further inferred that the information related crack can be obtained from the magnetic induction intensity cloud contour only when the coil excitation direction is consistent with the crack length direction. Therefore, under the co-excitation of the two coils, the crack can be evaluated from the cloud contour of magnetic induction intensity regardless of the direction of the crack. Whether the arc-shaped coil is excited alone or the rectangular coil is excited alone, it cannot have the ability of double coil to accurately obtain defect information.
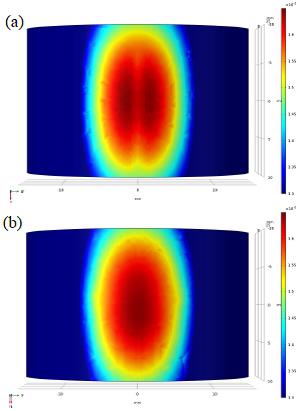
Figure 10: Cloud contour of magnetic induction intensity norm under excitation of rectangular coil: (a) longitudinal crack; (b) transverse crack.
IV. CONCLUSION
In order to obtain more obvious characteristics of defects and improve the accuracy of traditional ECT, a 3D eddy current magnetic field technology is proposed to realize the visual detection and analysis of defects on pipe surface. The results show that two coils with different excitation directions and shapes can be used to detect transverse, longitudinal, and arbitrary cracks. Different from other electromagnetic NDTs that require adjustment of the probe direction in order to obtain specific information about defects, the three-dimensional eddy current magnetic field method is more convenient in operation. By exploring the distribution of magnetic induction intensity on the cylinder near the surface of the pipe, the method can measure all the cracks at one time without adjusting the direction and position of the coil. In addition, the cloud contour of magnetic induction intensity norm collected under different cracks and the cloud contour of three-dimensional magnetic induction intensity can realize the visualization of cracks and further quantitatively evaluate the position, length, and depth of cracks. However, other electromagnetic NDT methods, such as magnetic particle testing and magnetic flux leakage testing, are still difficult to accurately quantify defects at present. In the future, advanced image processing algorithm and image recognition technology will be adopted to realize the rapid inversion of defect depth, area, and location and truly realize the precision, automation, and intelligent NDT of pipe defects.
ACKNOWLEDGMENT
This work was supported by Major Project of Colleges and Universities Natural Science Foundation in Jiangsu Province under Grant 21KJA470003, Changzhou Institute of Technology High-level Talent Research Startup Fund Support under Grant YN21019, Jiangsu Province University Student Innovation Training Program Project under Grant 202111055033Y and Jiangsu University Philosophy and Social Science Foundation Project under Grant 2021SJA0924.
REFERENCES
[1] A. Sophian, G. Y. Tian, D. Taylor, and J. Rudlin, “Electromagnetic and eddy current NDT: a review,” Insight - Non-Destructive Testing and Condition Monitoring, vol. 43, no. 5, pp. 302-306, May 2001.
[2] J. Tian, W. Wang, W. Yan, Z. Jianga, Y. Shanb, and K. Yang, “Cracking due to Cu and Ni segregation in a 17-4 PH stainless steel piston rod,” Engineering Failure Analysis, vol. 65, pp. 57-64, Jul. 2016.
[3] M. Eissa, M. Naguib, and A. Badawi, “PWR control rods position monitoring,” Annals of Nuclear Energy, vol. 81, pp. 106-116, Jul. 2015.
[4] S. Xie, Z. Chen, T. Takagi, and T. Uchimoto, “Quantitative non-destructive evaluation of wall thinning defect in double-layer pipe of nuclear power plants using pulsed ECT method,” NDT & E International, vol. 75, pp. 87-95, Oct. 2015.
[5] B. Helifa, M. Féliachi, I. K. Lefkaier, F. Boubenider, A. Zaoui, and N. Lagraa, “Characterization of surface cracks using Eddy current NDT simulation by 3D-FEM and inversion by neural network,” Applied Computational Electromagnetics Society (ACES) Journal, vol. 31, no. 2, pp. 187-194, Feb. 2016.
[6] J. Xin, N. Lei, L. Udpa, and S. S. Udpa, “Rotating field eddy current probe with bobbin pickup coil for steam generator tubes inspection,” NDT & E International, vol. 54, pp. 45-55, Mar. 2013.
[7] G. Tytk and L. Dziczkowski, “Fast calculation of the filamentary coil impedance using the truncated region eigenfunction expansion method,” Applied Computational Electromagnetics Society (ACES) Journal, vol. 32, no. 12, pp. 1461-1466, Feb. 2018.
[8] T. P. Theodoulidis and J. R. Bowler, “The truncated region eigenfunction expansion method for the solution of boundary value problems in eddy current non-destructive evaluation,” Review of Progress in Quantitative Nondestructive Evaluation, vol. 24A, pp. 403-408, Apr. 2005.
[9] G. Tytko and L. Dziczkowski, “I-cored coil probe located above a conductive plate with a surface hole,” Measurement Science Review, vol. 18, no. 1, pp. 7-12, Feb. 2018.
[10] Y. Yating, G. Kuanhou, L. Bowen, and L. Linfeng, “Semi-analytical method for characterization slit defects in conducting metal by eddy current nondestructive technique,” Sensors and Actuators A: Physical, vol. 301, p. 111739, Jan. 2020.
[11] D. Rifai, A. N. Abdalla, K. Ali, and R. Razali, “Giant magnetoresistance sensors: a review on structures and non-destructive eddy current testing applications,” Sensors, vol. 16, no. 3, pp. 1-30, Mar. 2016.
[12] J. H. Ge, W. Li, G. M. Chen, and X. Yin, “Analysis of signals for inclined crack detection through alternating current field measurement with a U-shaped probe,” Insight - Non-Destructive Testing and Condition Monitoring, vol. 59, no. 3, pp. 121-128, Mar. 2017.
[13] F. Jiang, S. L. Liu, and S. G. Xiao, “Quantitative estimation of rectangular surface crack based on the 2-D modeling of surface magnetic field with long straight rectangular wire,” IEEE Transaction Magnetics, vol. 54, no. 5, pp. 1-12, May 2018.
[14] T. Ozawa, S. Yabukami, J. Totsuka, S. Koyama, J. Hayasaka, N. Wako, and K. I. Arai, “Measurement of internal defects in aluminum using a nano-granular in-gap magnetic sensor,” Journal of Applied Physics, vol. 117, no. 17, pp. 305.1-305.4, May 2015.
[15] L. Yong, Y. Bei, W. Li, H. Jinga, Z. Chen, and D. Li, “Pulse-modulation eddy current probes for imaging of external corrosion in nonmagnetic pipes,” NDT & E International, vol. 88, pp. 51-58, Jun. 2017.
[16] N. O. Romero-Arismendi, J. A. Pérez-Benítez, and E. Ramírez-Pacheco, “Design method for a GMR-based eddy current sensor with optimal sensitivity,” Sensors and Actuators A Physical, vol. 314, p. 112348, Oct. 2020.
BIOGRAPHIES

Feng Jiang was born in 1981. He received the M.Sc. degree from the School of Mechanical Engineering, Jiangsu University, Zhenjiang, China, in 2006 and the Ph.D. degree from Shanghai University, Shanghai, China, in 2019.
He is currently an Associate Professor with the School of Electrical and Information Engineering, Changzhou Institute of Technology, Changzhou, China. His research interests include electromagnetic non-destructive evaluation, sensor techniques, and fault diagnosis.

Tong Xu was born in Guizhou, China. He is currently working toward the B.S. degree with the Changzhou Institute of Technology, Changzhou, China.
His research interests include electromagnetic non-destructive evaluation and multiphysics simulation.
ACES JOURNAL, Vol. 37, No. 3, 363–372.
doi: 10.13052/2022.ACES.J.370314
© 2021 River Publishers


