The Comparison of EMF Monitoring Campaigns in Vicinity of Power Distribution Facilities
Goran S. Nedic, Nikola M. Djuric, and Dragan R. Kljajic
1Public Enterprise Electric Power Industry of Serbia
Novi Sad, 21000, Serbia
goran.nedic@eps.rs
2Faculty of Technical Sciences, University of Novi Sad
Novi Sad, 21000, Serbia
ndjuric@uns.ac.rs, dkljajic@uns.ac.rs
Submitted On: February 12, 2021; Accepted On: November 4, 2021
Abstract
Monitoring of electromagnetic field (EMF) near power distribution facilities, both in the low- and the high-frequency ranges, has become highly demanded in recent years. The reason lies in the accumulated concerns on public health, which is mostly caused by the evolution of electric power and communication infrastructure, in and around the power substations, as well as their closeness to residential areas. In this paper, the initial comparative analysis of the EMF monitoring results of three one-day campaigns, in 2015, 2018 and 2020, performed in the vicinity of the Serbian high-power distribution substation “Novi Sad 7”, is presented. The overall EMF levels in all campaigns comply with the reference levels prescribed by the Serbian legislation, including some new EMF sources which were detected in 2018 and 2020. Likewise, the used continuous monitoring has demonstrated suitability to systematically address EMF fluctuation on daily basis, as well as corresponding concerns on EMF exposure.
Keywords: electromagnetic field, power system, power substation, radiation monitoring, RF signals.
I. INTRODUCTION
Constantly growing number of industrial and residential consumers resulted in a greater demand for electric energy, particularly in recent decade. The first action and an accepted response to such demand is to boost existing power substations, followed by the installation of new ones. Also, the interconnection is accomplished between substations, strengthening the power distribution network, while enabling its remote management.
The power distribution facilities are well known as sources of the low-frequency magnetic fields [1]. However, their remote-control by using radio links, as well as different wireless equipment, promote them as sources of the high-frequency electric field. Consequently, their usual presence in residential and industrial areas has increased the public concerns on adverse health effects, demanding the electromagnetic field (EMF) level monitoring in their vicinity [1].
The worldwide efforts are invested in measurements and simulations of both the low-frequency magnetic and the high-frequency electric fields. In a number of recent studies, measurements were oriented towards the short-term methods and estimation of the exposure. Results are used in a computational prediction of the low-frequency magnetic field strength within the power substation [2] or for the high-frequency electric field investigation produced by the cellular network base stations over sensitive locations [3]. The obtained results were mandatory compared with the proposed reference levels [4].
Additionally, the short-term measurements of magnetic and electric fields were conducted inside the power substation in order to determine EMF distribution [5], as well as indoor and outdoor substation evaluation [6–8], elaborating safety levels of the human exposure to those fields. Also, the measurements of magnetic field inside the substations of various voltage levels were presented, as well as measurements related to near feeder lines, such as the overhead power lines and underground cables [9].
Similarly, wide range of the magnetic field measurements were performed in surrounding areas of the power substations in [10]. Consequently, occupational EMF exposure were also in focus [11], particularly during working tasks within the power substations, such as switching and transforming 110 kV and 20 kV, analyzing whether the occupational reference levels were exceeded [4].
A common attribute in the mentioned studies is that measurements were short-term oriented, no longer than a few minutes. Unfortunately, in utmost cases, such approach cannot provide a full insight in EMFs fluctuation and their long-term behavior. In order to provide a comprehensive insight, the modern long-term EMF monitoring systems have been developed and utilized [12, 13]. They are intended to perform continuous EMF monitoring in numerous sensitive zones, such as schools, kindergartens, hospitals and other public institutions [13].
In this study, the approach of broadband continuous EMF monitoring was used. It is implemented in the Serbian Electromagnetic Field Monitoring Network – SEMONT [14], counting the contribution of all active EMF sources in the frequency range of interest. Furthermore, such long-term monitoring is followed by continuous exposure assessment, using SEMONT boundary exposure assessment approach [15, 16].
This paper presents a comparative analysis of measurement results of three different one-day EMF monitoring campaigns, performed in 2015, 2018 and 2020, in the vicinity of the high-power distribution substation “Novi Sad 7”. Those campaigns are first systematic monitoring campaigns in the Serbian power distribution system.
This paper is established on Serbian national legislation, where appropriate field reference levels have been prescribed [17]. The reference levels ensure the protection of people against all established health hazards when they are exposed to EMFs. In that sense, this paper is intended to only check compliance with the prescribed reference limits and has no intention of further investigation on basic effects of EMF interaction with human tissues.
II. SUBSTATION EQUIPMENT
The distribution substation “Novi Sad 7”, with nominal rates of 110/35/20 kV, is a high-power outdoor air-insulated electric power substation. With outer dimensions of 85 m by 85 m, it is situated in a residential area of the Serbian city of Novi Sad, at the corner of Heroja Pinkija and Ohridska streets, as shown in Figure 1.
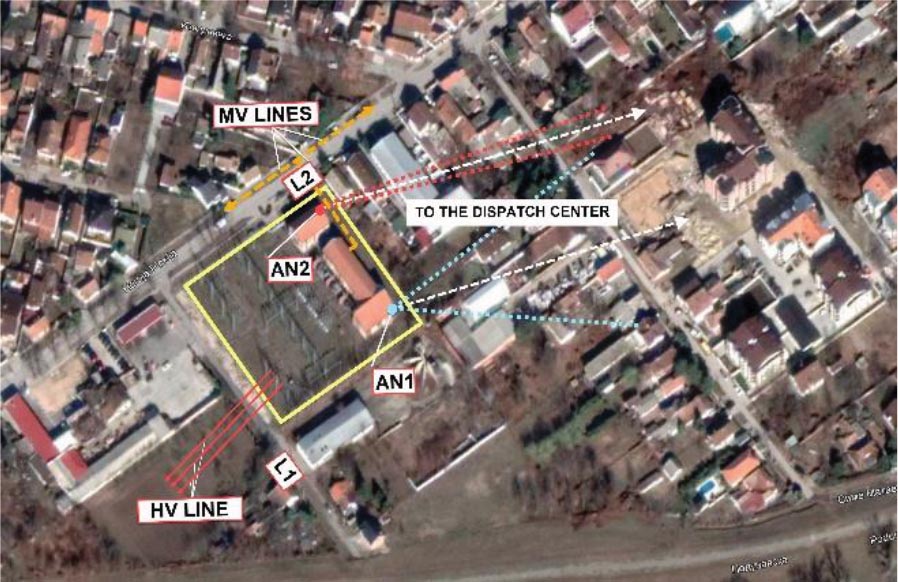
Figure 1: Position of the substation “Novi Sad 7”.
The substation is equipped for remote control and supervision of power distribution and its other processes. The control is done via dedicated radio links, from dispatch center of “EPS Distribucija”, which is the national electricity Distribution System Operator (DSO) [18].
A. Installed high-frequency equipment
Regarding the sources of the high-frequency electric field, the communication between the substation technicians and dispatchers is realized via a narrowband radio link – radio #1, described in Table 1.
Table 1: Technical characteristics of radios
| - | Radio #1 (Narrowband) | Radio #2 (Broadband) |
|---|---|---|
| Frequency range | 438 – 470 MHz | 5.725 – 5.850 GHz |
| Radiated power | 25.35 W | 31.52 W |
| Directional Antenna, Elevation/ Azimuth | No | Yes, |
| Position/Height | AN1/11 m | AN2/12 m |
Furthermore, the broadband radio link, named radio #2, is intended for the control and supervision of the following substation processes: SCADA (Supervisory Control and Data Acquisition) application, then the continuous video surveillance and facility access control, as well as the internal IP telephony system.
The antenna systems for the narrowband radio are installed at the AN1 place, while for the broadband radio at the AN2, as depicted in Figure 1, avoiding the existing obstacles in the line of sight between the antenna and dispatch center. The main beam of directed antenna from radio link #2 (dashed white lines) is oriented towards the DSO dispatch center.
It should be stated that additional narrow-band radio link on AN1 site, with directional antenna (dashed white lines), was used for SCADA in 2015 [19], while during 2018 it was used as the redundant one [20]. In the 2020 campaign, this radio link was out of order. Considering antenna radiation patterns, the half-power beam width of directional antennas is shown in Figure 1 (dotted red and blue lines), while the radiation pattern of the omnidirectional antenna (radio #1), positioned on AN1, is omitted.
B. Installed low-frequency equipment
The substation high-voltage (HV) and medium-voltage (MV) electric power equipment is a dominant source of the low-frequency magnetic field. These includes the three-phase HV (110 kV) overhead line, which enter the substation from the south side, shown by red lines in Figure 1, while in the central part of the substation, there are 110 kV circuit breakers, lighting protection and bus bar systems. Two high-power transformers have nominal voltage rates of 110/20 kV (nominal power of 31.5 MVA), whereas the third one has a nominal rate of 110/35 kV (with the nominal power of 20 MVA).
Also, the MV compartments with MV bus bars and circuit breakers are located inside the substation building. There are twenty-one MV 20 kV lines, from which eighteen were present in the 2015 monitoring campaign, and three MV 35 kV lines connected to the substation on the north side, as depicted by dashed orange lines in Figure 1. All of them are installed as underground cables.
The MV 35 kV lines are used for the interconnection with neighboring 35/10 kV power substations, while MV 20 kV lines supply consumers with electricity via 20/0.4 kV distribution substations.
III. MONITORING CAMPAIGNS
The initial one-day EMF monitoring campaign was performed in 2015, followed by additional one-day campaigns in 2018 and 2020, shown in Table 2.
The opening step of each campaign was the visual inspection of the substation surroundings in order to discover the present EMF sources – antenna systems of radio communication links and mobile telephony base station sites for the high-frequency electric field, as well as overhead power lines and power transformers for the low-frequency magnetic field.
During visual inspection in 2015, the two substation locations, labeled as L1 and L2 in Figure 1, were identified as locations with potentially increased field levels.
Location L1 presents an area on the south of the substation, in Ohridska street, whose driveway is also a pedestrian pathway, passing below the HV power line, as shown in Figure 2a.
This location was selected considering the fact that a few residential houses, parking lots and business buildings are present in the vicinity of HV power lines. Therefore, there is a significant probability that residents could be exposed to the EMF radiation, passing beneath those lines. Besides, in line of sight on L1 location, the antennas of AN1 site are visible, where the distance between L1 and AN1 is about 80 m.

Figure 2: Monitoring locations near the substation “Novi Sad 7”.
Location L2 is situated in the public access area, on the north side of the substation facility, on the frequently used sidewalk of Heroj Pinki street, as shown in Figure 2b. The L2 is close to the residential houses, as well as to the antenna AN2, which is a dominant source of the high-frequency electric field, positioned at a distance of about 15 m from L2. Moreover, L2 location is above the intersected underground MV power line corridors.
Table 2: Details of one-day EMF monitoring campaigns
| Year | Date | Time | Label |
|---|---|---|---|
| 2015 | 06/15/2015 | 9:00 – 13:00 | 2015 |
| 2018 | 07/24/2018 | 9:00 – 13:00 | 2018 |
| 2020 | 05/22/2020 | 9:00 – 13:00 | May_r 2020 |
| 2020 | 05/29/2020 | 9:00 – 13:00 | May 2020 |
| 2020 | 09/17/2020 | 9:00 – 13:00 | Sep 2020 |
Both locations are of high importance, since they are frequently passed by local residents, as well as by employees of local companies.
In 2018 and 2020 campaigns, the visual inspections were repeated, observing the presence of some new the low- and the high-frequency sources in and around the substation, as well in L1-L2 vicinity.
A. The high-frequency campaign
During the first visual inspection in 2015, two sites with antennas were detected, labeled as AN1 and AN2. Substation internal radio systems appeared to be dominant source of the high-frequency field [19, 20].
Since no changes were detected in 2020 campaign, it was decided to perform the high-frequency monitoring only at location L2. Insignificant difference between the high-frequency electric field strengths over locations L1 and L2, in 2015 and 2018 campaigns, was additional reason for such decision [19–21].
During the 2015 campaign, only at location L2, the appropriate spectral components of the internal DSO radio communication links were detected [19]. However, the spectral component of the broadband radio #2 on L1 location was not noticed, since that location was influenced only by low-power side-lobes of the directed antenna [19], while it has a considerable distance of 115 m from AN2.
B. The low-frequency campaign
Regarding the low-frequency part, besides one HV line and three HV power transformers, there was no presence of newly installed low-frequency sources in 2020. Hence, it was decided to conduct the new measurements only at location L1, which is in vicinity of the HV power line [16]. There was almost certain presence of people, since L1 site has only one traffic lane and all vehicles/pedestrians have to pass through that lane.
Another reason was that magnetic field attenuation from underground MV cables, present on location L2, was higher than field attenuation from HV power lines. It turned out that L1 has higher field levels, thus it is better suited for population EMF exposure assessment.
IV. PROCEDURE AND EQUIPMENT
The same measuring procedure was used in all three monitoring campaigns. The low-frequency magnetic and high-frequency electric field monitoring were conducted over L1 and L2, applying the broadband monitoring approach and accompanying frequency selective measurement. The broadband monitoring was done according to the SEMONT measuring procedure [14, 15], followed by the frequency spectrum analysis [22].
Regarding monitoring campaigns, all measurements were conducted in the hot-spot position of the measuring network [14, 15], at L1 for the low-frequency and at L2 for the high-frequency field.
Monitoring started at 9:00 A.M. and lasted for four hours, as presented in Table 2. Such monitoring period was selected regarding assumption that maximum daily activities of the general population and substation’s employees occur during that period of the day, causing an increase of usual telecommunication traffic and electric power consumption.
A. Measuring equipment
The high-frequency broadband monitoring was performed using Narda NBM-550 measurement equipment, covering the frequency range of 100 kHz to 6 GHz [19] and using sampling rate of 6 minutes, as recommended in [23]. The frequency selective analysis was performed using Narda SRM 3006 measurement equipment, covering the frequency range from 420 MHz to 6 GHz [19].
Observing the low-frequency magnetic field, Narda EFA 300 instrument, with the magnetic field probe, was used, covering the frequency range from 5 Hz to 32 kHz [16] and employing the sampling rate of 6 minutes [23]. This equipment was used for field measurements, as well as for its spectral analysis.
V. MEASUREMENT RESULTS
Results of the broadband continuous EMF monitoring and the frequency selective analysis, in the substation vicinity, are presented in this chapter.
A. The broadband EMF monitoring approach
The broadband monitoring approach is able to provide information on cumulative EMF level, which originates from all active sources on location, in the observed frequency range. Unfortunately, the broadband approach cannot provide field level per each frequency, nor the individual contribution of specific EMF sources.
A.1. The high-frequency electric field monitoring
Regarding the high-frequency electric field strength monitoring, at location L2, the comparative overview of obtained average values in 2015, 2018 and 2020 is depicted in Figure 3.
Once more, it should be pointed out that those campaigns are one-day campaigns, as described in Table 2.
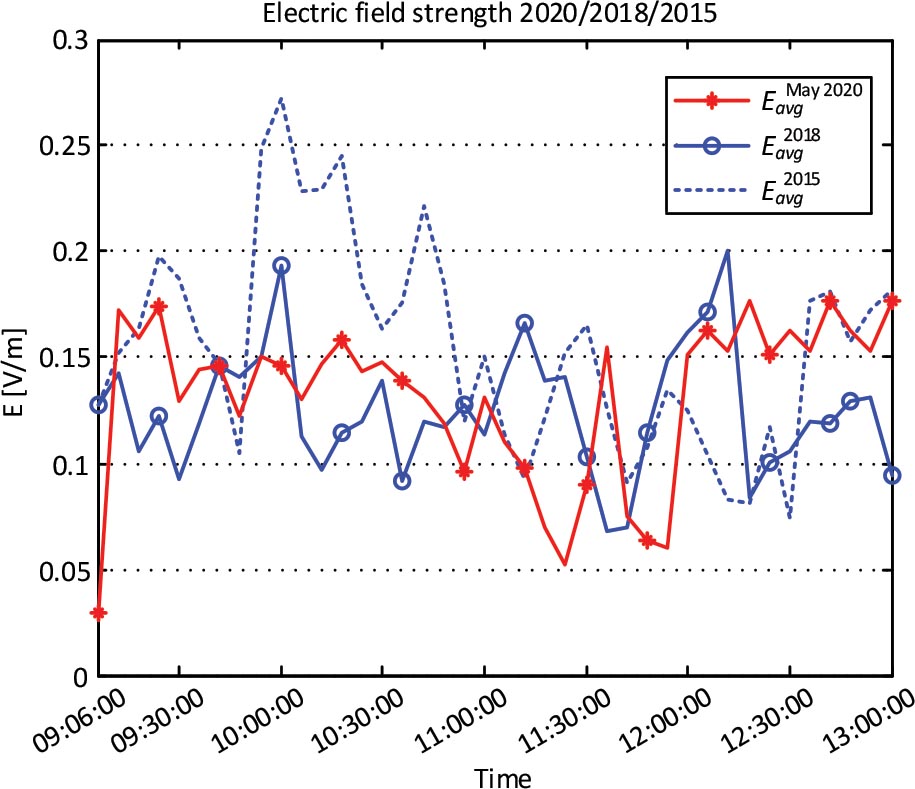
Figure 3: Comparative view of L2 location monitoring.
Even though there was slight fluctuation, the presented high-frequency electric field strengths were significantly below the minimal reference level of 11 V/m, prescribed by legislation of the Republic of Serbia [17], for the NBM-550 field probe’s frequency range.
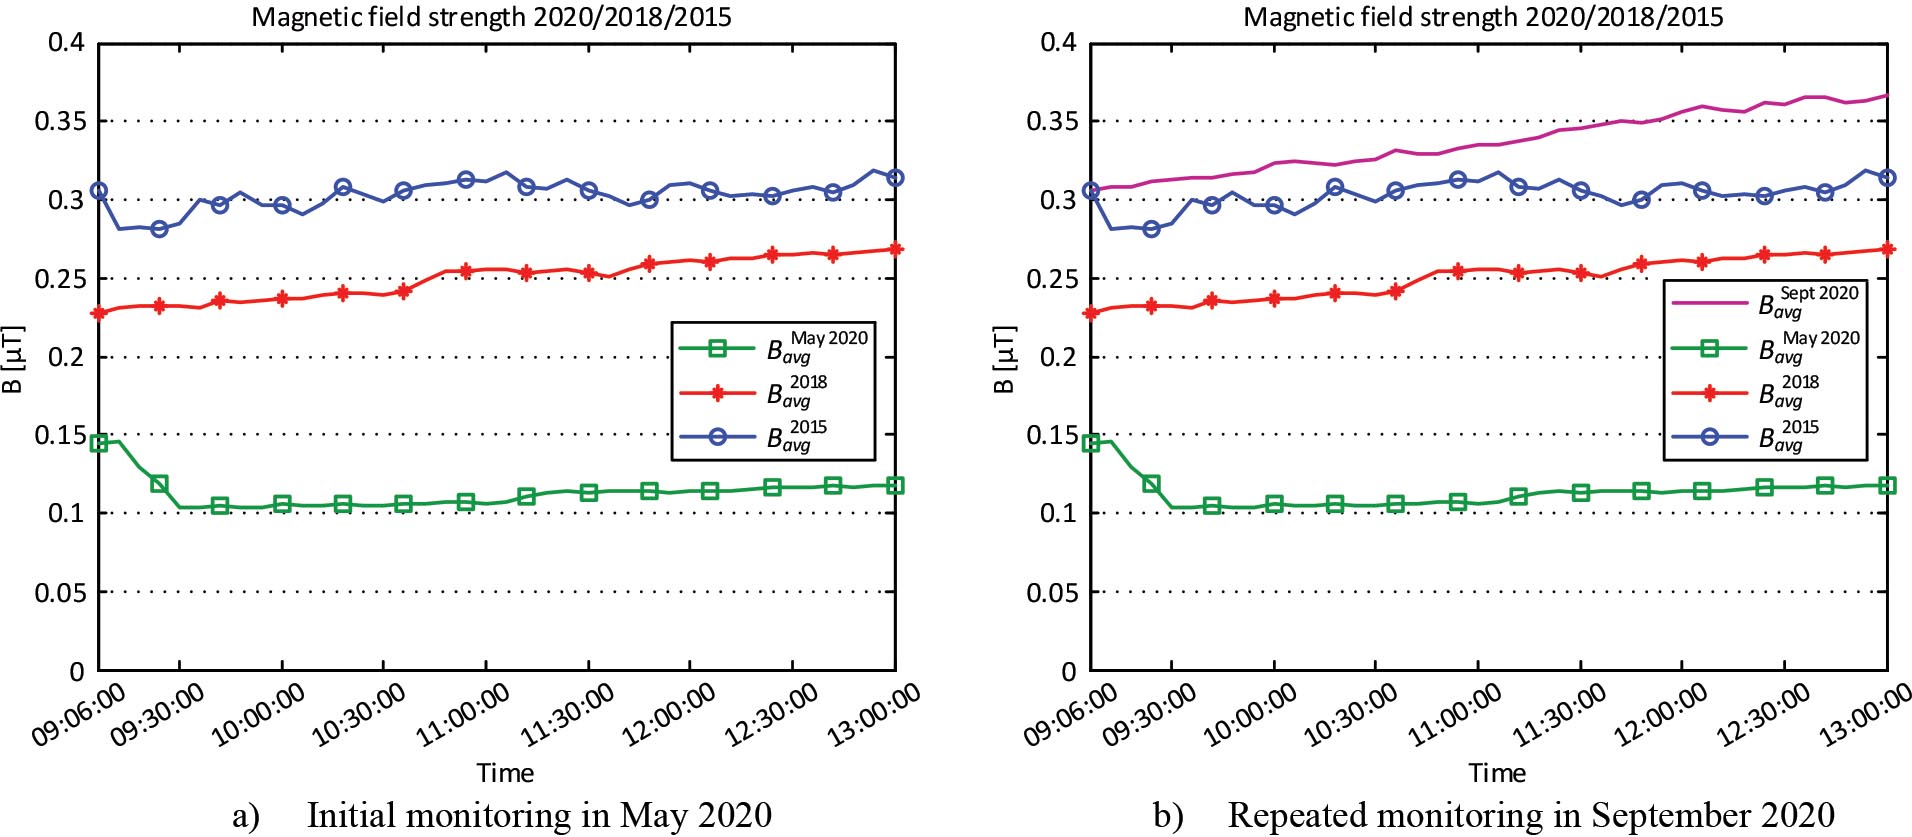
Figure 4: Comparative view on the low-frequency magnetic field continuous monitoring.
Average field strength values in 2018 and 2020 were lower than 0.2 V/m, while in 2015 they ranged up to 0.27 V/m. This could be explained by the fact that one of the dominant sources, the narrowband radio intended for the SCADA system [19], was in a full operational mode in 2015, while in 2018 it was put by DSO to hot stand-by mode. That was done because the SCADA traffic needed to be diverted to the radio #2 link in order to accommodate more efficient management of the processes in the substation, by providing faster links with higher throughputs. In a stand-by mode, the inspection of radio-communication was performed at least few times a day, increasing the high-frequency EMF level in substation vicinity. In the year 2020, this radio was put out of order.
A.2. The low-frequency magnetic field monitoring
A comparative overview of the average values of the L1 low-frequency magnetic field strength, acquired during 2015, 2018 and 2020 campaigns, is shown inFigure 4a.
An increase could be noticed in field strength levels approaching 13:00 P.M. It is the period of the day when electric energy consumption regularly grows. However, observing the campaigns, the maximum average value was around 0.32 T, which was about eight times lower than the maximum one, allowed by reference level of 2.5 T, prescribed by the Republic of Serbia national legislation [17].
The obtained results demonstrated that the average magnetic field strength values were around 0.25 T in 2018, slightly lower than those from 2015. However, the average field strength values from 2020, close to 0.1 T, were noticeably lower than in previous campaigns.
Unfortunately, while the original May 2020 measurement campaign was in progress, the DSO informed the public on the malfunction of the city distribution system. They needed to make certain reconfiguration and reconstruction in core distribution network, changing the power loads between the HV power substations. As a result, some of the city consumers were supplied from the neighboring substations instead of “Novi Sad 7”. Therefore, its current intensity was decreased, compared with regular day – May_r 2020, as presented inTable 3a.
Table 3: The HV power line current intensity
| Campaign | I (A) | I (A) | I (A) | Campaign | I (A) | I (A) | I (A) |
| Sept 2020 | 157.20 | 190.70 | 175.25 | ||||
| May 2020 | 55.00 | 80.10 | 61.96 | May 2020 | 55.00 | 80.10 | 61.96 |
| May_r 2020 (regular day) | 148.20 | 171.00 | 162.20 | May_r 2020 (regular day) | 148.20 | 171.00 | 162.20 |
| 2018 | 123.81 | 148.28 | 139.78 | 2018 | 123.81 | 148.28 | 139.78 |
| 2015 | 137.14 | 165.57 | 155.61 | 2015 | 137.14 | 165.57 | 155.61 |
| a) Current intensity in May 2020 | b) Current intensity in September 2020 |
The current intensity of the HV power line, as a very important parameter for the management of the substation, for the entire monitoring period of all campaigns, was registered by the internal SCADA system [18] and at the end of each campaign was provided to the research team by DSO. The simple statistical analysis of those data is offered in Table 3.
The reduction of the current intensity for sure would affect the magnetic field strength, as it is directly proportional to the current intensity [4]. Since the state of the distribution system was not regular, it was decided to finish the ongoing May 2020 campaign and to perform an additional monitoring of the magnetic field after the establishment of the system’s steady statecondition.
Comparison of the averaged magnetic field strength values, including the repeated monitoring campaign in September 2020, is provided in Figure 4b. The maximum average value for magnetic field was 0.37 T, which was also the highest measured value in all campaigns. Additionally, the average magnetic field strengths from September 2020 were higher than in previous campaigns, as it is noticeable in Figure 4b. However, it was expected, having in mind increased number of industrial and residential consumers with a greater demand for electric energy.
The significant differences in current intensity were found for the incident May 2020 monitoring, where current consumption was lowered more than twice, comparing it with 2015 and 2108 campaigns. However, regarding regular day in May – May_r 2020, the substation current was on the expected level, as shown inTable 3.
Finally, the consumption was the highest in all campaigns during September 2020, as presented in Table 3b. That can be explained with the increased number of connections to the power supply network for newly built residential objects, malls and enterprise buildings of Novi Sad, in the nearby area of the power substations.
Such conclusion is supported by energy consumption diagrams of the high-power substation “Novi Sad 7” [18], presented in Figure 5. We can clearly notice the difference in the shape of the curve for May 2020 in period of the power system failure, which occurs between 07:00 A.M. and 17:00 P.M., compared to other curves.
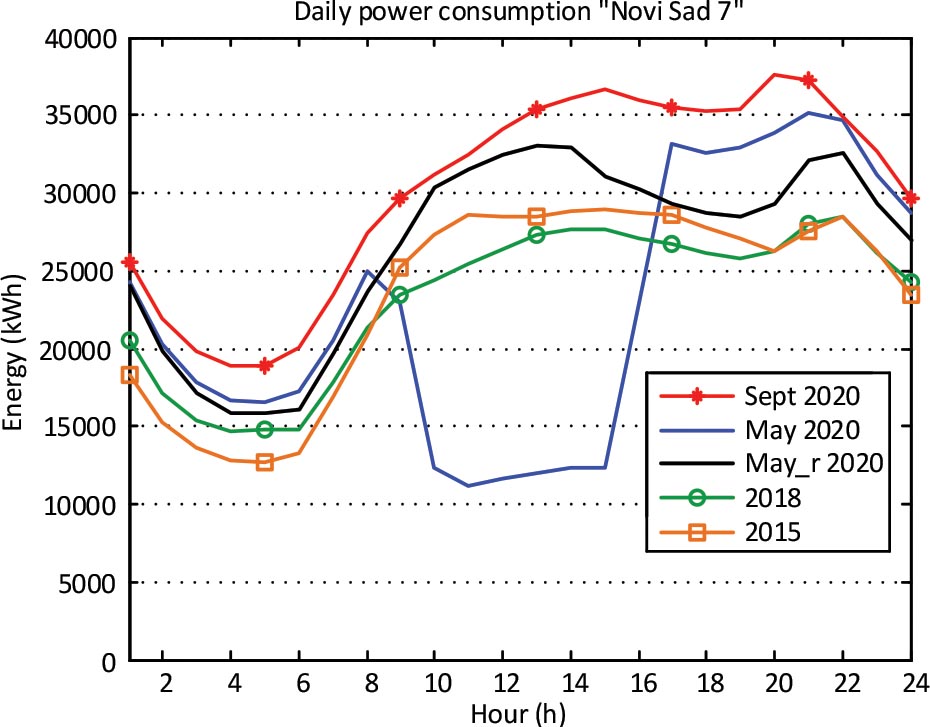
Figure 5: Energy consumption of substation “Novi Sad 7”.
According to the DSO, the overall energy consumption of the substation “Novi Sad 7” up to the year 2020, compared to 2015, increased from about 2.8% to about 3.5%, in the region under the DSO dispatch center [24].
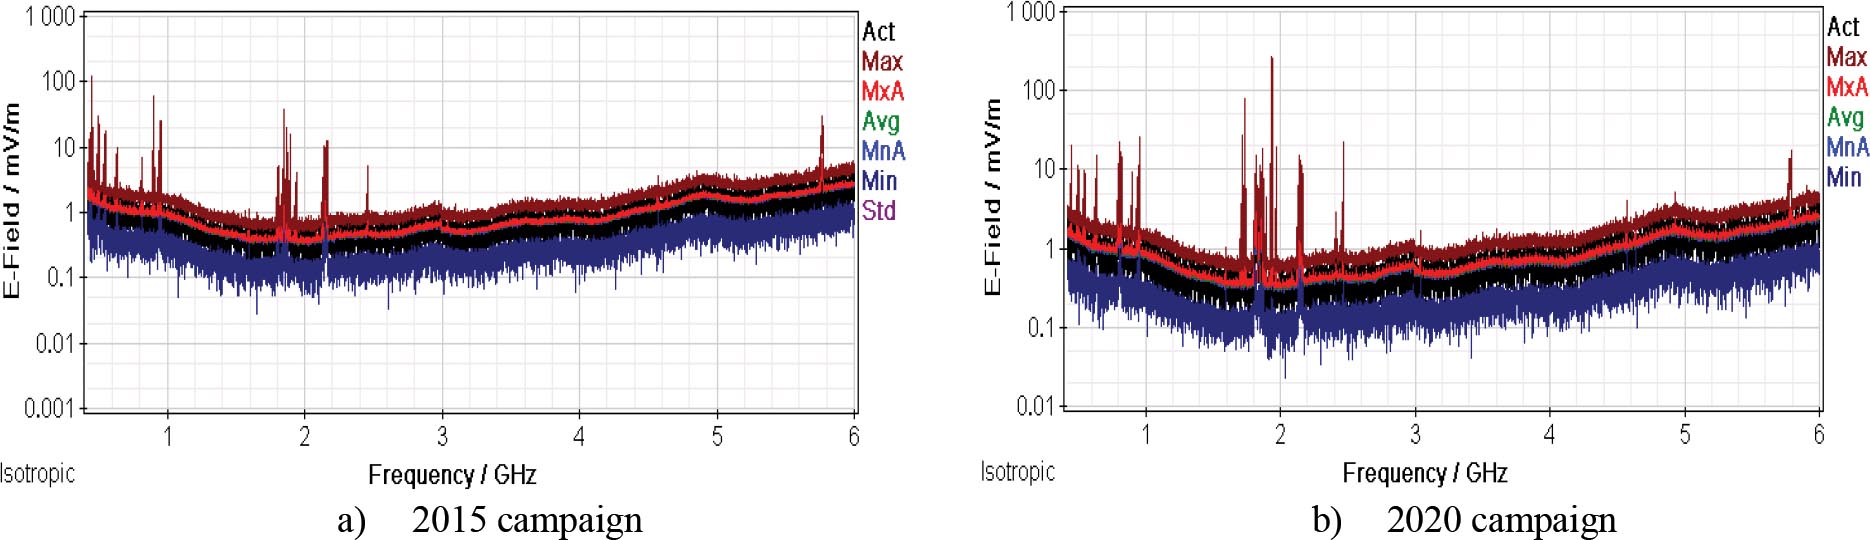
Figure 6: The high-frequency spectrum at location L2 per campaigns.
B. Frequency selective measurement
The frequency selective analysis, as an important part of the monitoring process, was intended for the spectral evaluation of monitored locations, providing valuable information on neighboring EMF sources.
B.1. The high-frequency spectrum
The analyses of the high-frequency spectrum were performed at position of L2 hot-spot. This spectral measurement was performed once, assuming that the present EMF sources regularly emitted at detected frequencies. The analyses of spectral content were made for all three campaigns, and the results for 2015 and 2020 campaigns are displayed in Figure 6.
Spectral components were detected in several sub-bands, which are produced by well-known telecommunications services: the TV broadcasting, GSM 900, GSM 1800 and UMTS 2100. The highest strength of the electric field in 2020 campaign was observed in sub-bands near 1800 MHz, while in the 2015 campaign that was the case with UHF sub-band near 450 MHz.
The decreased activity of the UHF sub-band sources (near 450 MHz) can be noticed in 2020, since, according to national “Decree on determining the allocation plan of radio frequency bands” [25], this sub-band is intended for DSO internal communication systems, such as the voice communication system presented inTable 1.
Furthermore, more RF carriers were logged in 2020, in the sub-band intended for the emission of the digital broadcasting DBV-T2 signal. This telecommunications service was not in full operational usage in the Republic of Serbia during the 2015 campaign [19].
Similarly, the increased activity in the sub-band near 800 MHz was present in 2020, which is intended for LTE service, a technology that was extensively deployed during 2018 by the Serbian mobile telephony operators [20]. Also, the GSM 900, GSM 1800 and UMTS 2100 sub-bands had more radio-frequency carriers in 2020 than in the 2015 campaign, due to the increased number of residential subscribers and increased traffic needs.
Furthermore, spectral components in 2.4 GHz sub-band could be observed in both campaigns, since it was likely that local residents extensively used Wi-Fi equipment. Finally, the origin of the spectral components in 5.8 GHz sub-band was an internal DSO point-to-point broadband radio link, described in Table 1.
B.2. The low-frequency spectrum
The results of the low-frequency selective analysis, during the 2020 campaign, in the hot-spot of location L1, are presented in Figure 7.
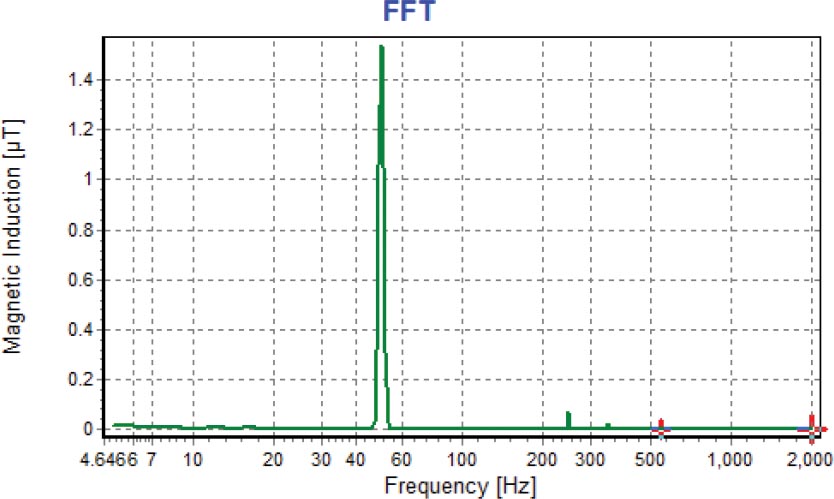
Figure 7: The low-frequency spectrum at location L1.
In the low-frequency spectrum, there was no difference between three campaigns [16], since no new low-frequency magnetic field sources were detected.
Regarding this spectral content, the highest strength of the magnetic field was at the dominant spectral component of 50 Hz, as expected, while the last detected harmonic was at 450 Hz. The field strength of higher components was below the threshold of Narda EFA 300 analyzer and thus they could be neglected.
VI. EXPOSURE ASSESSMENT ANALYSIS
The exposure assessment was carried out by applying the SEMONT approach, based on the calculation of daily boundaries of Global Exposure Ratio (GER), thus determining the range where actual exposure lied [15].
The assessment of exposure, regarding the high-frequency electric field, was performed using the following equations [15]:
| (1) |
The is the average measured value of the electric field strength, while and are the minimum and maximum reference levels prescribed by the Serbian legislation for the general population [17], in the observed frequency range.
The assessment of lower and upper exposure boundaries, for the low-frequency magnetic field, was calculated using the following equations [16]:
| (2) |
where is average measured strength of magnetic field, while and are the minimum and maximum Serbian prescribed reference levels [17], in the observed frequency range.
The exposure boundaries were calculated continuously, day by day, illustrating the campaigns’ exposure range, while the real exposure was located between those boundaries [15].
A. The high-frequency electric field GER analysis
The high-frequency GER boundaries for location L2 were calculated for the frequency range of 100 kHz–6 GHz, and are presented in Figure 8.
There is a visible decrease of the upper GER boundary in 2018 campaign, compared to the data from 2015, which occur due to the change in the operational regime of radio #2, described in Table 1 [20]. This source was turned into a redundant link, intended only for the DSO SCADA application.
Common to all campaigns is that the maximal activity of communication services occurred near 10:00 A.M., whereas an additional slight increase of the activities can be noticed after 11:30 A.M.
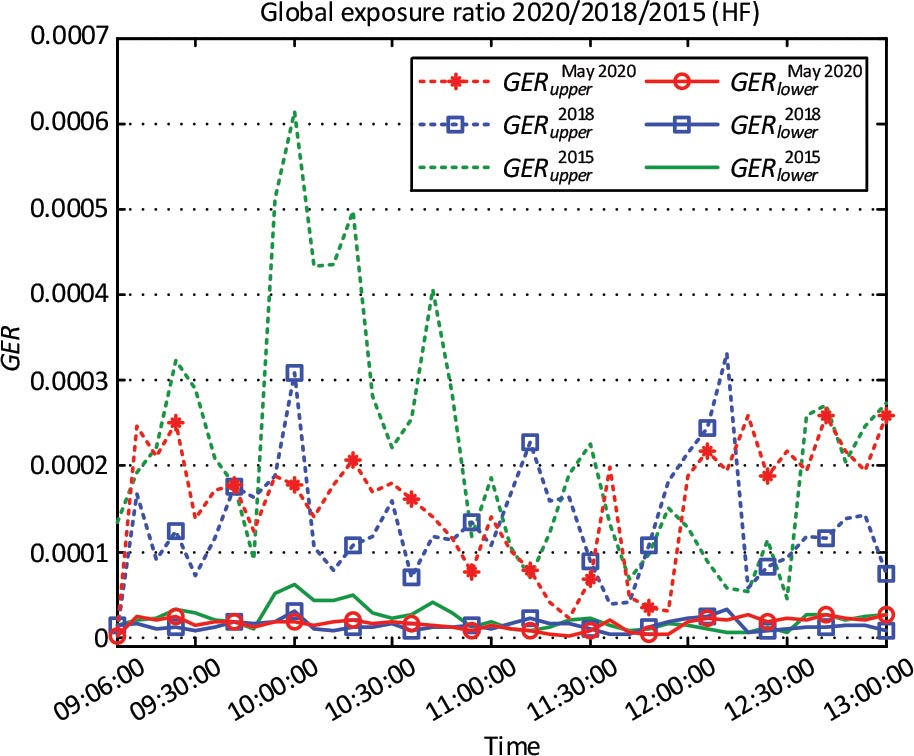
Figure 8: The high-frequency GER boundaries.
Statistical analysis of the high-frequency GER values for all three monitoring campaigns is presented in Table 4.
Table 4: Statistical analysis of the high-frequency GER
| Frequency range (100 kHz–6 GHz) | Min | Max | Avg | |
|---|---|---|---|---|
| 2020 | ||||
| 2018 | ||||
| 2015 | ||||
| 2020 | ||||
| 2018 | ||||
| 2015 |
In 2020, the maximum values of GER boundaries were and , which were considerably below the maximum allowed limit of , prescribed by Serbian legislation [17].
Likewise, comparing the GER boundary values, it can be observed that the average value of boundary of in 2018 was almost two times lower than obtained in 2015. Also, in the 2020 campaign, this value was , a slightly higher than in the 2018 campaign.
However, the GER data confirms that the high-frequency electric field exposure at L2 location is very low.
B. The low-frequency magnetic field GER analysis
Measurements of the low-frequency magnetic field, at location L1, were conducted in the frequency range of 5 Hz to 32 kHz. Regarding the exposure assessment, the comparative overview of the low-frequency GER boundaries is provided in Figure 9.
Analyzing this figure, the trend of the moderate increase of the upper GER boundaries can be noticed, as we approach the end of all campaigns. That could be explained by the increased consumption of electric power, at that period of the day, as shown in Figure 5 [18].
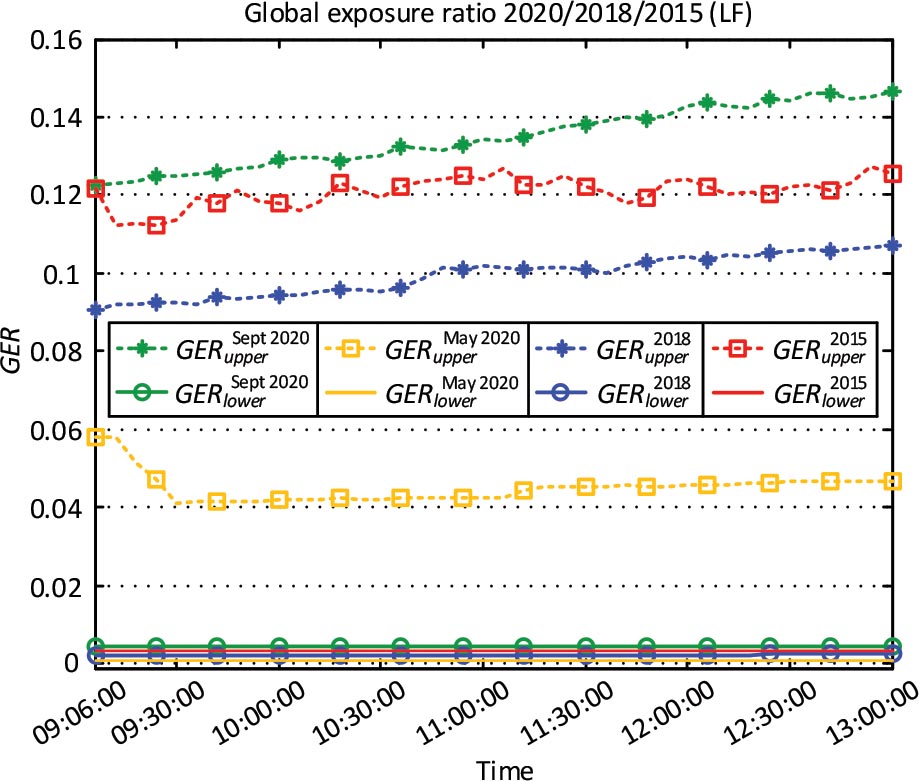
Figure 9: The low-frequency GER boundaries.
Statistical analysis of the low-frequency GER values is displayed in Table 5.
Table 5: Statistical analysis of the low-frequency GER
| Frequency range (5 Hz–32 kHz) | Min | Max | Avg | |
|---|---|---|---|---|
| Sept 2020 | ||||
| May 2020 | ||||
| 2018 | ||||
| 2015 | ||||
| Sept 2020 | ||||
| May 2020 | ||||
| 2018 | ||||
| 2015 |
It can be observed that the maximum values of GER in September 2020 campaign are between and , which is clearly lower than , the maximum level allowed by the legislation of the Republic of Serbia [17].
Furthermore, comparing the obtained GER boundaries, it can be observed that the average value of in 2018 campaign was less than in 2015 by nearly 20%. In May 2020 campaign it was more than 2.5 times lower than in 2015, while in September 2020 it was about 10% higher than in the 2015 campaign.
Conclusively, all those GER values imply that the L1 location is a continuously low exposed location to the low-frequency magnetic field.
VII. CONCLUSION
The power distribution facilities cause public concerns related to the EMF exposure and potential health effects, especially in circumstances of their presence in residential areas. The high-power substation “Novi Sad 7” is a typical example of a distribution substation that is surrounded by a moderately populated area.
Thus, EMF monitoring campaigns were conducted in 2015, 2018 and 2020, in the close vicinity of this substation. The focus of these campaigns was the determination of the existing EMF levels, both in the low- and the high-frequency ranges, as well as general population exposure. The positions close to substation, where people had access, such as frequently used pedestrian paths outside the substation area, were of special interest.
Regarding the high-frequency electric field, a comparative analysis of EMF exposure has showed that GER boundaries in 2018 were almost two times lower than in 2015. The reason was the fact that the internal radio for the SCADA application, as one of the dominant sources, was changed due to the operational regime, transferring data only in the case of malfunction of the primary link.
Exposure boundaries in 2020 campaign had somewhat higher values than in 2018, possibly due to the increased mobile communication traffic. The maximal detected electric field level, in all performed campaigns, was 0.27 V/m, which is well below the Serbian minimal prescribed reference level of 11 V/m.
With regard to the low-frequency magnetic field, the analysis revealed that there was an increase in the current consumption and also an increase in the maximum value of upper exposure boundaries, for about 10%, comparing the first 2015 campaign and the last one in September 2020. A significant decrease of the exposure level during May 2020 campaign was noticed, which was caused by the power distribution system failure. However, the maximum exposure level, detected in September 2020 campaign, was about 6.8 times lower than the maximum allowed level prescribed by the Serbian legislation.
According to the obtained measurement results and performed analysis, it can be concluded that monitored locations at the vicinity of “Novi Sad 7” substation are low exposed locations, both to the low-frequency magnetic and the high-frequency electric fields.
However, the construction of the second HV line, as an underground cable, interconnecting the “Novi Sad 7” to some other neighboring high-power substations is under work. Additionally, due to further improvement and construction of Smart Grid, the expansion of the internal radio communication systems is under consideration. Finally, the power distribution facilities have a commercial potential for service providers and mobile operators. In that sense, in due time, they will become an even more important radio communication nodes, besides their already crucial role in electric power system.
All these circumstances will lead to a potential increase of EMF radiation, imposing the necessity for future periodic monitoring campaigns. The goal is and will be to obtain a detailed insight into the EMF field changes and exposure levels in the substation’s vicinity.
ACKNOWLEDGMENT
This paper has been supported by the Provincial Secretariat for Science and Technological Development of Autonomous Province of Vojvodina, through grant for project 142-451-2603/2021-01/02.
REFERENCES
[1] Special Eurobarometer 347, “Electromagnetic Fields,” https://data.europa.eu/euodp/en/data/dataset/S843_73_3_EBS347, 2014, last accessed September 2021.
[2] A. I. Tarmizi, M. D. Rotaru, and J. K. Sykulski, “Magnetic field calculations within substation environment for EMC studies,” 2016 IEEE 16th International Conference on Environment and Electrical Engineering (EEEIC), Florence, Italy, pp. 1-6, Jun. 2016, doi: 10.1109/EEEIC.2016.7555613.
[3] A. Orłowski, R. Pawlak, A. Kalinowski, and A. Wójcik, “Assessment of human exposure to cellular networks electromagnetic fields,” 2018 Baltic URSI Symposium (URSI), Poznan, Poland, pp. 257-260, May 2018, doi: 10.23919/URSI.2018.8406750.
[4] ICNIRP, “Guidelines for Limiting Exposure to Time-Varying Electric, Magnetic and Electromagnetic Fields (up to 300 GHz),” Health Physics, vol. 75, no.4, pp. 494-522, Apr. 1998.
[5] C. D. Abreu Silveira, C. A. Da Costa, R. D. Costa E Silva, L. R. Soares, and J. C. Pugliese Guimaraes, “Electromagnetic Environment Measurement under Steady-State Conditions in Utility Substations,” 2006 IEEE/PES Transmission & Distribution Conference and Exposition: Latin America, Venezuela, pp. 1-6, Aug. 2006, doi: 10.1109/TDCLA.2006.311511.
[6] A. S. Safigianni and C. G. Tsompanidou, “Measurements of electric and magnetic fields due to the operation of indoor power distribution substations,” in IEEE Transactions on Power Delivery, vol. 20, no. 3, pp. 1800-1805, Jul. 2005, doi: 10.1109/TPWRD.2005.848659.
[7] A. S. Safigianni and C. G. Tsompanidou, “Electric and magnetic field measurements in an outdoor electric power substation,” in IEEE Transactions on Power Delivery, vol. 24, no. 1, pp. 38-42, Jan. 2009, doi: 10.1109/TPWRD.2008.917690.
[8] A. S. Safigianni, C. G. Tsompanidou, and V. L. Kanas, “Electric and magnetic field measurements in a high voltage venter,” The Annals of Occupational Hygiene, vol. 56, no. 1, pp. 18–24, Jan. 2012, doi: 10.1093/annhyg/mer076.
[9] K. Ellithy, A. Al Shafai, F. Al Assiry, “Measuring human exposure to magnetic fields in substations and power lines located in Qatar,” Study Committee C3 – System Environmental Performance, CIGRE, Paris, Aug. 2012.
[10] W. Joseph, L. Verloock, and L. Martens, “General public exposure by ELF fields of 150–36/11 kV substations in urban environment,” in IEEE Transactions on Power Delivery, vol. 24, no. 2, pp. 642-649, Apr. 2009, doi: 10.1109/TPWRD.2008.2002686.
[11] L. Korpinen, H. Kuisti, R. Paakkonen, and J. Elovaara, “Occupational exposure to electric and magnetic fields while working at switching and transforming stations of 110 kV,” Annals of Occupational Hygiene, vol. 55, no. 5, pp. 526-536, Jun. 2011, doi: 10.1093/annhyg/mer013.
[12] C. Oliveira, D. Sebastiao, G. Carpinteiro, L. Correia, C. Fernandes, A. Serralha, and N. Marques, “The moniT project: electromagnetic radiation exposure assessment in mobile communications,” IEEE Antennas and Propagation Magazine, vol. 49, no. 1, pp. 44-53, Feb. 2007, doi: 10.1109/MAP.2007.370981.
[13] E. Lunca, A. Salceanu, “An overview of RF-EMF monitoring systems and associated monitoring data,” 2016 International Conference and Exposition on Electrical and Power Engineering (EPE 2016), Lasi, Romania, pp. 418-421, Oct. 2016, doi: 10.1109/ICEPE.2016.7781374.
[14] N. Djuric, D. Kljajic, K. Kasas-Lazetic, and V. Bajovic, “The measurement procedure in the SEMONT monitoring system,” Environmental Monitoring and Assessment, vol. 186, no. 3, pp. 1865-1874, Mar. 2014, doi: 10.1007/s10661-013-3500-0.
[15] N. Djuric and D. Kljajic, “Assessment of daily exposure in the broadband continuous monitoring system – SEMONT,” 11th IEEE AFRICON Conference, Mauritius, pp. 903-907, Sep. 2013, doi: 10.1109/AFRCON.2013.6757844.
[16] N. Djuric, J. Bjelica, D. Kljajic, M. Milutinov, K. Kasas-Lazetic, and D. Antic, “The SEMONT continuous monitoring and exposure assessment for the low-frequency EMF,” 2016 IEEE on Emerging Technologies and Innovative Business Practices for the Transformation of Societies (EmergiTech), Mauritius, pp. 50-55, Aug. 2016, doi: 10.1109/EmergiTech.2016.7737309.
[17] “Rulebook on non-ionizing radiation exposure limits,” Official gazette of the Republic of Serbia, no. 104/09, http://www.sepa.gov.rs/download/strano/pravilnik5.pdf, last accessed September 2021.
[18] Distribution System Operator “EPS Distribucija,” Internet portal, http://www.epsdistribucija.rs, last accessed September 2021.
[19] G. Nedic, N. Djuric, D. Kljajic, M. Milutinov, and S. Josic, “The exposure assessment to communication equipment of high-power substation,” IEEE 24th Telecommunications Forum TELFOR 2016, Section 6 – Applied Electromagnetics, Belgrade, Serbia, pp. 609-612, Nov. 2016, doi: 10.1109/TELFOR.2016.7818857.
[20] G. Nedic, N. Djuric, D. Kljajic, K. Kasas-Lazetic, and M. Pascan, “Comparative analysis of the exposure assessment to communication equipment of high-power substation,” IEEE 26th Telecommunications Forum TELFOR 2018, Section 6 – Applied Electromagnetics, Belgrade, Serbia, pp. 450-453, Nov. 2018, doi: 10.1109/TELFOR.2018.8612018.
[21] G. Nedic, D. Antic, D. Kljajic, and N. Djuric, “The SEMONT system utilization for high-frequency EMF monitoring in vicinity of 110/x kV “Novi Sad 7” power substation,” Study Committee EC 2 – Power Quality and Electromagnetic Compatibility, 10. CIRED Conference, Vrnjacka Banja, Serbia, pp. 1-9, Sep. 2016.
[22] D. Kljajic and N. Djuric, “The adaptive boundary approach for exposure assessment in a broadband EMF monitoring,” Measurement, vol. 93, pp. 515-523, Nov. 2016, doi: 10.1016/j.measurement.2016.07.055.
[23] SRPS EN 50413:2020, 2020: “Basic standard on measurement and calculation procedures for human exposure to electric, magnetic and electromagnetic fields (0 Hz–300 GHz)”.
[24] Distribution System Operator “EPS Distribucija,” “Energy data 2020” newsletter, http://epsdistribucija.rs/pdf/GI_2020.pdf, last accessed September 2021.
[25] “Decree on determining the allocation plan of radio frequency bands,” Official gazette of the Republic of Serbia, no. 89, 2020, http://www.srv.org.rs/pages/dok/plan_namene_rf_opsega.pdf, last time accessed September 2021.
BIOGRAPHIES

Goran Nedic graduated in 1992 at the Faculty of Technical Sciences, University of Novi Sad, while he was awarded M. Sc. in Electrical Engineering from the University of Belgrade, Republic of Serbia, in 2008. He is an Information and Communication Technology (ICT) engineer with significant experience in wireless and fixed communications and various monitoring and control systems for large enterprises. His interests include an issue about the reliability of ICT and SCADA equipment in specific working environment, such as electric power distribution system.

Nikola Djuric was born in Novi Sad, Serbia, in 1973. He received M.Sc. and Ph.D. degrees in Telecommunication and Signal Processing from the Faculty of Technical Sciences, University of Novi Sad, in 2003 and 2009, respectively. From 1997 to 2010 he was a Teaching Assistant; from 2010 to 2015 Assistant Professor; from 2015 to 2020 Associate Professor; while since 2020 he has been a Full Professor at FTN-UNS. He is the author or co-author of more than 100 journal and conference articles. His research interests include the computational and applied electromagnetics, with environmental EMF measurement and monitoring for EMF compliance testing, estimation, and simulation of EMF whole-body exposure. He is a member of IEEE society.

Dragan Kljajic was born on April 29, 1987 in Novi Sad, Republic of Serbia. He obtained his Ph.D. in Electrical and Computer Engineering from the Faculty of Technical Sciences, Novi Sad, from the Department of Power, Electronic and Telecommunication Engineering. He works as an Assistant Professor. His scientific area is theoretical electrotechnics, while his research interests are in the field of theoretical electrical engineering, theoretical and applied electromagnetics and microelectronics. He is the author or co-author of more than 50 scientific papers, published in Proceedings of international conferences and high impact factor journals. He is a member of IEEEsociety.
ACES JOURNAL, Vol. 37, No. 1, 129–139.
doi: 10.13052/2022.ACES.J.370115
© 2021 River Publishers