Multiple Frequencies Five-Port Reflectometer (FPR) for Pure and Adulterated Honeys
E. M. Cheng4, S. F. Khor5, N. F. Mohd Nasir7, C. W. S. Robiah Mohamad1, and E. Z. Mohd Tarmizi8
1Faculty of Electronic Engineering & Technology, Universiti Malaysia Perlis, Arau, 02600, Perlis, Malaysia
emcheng@unimap.edu.my, shahriman@unimap.edu.my, nashrul@unimap.edu.my, robiah@unimap.edu.my
2Centre of Excellence for Advanced Communication Engineering (ACE), Universiti Malaysia Perlis, Arau, 02600, Perlis, Malaysia
3Centre of Excellence for Automotive & Motorsport Technology (MOTECH), Universiti Malaysia Perlis, Arau, 02600, Perlis, Malaysia
4Lee Kong Chian Faculty of Engineering & Science, Tunku Abdul Rahman University, Sungai Long Campus, Jalan Sungai Long, Sungai Long City, Cheras, 43000 Kajang, Selangor, Malaysia
kylee@utar.edu.my
5Faculty of Electrical Engineering & Technology, Universiti Malaysia Perlis (UniMAP), Perlis, Malaysia
sfkhor@unimap.edu.my
6Centre of Excellence for Sport Engineering (SERC), Universiti Malaysia Perlis, Arau, 02600, Perlis, Malaysia
7Department of Process and Food Engineering, Faculty of Engineering, Universiti Putra Malaysia UPM, 43400, Serdang, Selangor, Malaysia
sitiaishah1108@gmail.com
8Centre of Foundation Studies for Agricultural Science, Universiti Putra Malaysia UPM, 43400, Serdang, Selangor, Malaysia
emma@upm.edu.my
Submitted On: March 9, 2022; Accepted On: July 16, 2022
Abstract
Honey adulteration is one of the major health concerns among honey consumers, it is essential to inspect the quality of honey. One of the methods is to characterize the honey by using the microwave reflection technique. A Five-Port Reflectometer (FPR) is proposed in this work. The microstrip Five-Port ring junction circuit was designed for multiple frequencies of 0.60 GHz, 2.28 GHz, and 3.47 GHz. The fabricated circuit works with an analogue-digital converter, open-ended coaxial sensor, diode detectors and computer to form a complete FPR measurement system. The reflection measurements were conducted on Honey Gold and Trigona Honey for multiple frequencies. The performance of the FPR in s-parameter measurement was verified by Vector Network Analyzer (VNA). This study shown that the performance of FPR in term of reflection measurement has promising accuracy which is comparable with VNA. The FPR can be used as an alternative instrumentation system for characterizing pure and adulterated honey.
Index Terms: Dielectric, honey, reflectometer, reflection, sensor.
1 INTRODUCTION
Honey is sweet, viscous and nutrient-rich that produced by bees from nectar of plants or honeydew [1]. It can be used for the treatment of burn wounds and ulcers [2]. However, honey is overprice due to its health giving properties and market demand. At the same time, honey adulteration is a major issue in the honey’s industry. This is because only pure honey able to provide anti-inflammatory and antifungal properties that leads to precious medicinal values [3].
Conventionally, honey quality is measured by human sensory method via color, viscosity, smell, and flavor [4]. However, the human sensory method is not scientific as it is dependent on subjective judgement that based on experience of an individual. On the other hand, chemical analyses, e.g. chromatography [5], high performance liquid chromatography [6] and mass spectrometry [7] were used to characterize the honey. The chemical analyses require high performance of instruments, time-consuming and high skilled procedures that limit the measurement in laboratory.
In recent years, microwave technique is widely uses in characterizing material such as food and agricultural products. The technique is a non-destructive, simple and fast processing method that based on the reflection measurement. On the other hand, the measurement technique can be easily adapted by an enhanced measurement setup that improve the effectiveness of material characterization measurement [8]. Food properties can be considered as a major contributing factor to describe the reflection between microwaves and food products [9] which depict the storage and dissipation of electromagnetic energy [10]. There are plants, foods and agricultural products have been investigated in past works that are associated with electrical characterization, e.g. sea cucumber [11], corn flour [12], peanut kernels [13], oil palm fruit [14, 15], vegetation [16], agri-food [17] and etc. Based on the studies, electrical properties of food are dependent on the moisture, frequency, temperature, density and the physical state of a food [18]. The dielectric characterization had achieved a great success in the food technology and agricultural industry which can be associated with the behaviour of food material. Hence, honey characterization by using the microwave reflection measurement has a great development potential for instrumentation system.
2 MATERIALS AND METHODS
2.1 Development of five-port reflectometer (FPR)
The principle of Five Port Reflectometer (FPR) was introduced by Riblet and Hansson [20] in 1983 based on the origin of Six-Port which proposed by Engen in 1977 [19]. The FPR is a low cost and portable alternative to VNA. It simplifies the circuitry by eliminating one of the ports in Six-Port which used to detect the power of input signal. The FPR is feasible when the connected signal source performs stable [21]. In the FPR, three detection ports are connected to diode detectors, while another two ports are connected to power source and sensing port, respectively. In a five-port algorithm [20], it requires reflection coefficients (in magnitude) agree with . In addition, the transmission coefficients (in magnitude) need to agree with . All these requirements must be complied for optimum performance of FPR. Apart from that, the phase difference between each port must be approximately 120 or 120 (+240).
The FPR’s circuit consists of five ports which can be designed by using a symmetrical Five-Port ring junction circuit. The computational electromagnetics techniques play an indispensable role in the realms of electronics design and optimisation [22]. Some numerical simulation technologies are required as well to guarantee its features especially in solving large-scale Maxwell’s equations [23]. In this work, a multiple frequencies Five-Port ring junction circuit was designed and simulated using AWR Microwave Office (MWO) in accordance the Riblet and Hansson theory. The compliance of the circuit performance was verified by reducing the mismatch error between the component parts through the simulation in MWO. The optimum length, radius corner and width for the components of ring junction were determined for a compactness of size.
Table 1: Dimension of circuit
| Parameters | Specification (m) |
|---|---|
| Length 1, L1 | 8700 |
| Length 2, L2 | 2070 |
| Length 3, L3 | 1280 |
| Radius 1, R1 | 7600 |
| Radius 2, R2 | 7000 |
| Width, W | 4500 |
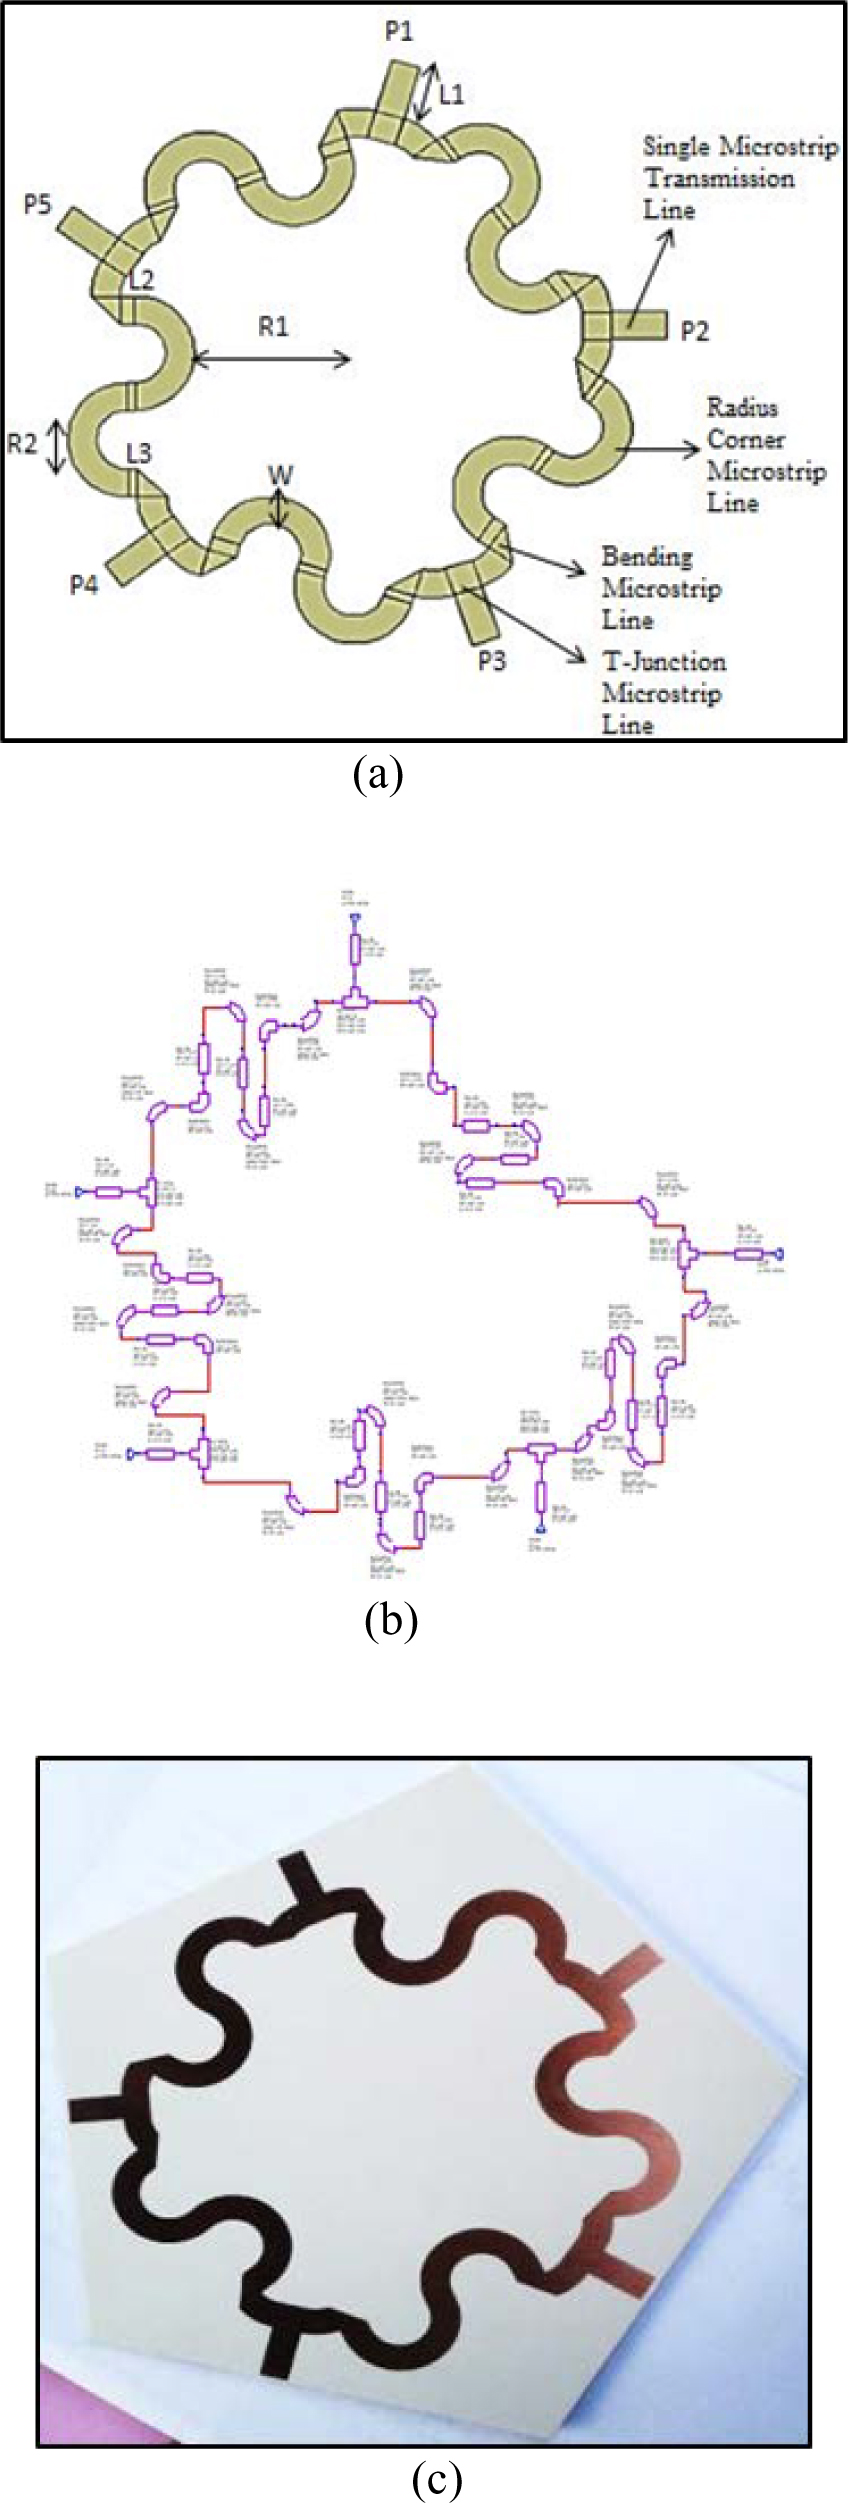
Figure 1: Design and simulation of five-port ring junction circuit. (a) Circuit layout, (b) schematic diagram, and (c) fabricated circuit.
The simulated circuit consists of the components of single microstrip transmission line, T-junction, bending and radius corner microstrip line. The dimensions of the circuit are tabulated in Table 1 where the length1 (L1), length2 (L2), length (L3), radius 1 (R1), radius 2 (R2) and width (W) are in the unit of m. The layout is as illustrated in Fig. 1 (a) with a special bending designed to minimise the size of the five-port circuit. The dielectric substrate used in this design is Rogers RO3003 high frequency laminates (dielectric constant, r = 3 thickness of substrate = 1.52 mm thickness of copper cladding = 35 m). It is a ceramic-filled PTFE composites for use in printed circuit boards in commercial microwave and RF applications. The schematic diagram of ring junction circuit in MWO is shown in Fig. 1 (b). This circuit layout is able to meet the requirements of Riblet and Hansson Theory for frequency up to 3.5 GHz with multiple frequency features. Operating frequencies for the designed circuit are 0.60 GHz, 2.28 GHz, and 3.47 GHz. These three frequencies have been selected based on the minimum error observed in the simulated result. Other frequency band can be designed by adjusting the dimensions of the components in the circuit. Five-Port ring junction circuit was fabricated as illustrated in the Fig. 1 (c). The performance of fabricated circuit was validated using VNA to ensure it has good agreement with the requirements that stipulated in Riblet and Hansson theory.
The reflection coefficient, and the signal detected at each detection port, qi can be expressed in complex form as and respectively. Meanwhile, (i = 1, 2, 3) is in the real forms where ki is calibration constant and pi is emerging power detected at specific port (i = 1, 2, 3). The reflection coefficient can be determined by solving the eqn (1) using the power detected from each port, i.e. P1, P2, and P3. Meanwhile, k1,k2,k3,x1,x2,x3,y1,y2,y3 are the values which determined through the calibration procedure.
| (1) |
A Graphical User Interface (GUI) program is developed by using the Agilent VEE Pro 6.0. The GUI program has three modules, i.e., save calibration (save cal), calibration and measurement. Figure 2 shows the panel view of the GUI program. The save calibration section was used to save the measured data of the selected calibration standards in calibration section. The calibration procedures are completed when the GUI programming is performed the correction of the measurement setup via measured calibration standards data. This includes the compute of unknown constants of Five-Port calibration equations. The computed constants are to be used for the computation of complex reflection coefficient in the measurement. Calibration needs to be conducted prior to reflection measurement which it is needed to remove the systematic error.
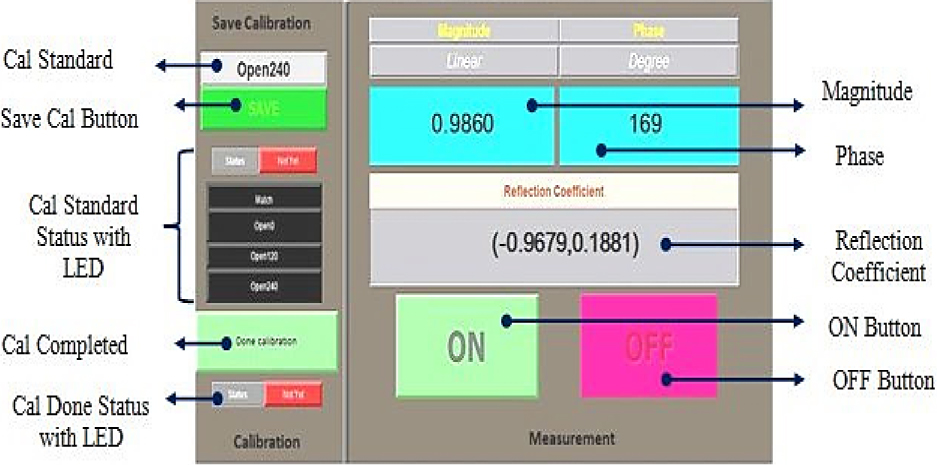
Figure 2: Panel view of Graphical User Interface.
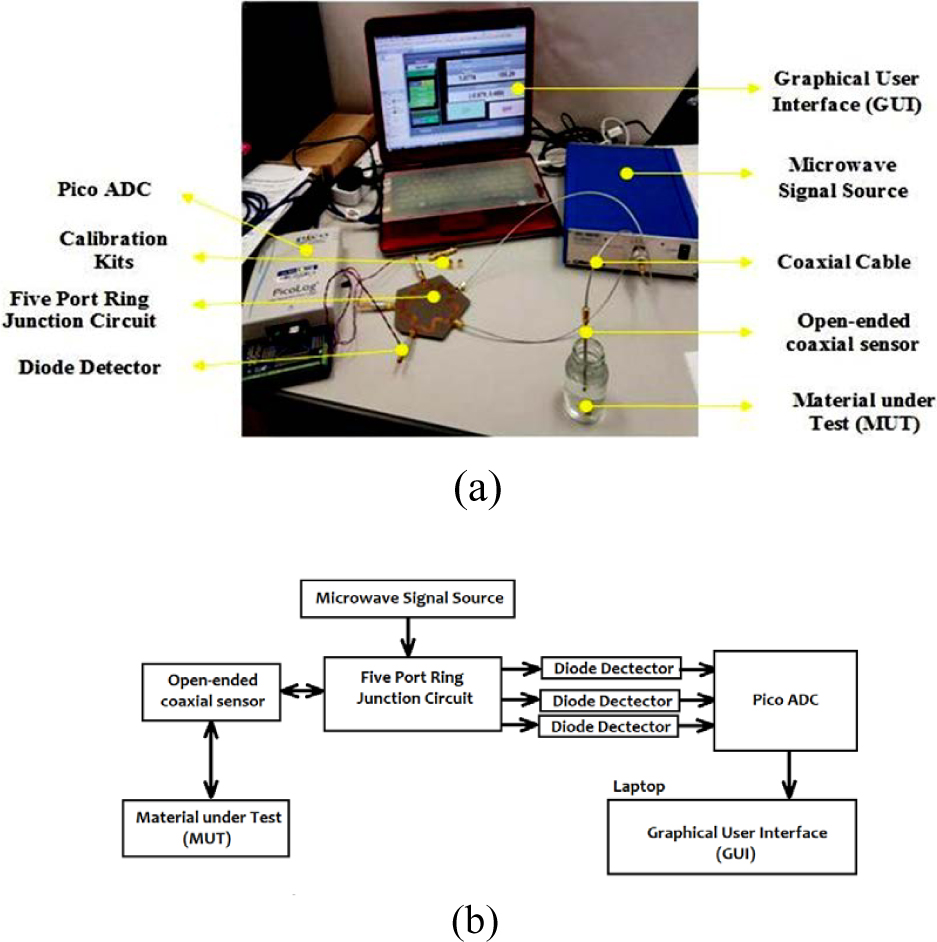
Figure 3: The Five-Port Reflectometer (FPR) (a) Measurement Setup, (b) Measurement diagram.
The module of measurement can be used after the calibration is completely conducted. The measurement to determine the complex reflection coefficient, of material under test (honeys) in magnitude and phase as well as in real and imaginary form can be conducted and controlled by using the ON/OFF Button on the panel of the GUI program.
Generally, the measurement setup of the FPR consists of a computer (with a GUI program), microstrip Five-Port ring junction, three Keysight diode detectors, Mini Circuit microwave signal generator, open-ended coaxial sensor and PICO analogue-digital converter (ADC). The input port of microstrip Five-Port ring junction is supplied with the microwave signal source. The test port is connecting to an open-ended coaxial sensor. Meanwhile, the other three ports are connected with diode detectors to detect and convert the reflected field strength to be in an electrical voltage form. The detected analog voltages are then be further transform into a digital signal by PICO ADC. The developed GUI program is used to acquire data, conduct computation of Five-Port algorithm and calculation of reflection coefficient. Figure 3 illustrates the complete measurement setup of FPR. The emerging wave due to interaction of incident and reflected waves are distributed in each of power detecting ports in five-port circuit. Variation in reflection coefficient, at test port which connects with open-ended coaxial sensor attributed to different reflected wave at power detectingport due to electrical discontinuity occur during reflection measurement.
2.2 Sample preparation
Two types of pure honey are used, i.e., pure Honey Gold (‘Lebah Asli’) and pure Trigona Honey(‘Kelulut’) as shown in Fig. 4. Both honeys are obtained commercially from the Harmony Bee Farm, which is located in Perlis state, Malaysia. The selected honey samples are based on the market demand and issue of adulteration in the honey’s industry. In this work, these honeys act as representatives in general to study the behaviour and characterization of adulterated honey sample. The initial water content for both honeys, i.e., pure Honey and pure Trigona Honey is 18% and 35%, respectively. The water content was measured through standard oven drying method [24]. In this method, sample of honey is poured evenly on a petri dish and the weight were measured using a precision balance. It was heated in the oven at 40C for 1 hour. Afterward, the weight of sample was measured again. The process is repeatedly until the difference between successive heated sample is insignificant in term of weight. The initial water content of honey is then calculated using wet basic formulaas follows:
| (2) |
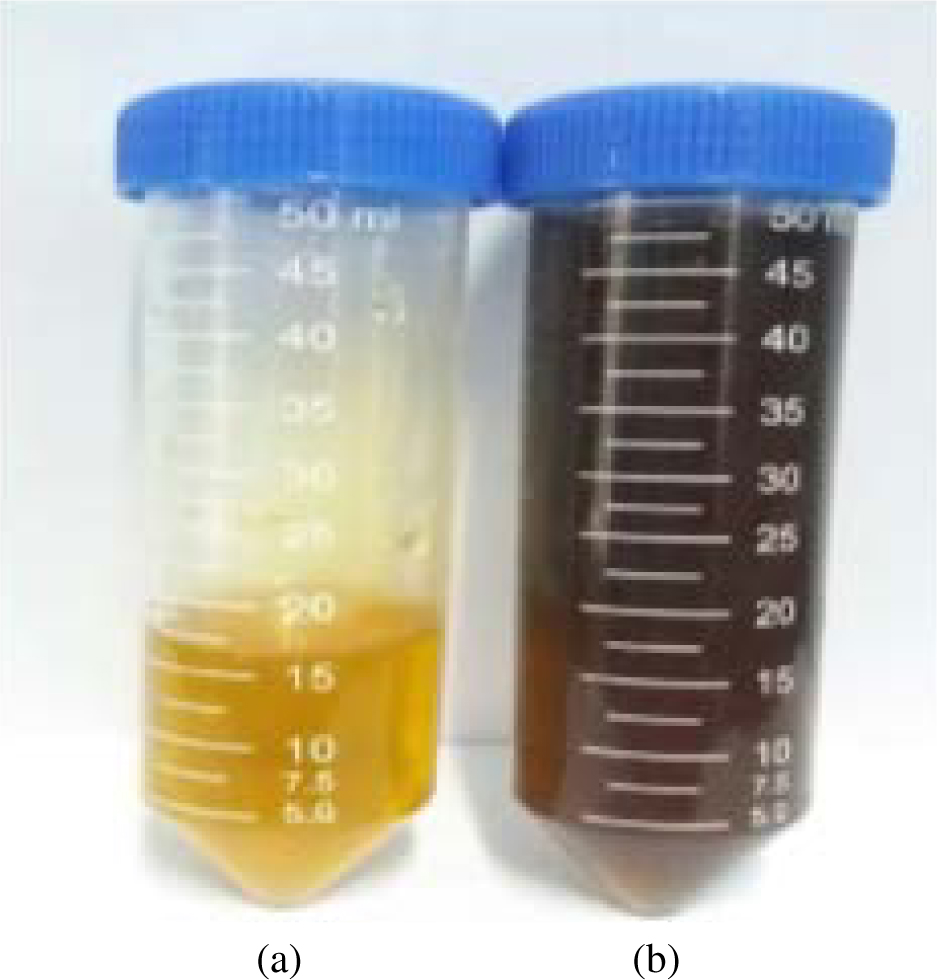
Figure 4: Pure honey samples: (a) Honey Gold and (b) Trigona Honey.
In this work, water adulterated and sucrose adulterated honey were prepared as sample under test. The major composition in Honey Gold and Trigona Honey is sucrose, fructose and glucose. However, the fructose and glucose have higher nutrition value than sucrose.In addition, sucrose is cheap in cost. As a result, sucrose is being used frequently in honey adulteration. It is very common in food industry. Sucrose can cause severe hazard to diabetic patient. Sucrose is out of the range of acceptable Glycemic Index (GI) where GI is a measure of impact of blood glucose on anindividual [30].
For preparation of water adulteration sample, a 5 ml of Honey Gold or Trigona Honey was kept in centrifugal tube with a constant amount. The water was added for a variation of sample based in the determination of water content on the weight ratio percentage (% wt/wt). It is expressed as [25].
| (3) |
where
M = Mass of 5ml of honey which equivalent to 7g
M = Mass of distilled (deionized) water (1ml of distilled water =1g)
Wi = Initial water content (%) of both pure honey samples
Table 2: Comparison between measured and simulated S-parameter (S) in (a) magnitude, || and (b) phase, with various frequency (f)
| (a) | ||||
| f (GHz) | S (Mag) | Measure | Simulate | Absolute Error |
| 0.60 | |S11| | 0.1007 | 0.0092 | 0.0915 |
| |S21| | 0.4443 | 0.4933 | 0.0503 | |
| |S31| | 0.5358 | 0.5066 | 0.0292 | |
| |S41| | 0.5339 | 0.5066 | 0.0273 | |
| |S51| | 0.4428 | 0.4933 | 0.0505 | |
| 2.28 | |S11| | 0.0546 | 0.0122 | 0.0668 |
| |S21| | 0.4771 | 0.5074 | 0.0303 | |
| |S31| | 0.4744 | 0.4924 | 0.0161 | |
| |S41| | 0.4763 | 0.4924 | 0.0274 | |
| |S51| | 0.4805 | 0.5074 | 0.0269 | |
| 3.47 | |S11| | 0.0146 | 0.0031 | 0.0115 |
| |S21| | 0.4504 | 0.5008 | 0.0504 | |
| |S31| | 0.4409 | 0.4992 | 0.0583 | |
| |S41| | 0.5061 | 0.4992 | 0.0069 | |
| |S51| | 0.4876 | 0.5008 | 0.0132 |
| (b) | ||||||
| f (GHz) | S (Phase) | Measure () | |Phase Difference| (Measured) () | Simulate () | Phase Difference (Simulated) () | Absolute Error of Phase Difference () |
| 0.60 | S21 | 284 | 113 | 284 | 120 | 7.00 |
| S31 | 171 | 164 | ||||
| S41 | 170 | 113 | 284 | 120 | 7.00 | |
| S51 | 284 | 164 | ||||
| 2.28 | S21 | 357 | 242 | 353 | 239 | 3.00 |
| S31 | 115 | 114 | ||||
| S41 | 114 | 239 | 114 | 239 | 0.00 | |
| S51 | 353 | 353 | ||||
| 3.47 | S21 | 186 | 113 | 191 | 120 | 7.00 |
| S31 | 73 | 71 | ||||
| S41 | 77 | 117 | 71 | 120 | 3.00 | |
| S51 | 194 | 191 |
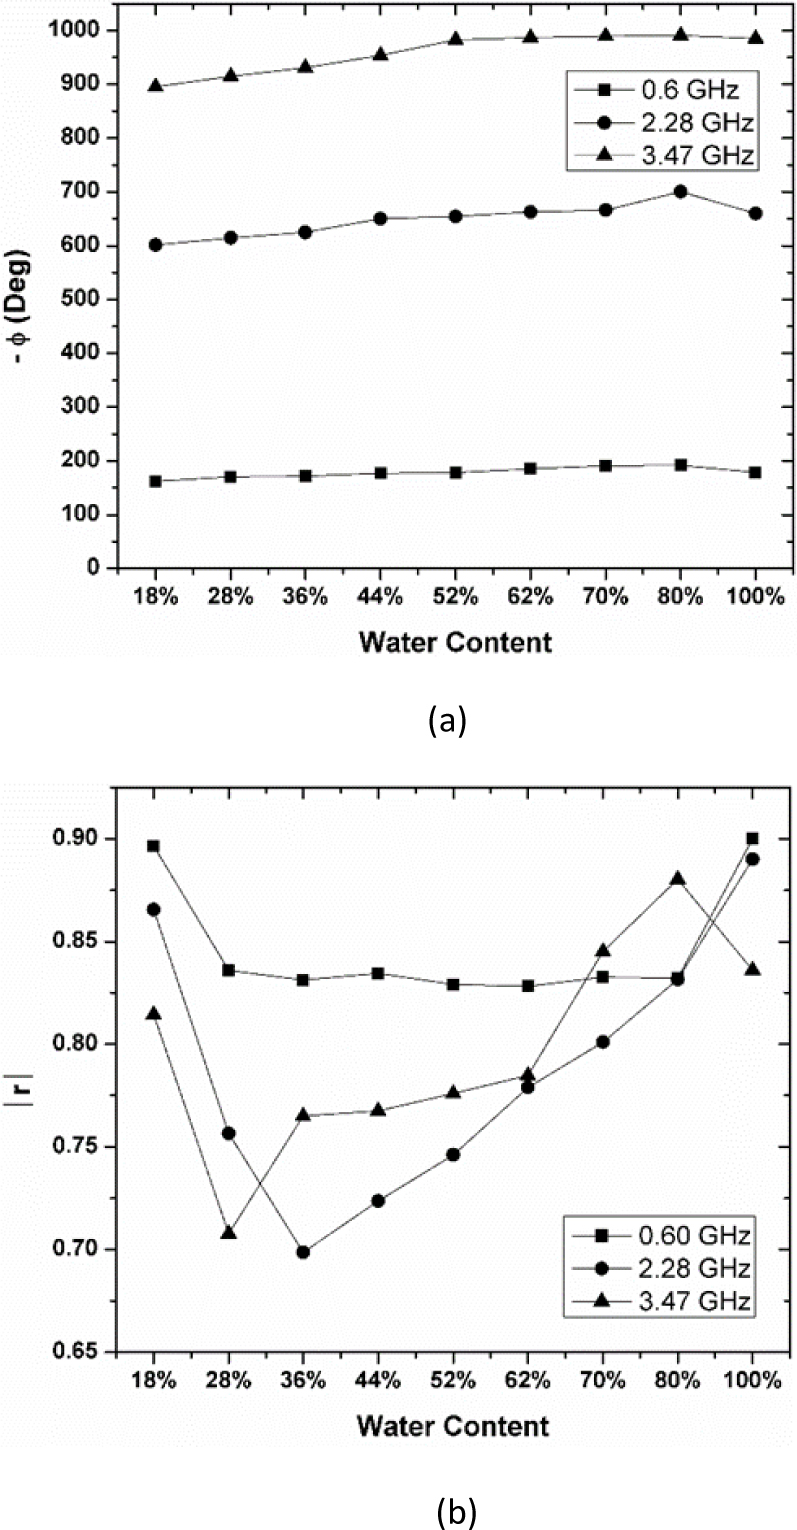
Figure 5: The variation of (a) magnitude (), and (b) negative phase () of reflection coefficient over water content with various frequencies for Honey Gold.
In this work, distilled water with known amount is mixed with each honey sample. The weight of distilled water and honeys were measured. The water adulterated honey samples were prepared at room temperature.
On the other hand, the sucrose adulteration sample is prepared and studied. Each centrifugal tube is filled in with a 5ml for different honey samples by using the syringe (5ml). The sucrose syrup was prepared with various ratio, i.e., at ratio of 1:1 (20g of sucrose powder: 20g of distilled water) [26]. The sample with 100% indicates the pure sucrose syrup which acts as a control reference. The ratio of sucrose syrup were prepared by using the weight ratio percentage concentration by weight. The determination is expressed as
| (4) |
where mass of solute is sucrose powder while the mass of solvent is deionized distilled water. The ratio of sucrose syrup is within 10% to 100% and to be mixed with pure honey samples (0%). To achieved homogeneity and dilution of the honey-sucrose mixture samples prior to measurements, the samples were soaked in a water bath at 35C for at least 20 minutes All the measurement and samples were measured at roomtemperature.
3 RESULTS and DISCUSSIONS
3.1 Validation of five-port ring junction circuit
The simulated and measured S-Parameters for Five-Port ring junction are validated and tabulated in Table 2. The five ports ring junction circuit has three operating frequencies, i.e., 0.60 GHz, 2.28 GHz and 3.47 GHz. The simulated S-parameters at all three frequencies have a good agreement with theoretical result of less than less than 0.01 and 1.00 in magnitude and phase, respectively. At the same time, all three frequencies exhibit good agreement as indicated in Table 2. The performance of S-parameters of fabricated circuits was verified using a commercial Network Analyzer, Agilent E8362B PNA. It compares with simulated S-parameters through AWR Microwave Office. Absolute error of magnitude and phase of S-parameters through this comparison is less than 0.1 and 7, respectively.
3.2 Adulterated honey reflection coefficient measurement
From the observation of water adulterated honey measurements as illustrated in Figures 4 and 5, in average, the measured reflection coefficient magnitude, || of the water adulterated honey sample is lower when the frequency is higher. This can be described by the complex reflection coefficient, as express in the eqn (5),
| (5) |
The Z0 is the impedance of the coaxial line and open-ended coaxial sensor, while the load impedance, Z can be defined as mismatch impedance of the honeysample.
The variation of the water content in adulterated honey causes the mismatch impedance.
Prior to the measurement, the comparison of || and through measurement of known loads indicate that absolute error of || and is less than 0.07 and 9, respectively for all the frequencies of interest [27]. Figure 4 (a) shows that the pure Honey Gold has 18% of water content and exhibit highest || for frequency of 0.6 GHz and 2.28 GHz. The pure Honey Gold has lowest water content (18%) however leads to significant reflection. It is different from finding in Fig. 5 (a) where of water adulterated Trigona Honey exhibit the higher || when the water content is increasing. It indicates that level of mismatch impedance is different for both water adulterated honeys at variation of water content at different frequency band. It can be surmised that at 0.6 GHz, the reflection coefficient is decreases with the increasing of water content for both the pure Honey Gold and Trigona Honey. On the other hand, at 2.28 GHz and 3.47 GHz, the increases of water content leads to a drop of reflection coefficient and followed by a bounce back when the water content is increasing. This can be explained by the pure honey’s molecule forming and interaction of sample mixture to the microwave signal. The additional of water molecule in honey might lead to the dispersion of fructose, sucrose and glucose molecule, as water is important to reduce viscosity of solution. The water breaks the behaviour of pure honey and lead to a higher reflection coefficient when the percentage of water in increasing. Both honeys has slightly difference behaviour were due to the properties of mineral in the honey, e.g., the pure Trigona Honey contenting a very high percentage of Calcium, Potassium, Sodium, Magnesium, Zinc and etc. [28]. These minerals decline the magnetic effect of a sample when more water content is added to diamagnetic substance [29].
Figures 4 (b) and 5 (b) show the variation of negative phase, over frequency for Honey Gold and Trigona Honey, respectively. The increase as water content increases for all frequency band. The increase of were contributed by the addition of water that has high complex permittivity. The increases of indicated that the significant delayed time of incident field and reflected field occurred. It also suggests that time delay is lengthened during polarization when frequency increases. This delay is due to process of polarization and friction. The dissipated field energy increases with frequency. Subsequently, time delay increases since the dissipation of energy involves mechanism of collision and friction. Increment of time delay increase lagging phase shift is shown by the in this work.
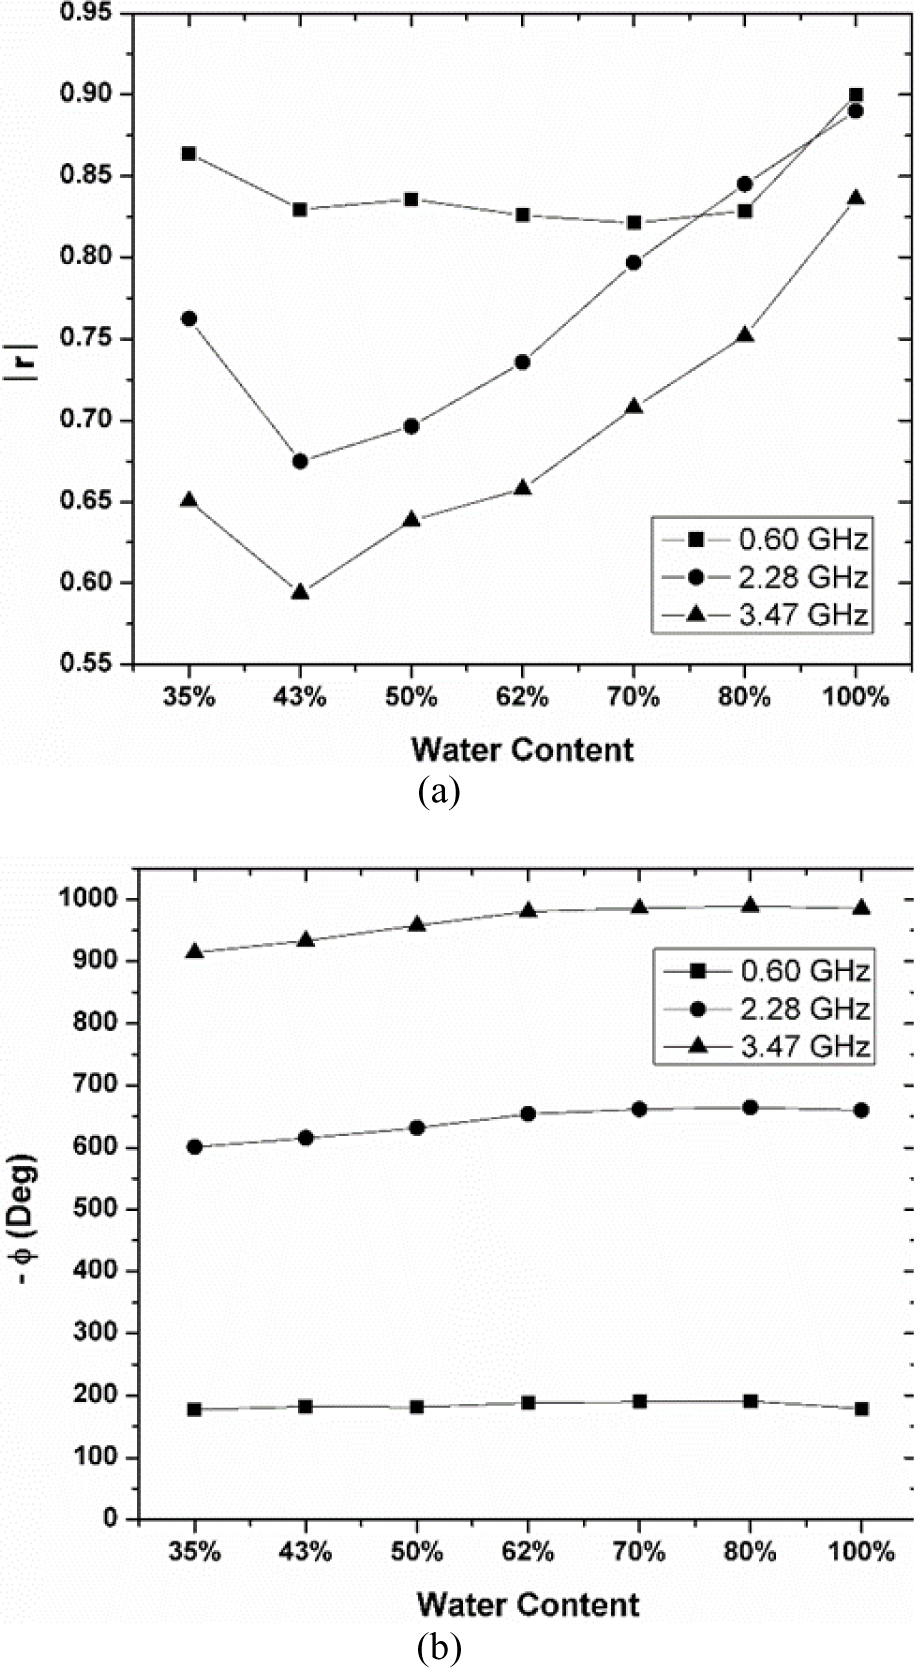
Figure 6: The variation of (a) magnitude (), and (b) negative phase () of reflection coefficient over water content with various frequencies for Trigona Honey.
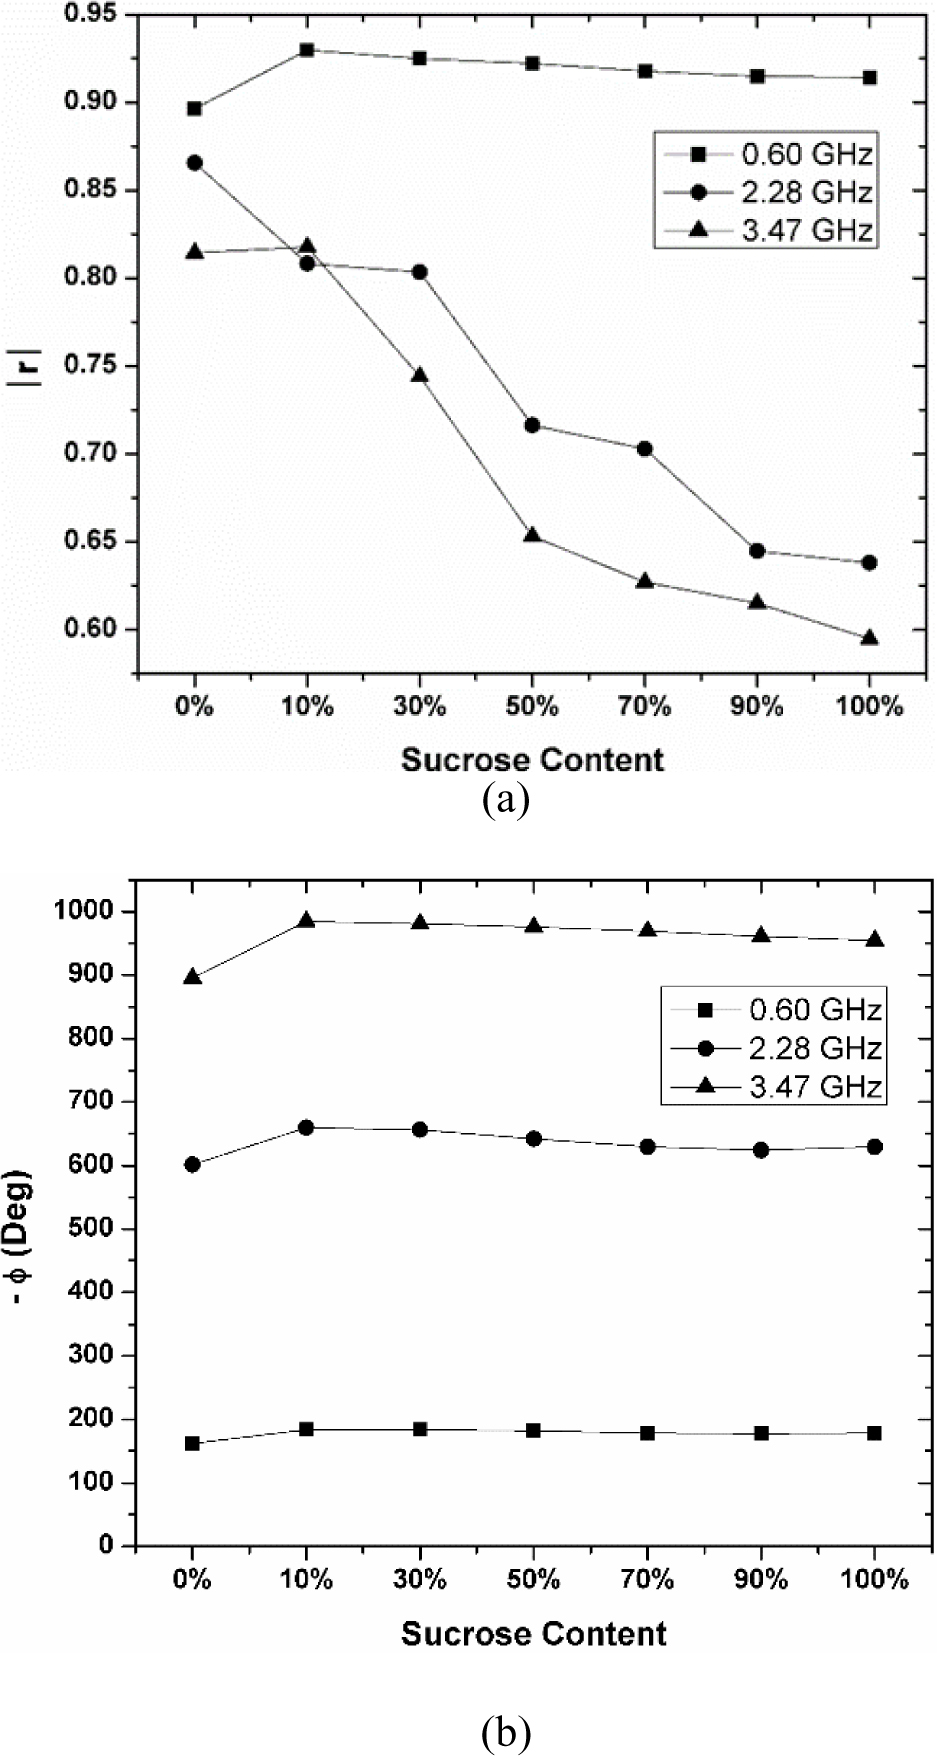
Figure 7: The variation of (a) magnitude (), and (b) negative phase () of reflection coefficient over sucrose content with various frequencies for Honey Gold.
Table 3: Mathematical expression for magnitude and phase in predicting water content (wc) for (a) Honey Gold and (b) Trigona Honey
| (a) | ||
| f (GHz) | || | |
| Equation | R | |
| 0.60 | = 1.384wc + 2.400wc 1.322 wc + 1.060 | 0.919 |
| 2.28 | = 3.849wc + 6.898wc 3.677wc + 1.325 | 0.972 |
| 3.47 | = 1.605wc + 3.156wc 1.657wc +1.004 | 0.814 |
| f (GHz) | (Deg) | |
| Equation | R | |
| 0.60 | = 48.56wc + 154.3 | 0.975 |
| 2.28 | = 146.1wc + 575.3 | 0.953 |
| 3.47 | = 168.8wc + 873.2 | 0.899 |
| (b) | ||
| f (GHz) | || | |
| Equation | R | |
| 0.60 | = 1.068wc + 2.238wc 1.536wc + 1.170 | 0.853 |
| 2.28 | = 7.603wc + 14.88wc 9.004wc + 2.412 | 0.977 |
| 3.47 | = 4.159wc + 8.260wc 4.928wc + 1.536 | 0.939 |
| f (GHz) | (Deg) | |
| Equation | R | |
| 0.60 | = 32.01wc + 166.4 | 0.931 |
| 2.28 | = 148.9wc + 553.1 | 0.946 |
| 3.47 | = 172.4wc + 862.2 | 0.910 |
Apart from water, sucrose is another additive in honey adulteration. The sucrose adulterated honeys measurements are as illustrated in Figs. 6 and 7. The Figs. 6 (a) and 7 (a) shown that when the frequency increases, the || decreases for both the Honey Gold and Trigona Honey samples. On the other hand, || decreases when sucrose content increases. It can be noticed that pure honey exhibits slightly lower than sucrose adulterated samples. It implies that the discrepancy of capacitive impedance of pure honey from characteristic impedance of coaxial line is due to high inertia of bound fructose (180 grams/mol), water (18 grams/mol) and sucrose (342 grams/mol) molecules. It increases difficulty of bound molecules in polarization. Subsequently, it reduces the energy dissipation rate. When 10% sucrose content was used to adulterate honey, additional sucrose molecules is sufficient enough to present as free molecules and they can be polarized easily. As a result, of adulterated honey is higher than pure honey for sucrose content more than 10% for adulteration. Worth to mention that the of sucrose adulterated Trigona Honey with only 10% sucrose addition in adulteration could increase drastically to a higher level due to the mineral contents as explained previously. In addition, sucrose is a diamagnetic substance [31] which is similar to the water. It decreases magnetic effect of minerals in a sampleunder test.
Overall, the negative phase, of sucrose adulterated Honey Gold in Fig. 6 (b) and Trigona Honey in Fig. 7 (b) varies insignificantly when sucrose content increases. The sucrose is heavier than glucose, water and fructose, it has high inertia. This causes great reluctance in polarization, friction and collision. As a result the variation of is smaller if compared to Figures 4 (b) and 5 (b) for water adulterated samples. Microwave signal has lower sensitivity towards sucrose content than water content due to the heaviest molecular weight of sucrose. It justified that sucrose content bring insignificant effect to phase measurement.
3.3 Relationship between reflection coefficient, water content, and sucrose content
In Table 3, the correlation of water content and reflection coefficient for each frequency exhibit considerable high for both honeys as indicated by the fitting coefficient R2. The R2 is a statistical measure that represents the proportion of the variance for a dependent variable that’s explained by an independent variable or variables in a regression model. The are fitted with cubic polynomial model while the are expressed in linear model. The cubic polynomial model was used in the fitting due to multiple reflections that attributed to inhomogeneity in sample under test. The multiple reflections may cause distortion on reflected fields due to constructive and destructive superposition. However, it affects linearly towards the . It is due to the extremely high of dipole moment of water molecule that becomes dominant in determining the measurement, instead of the effect from multiple reflection. As a result, polarization of water molecule in water adulterated honey cause linear relationship between and watercontent.
Table 4: Mathematical expression for magnitude and phase in predicting sucrose content (sc) for (a) Honey Gold and (b) Trigona Honey
| (a) | ||
| f (GHz) | || | |
| Equation | R | |
| 0.60 | = 0.652sc 1.152sc + 0.573sc + 0.848 | 0.772 |
| 2.28 | = 0.209sc 0.404sc + 0.097sc + 0.777 | 0.767 |
| 3.47 | = 1.727sc 2.973sc + 1.282sc + 0.612 | 0.871 |
| f (GHz) | (Deg) | |
| Equation | R | |
| 0.60 | = 227.9sc - 407.6sc + 205.2sc + 155.5 | 0.809 |
| 2.28 | = 690.4sc 1203sc + 564.9sc + 584.0 | 0.815 |
| 3.47 | = 843.6sc 1514sc + 772.7sc + 873.7 | 0.778 |
| (b) | ||
| f (GHz) | || | |
| Equation | R | |
| 0.60 | = 0.652sc 1.152sc + 0.573sc + 0.848 | 0.772 |
| 2.28 | = 0.209sc 0.404sc + 0.097sc + 0.777 | 0.767 |
| 3.47 | = 1.727sc 2.973sc + 1.282sc + 0.612 | 0.871 |
| f (GHz) | (Deg) | |
| Equation | R | |
| 0.60 | = 76.60sc 137.1sc + 66.74sc + 175.1 | 0.621 |
| 2.28 | = 491.3sc 905.7sc + 464.2sc + 588.8 | 0.738 |
| 3.47 | = 683.2sc 1217sc + 616.0sc + 897.4 | 0.770 |
In Table 4, the is similar as in Table 3 where it expressed cubically over sucrose content. However, the fitting of the sucrose content for both honeys is not linearly expressed in Table 4. It is different when compare with water adulterated honeys. The sucrose adulterated honey shows cubic mathematical expression to express the using sucrose content with considerable good of R(= 0.7). It was due to heavier molecular weight and smaller dipole moment of sucrose molecule than water molecule. The extreme dielectric behaviour of water molecule might divert attention from sucrose content during the measurement over adulteration of sucrose in both honeys as shown in Table 4. The seem more sensitive than . It can be justified by the high gradient of each mathematical model of in function of water and sucrose content.
The of sucrose adulterated honeys is more sensitive in responding to variation of sucrose content than water adulterated honeys in responding to the variation of water content. In general, sucrose molecule has heavier molecular weight than water molecule, but similar dipole moment with water molecule. Subsequently, it leads to high impedance mismatch. The molecular weight of water and sucrose molecule is 18 g/mol and 342 g/mol, respectively. This phenomenon causes high sensitivity of towards variation of sucrose during adulteration. Meanwhile, the is mostly exhibit higher sensitivity for water adulterated honeys than sucrose adulterated honeys.
Table 5: Mathematical models of actual water content (awc) and predicted water content (psc) for (a) Honey Gold and (b) Trigona Honey
| (a) | ||
| f (GHz) | || | |
| Equation | R | |
| 0.60 | awc = pwc | 1.000 |
| 2.28 | ||
| 3.47 | ||
| f (GHz) | (Deg) | |
| Equation | R | |
| 0.60 | awc = 1.020pwc + 0.006 | 0.999 |
| 2.28 | awc = 0.960pwc + 0.018 | 0.954 |
| 3.47 | awc = 0.901pwc + 0.046 | 0.900 |
| (b) | ||
| f (GHz) | || | |
| Equation | R | |
| 0.60 | awc = 0.990pwc + 0.002 | 0.997 |
| 2.28 | ||
| 3.47 | ||
| f (GHz) | (Deg) | |
| Equation | R | |
| 0.60 | awc = 0.929pwc + 0.038 | 0.926 |
| 2.28 | awc = 0.950pwc + 0.028 | 0.944 |
| 3.47 | awc = 0.907pwc + 0.052 | 0.920 |
The relationships of actual water content (awc) and predicted water content (pwc) as tabulated in Table 5. The prediction of water content of both honeys can be acquired through simple mathematical approach. However, the is not able to provide unique solution. It can be solved by implementing the developed cubic polynomial model as listed in Table 3 via inverse matrix method. Hence, it can be noticed that the relationship between awc and pwc is solely presented by one equation for three frequencies. The developed FPR exhibit R= 0.9 for both honeys in the for predicted real water content (pwc). Similarly, the of sucrose adulteration between real and predicted sucrose content achieve R= 0.9 for both honeys. Meanwhile, mathematical relationships for the are well presented in linear model with R= 0.8. All linear models provide unity gradient and null y-intercept. It implies that the predicted water content (pwc) has good agreement with actual water content (awc). Likewise, linear models to relate between actual sucrose content (asc) and predicted sucrose content (psc) as listed in Table 6 provide R2= 0.8 with approximate unity gradient and null yintercept.
Table 6: Mathematical models of actual sucrose content (asc) and predicted sucrose content (psc) for (a) Honey Gold and (b) Trigona Honey
| (a) | ||
| f (GHz) |
|| | |
| Equation | R | |
| 0.60 | asc = psc | 1.000 |
| 2.28 | ||
| 3.47 | ||
| f (GHz) |
(Deg) | |
| Equation | R | |
| 0.60 | asc = 0.997psc + 0.004 | 0.999 |
| 2.28 | ||
| 3.47 | ||
| (b) | ||
| f (GHz) |
|| | |
| Equation | R | |
| 0.60 | asc = psc | 1.000 |
| 2.28 | ||
| 3.47 | ||
| f (GHz) |
(Deg) | |
| Equation | R | |
| 0.60 | asc = psc | 1.000 |
| 2.28 | ||
| 3.47 |
To validate the data and ensure the reliability, the measurements of FPR were compared with the commercial Network Analyzer, Agilent E8362B PNA (vector network analyzer). The frequency response of measured and for FPR and PNA are consistent. Absolute error and is less than 0.15 and 17, respectively in measurement of water content in honeys. Meanwhile. the absolute error of and is less than 0.13 and 14, respectively in measurement of sucrose content in honeys.
In additional to the data used to fit, an additional experiment has been conducted to verify the correctness of the fitting functions in Tables 3–6. The measurement setup in this work provides an accurate prediction in terms of water content and sucrose content. and are accurate in predicting water content in both honeys with the absolute error 0.1 and 25. However, has the best agreement where it provides unity gradient and zero y intercept. Withal, and can also predict sucrose content accurately for both honeys with the mean absolute error of 0.04 0.03 and 7.6 6.4, respectively. and exhibit unity gradient and zero y-intercept. However, present the highest sensitivity towards the variation of sucrose content in honeys [27]. Suffice to say, FPR with developed five ports ring junction circuit can provide accurate water and sucrose content prediction for multiple frequencies. The FPR can be used as an alternative instrumentation system to characterize pure and adulterated honey.
4 CONCLUSION
The developed ring junction circuit with operating frequencies of 0.60 GHz, 2.28 GHz and 3.47 GHz. The simulated S-Parameter at these frequencies comply with Riblet & Hansson theory. Meanwhile, the measured S-Parameters through FPR at these frequencies have good agreement with simulated S-Parameter and has been validated with the VNA measurement. The relationship of water content (wc) or sucrose content (sc) with and were established in mathematical models. The mathematical correlation among wc or sc in pure and adulterated honeys with and were investigated through coefficient of determination, R. This work is only based on a single variable (water or sucrose content). These two substances are commonly found in the market and impose a huge impact on the honey industry. Hence, this work was limited to single variable (either water content or sucrose content). The multivariable regression analysis is conducted in future work.
In overall, high R2 indicates a good agreement between the calculation (mathematical model) and measurement in term of reflection coefficient. In addition, wc and sc can be predicted accurately through and using these developed models. The developed FPR can provides an accurate water and sucrose content prediction for both honeys. The FPR is able to identify pure and adulterated honey through the investigation of water and sucrose content. A similar approach can be extended for other sample of interest which has similar characteristics to Honey Gold and Trigona Honey.
ACKNOWLEDGMENT
The author would like to acknowledge the support from the UniPRIMA under a grant number of 9001-00710 & 9002-00146 from the Ministry of Higher Education Malaysia.
REFERENCES
[1] E. Anklam, “A review of the analytical methods to determine geographical and botanical origin of honey,” Food Chem., vol. 63, no. 4, pp. 549-562, 1998.
[2] L. Vandamme, A. Heyneman, H. Hoeksema, J. Verbelen, and S. Monstrey, “Honey in modern wound care: A systematic review,” Burns, vol. 39, no. 8, pp. 1514-1525, 2013.
[3] M. Moniruzzaman, S. A. Sulaiman, I. Khalil, and S. H. Gan, “Evaluation of physiochemical and antioxidant properties of sourwood and other Malaysian honeys: A comparison with Manuka honey,” Chem. Cent. J., vol. 7, no. 1, pp. 1-12, 2013.
[4] E. Diacu and E. F. “Tantaveanu, determination of moisture content and its correlation with other parameters in honey quality control,” Revista de Chimie, vol. 58, no. 12, pp. 1311-1312, 2007.
[5] A. I. Ruiz-Matute, M. Brokl, A. C. Soria, and I. Martínez-Castro, “Gas chromatographic-mass spectrometric characterization of tri- and tetrasaccharidesin honey,” Food Chem., vol. 120, no. 2, pp. 637-642, 2010.
[6] M. Tahsin, N. Berna, O. Said, S. Karaman, E. Dertli, O. Sagdic, and M. Arici, “Steady, dynamic and creep rheological analysis as a novel approach to detect honey adulteration by fructose and saccharose syrups: Correlations with HPLC-RID results,” Food Res. Int., vol. 64, pp. 634-646, 2014.
[7] A. I. Cabañero, J. L. Recio, and M. Rupérez, “Liquid chromatography coupled to isotope ratio mass spectrometry: A new perspective on honey adulteration detection,” J. Agric. Food Chem., vol. 54, no. 26, pp. 9719-9727, 2006.
[8] C. Y. Lee, K. Y. You, T. S. Tan, Y. L. Then, Y. S. Lee, L. Zahid, W. L. Lim, and C. H. Lee, “Enhanced five-port ring circuit reflectometer for synthetic breast tissue dielectric determination,” Prog. Electromagn. Res. C, vol. 69, pp. 83-95, 2016.
[9] J. Ahmed, S. T. Prabhu, G. S. V. Raghavan, and M. Ngadi, “Physico-chemical, rheological, calorimetric and dielectric behaviour of selected Indian honey,” J. Food Eng., vol. 79, no. 4, pp. 1207-1213, 2007.
[10] F. Içier and T. Baysal, “Dielectrical properties of food materials-1: Factors affecting and industrial uses,” Crit. Rev Food Sci. Nutr., vol. 44, no. 6, pp. 465-471, 2004.
[11] H. Cong, F. Liu, Z. Tang, and C. Xue, “Dielectric properties of sea cucumbers (Stichopus japonicus ) and model foods at 915 MHz,” J. Food Eng., vol. 109, no. 3, pp. 635-639, 2012.
[12] N. Bansal, A. S. Dhaliwal, and K. S. Mann, “Dielectric properties of corn flour from 0.2 to 10 GHz,” J. Food Eng., vol. 166, pp. 255-262, 2015.
[13] S. Zhang, L. Zhou, B. Ling, and S. Wang, “Dielectric properties of peanut kernels associated with microwave and radio frequency drying,” Biosyst. Eng., vol. 145, pp. 108-117, 2016.
[14] E. M. Cheng, Z. Abbas, M. F. AbdulMalek, K. Y. Lee, K. Y. You, S. F. Khor. J. Hassan, and H. Zainuddin, “Finite difference analysis of an open-ended, coaxial sensor made of semi-rigid coaxial cable for determination of moisture in Tenera oil palm fruit,” Applied Computational Electromagnetics Society (ACES) Journal, vol. 31, no. 10, pp. 1181-1192, 2016.
[15] E. M. Cheng, Z. Abbas, M. F. AbdulMalek, K. Y. You, K. Y. Lee, S. F. Khor, N. F. Mohd Nasir, M. S. Abdul Majid, and S. F. Khor, “Effect of aspect ratio and frequency of an open-ended, coaxial line on admittance for determination of moisture in Tenera oil palm fruit using finite difference method,” Applied Computational Electromagnetics Society (ACES) Journal, vol. 33, no. 11, pp. 1308-1318, 2018.
[16] P. Ferrazzoli, L. Guerriero, and D. Solimini, “Numerical model of microwave backscattering and emission from terrain covered with vegetation,” Applied Computational Electromagnetics Society (ACES) Journal, vol. 6, no. 1, pp. 175-191,1991.
[17] D. T. Le and B. Bisceglia, “Specific absorption rate for agri-food materials from multiple antenna exposure,” Applied Computational Electromagnetics Society (ACES) Journal, vol. 1, no. 2, pp. 68-71, 2016.
[18] S. A. Galema, “Microwave chemistry,” Chem. Soc. Rev., vol. 26, no. 3, pp. 233-238, 1997.
[19] G. F. Engen, “An improved circuit for implementing the six-port technique of microwave measurement,” IEEE Trans. Microw. Theory Tech., vol. 25, no. 12, pp. 1080-1083, 1977.
[20] G. P. Riblet and E. R. B. Hansson, “An ideal six-port network consisting of a matched reciprocal lossless five-port and a perfect directional coupler,” IEEE Trans. Microw. Theory Tech., vol. 83, no. 3, pp. 284-288, 1983.
[21] K. Y. Lee, B. K. Chung, K. Y. You, E. M. Cheng, and Z. Abbas, “Development of a symmetric ring junction as four-port reflectometer for complex reflection coefficient measurements,” Radioengineering, vol. 24, no. 4, pp. 906-911, 2015.
[22] Q. Zhan, Y. Wang, Y. Fang, Q. Ren, S. Yang, W. Yin, and Q. H. Liu, “An adaptive high-order transient algorithm to solve large-scale anisotropic Maxwell’s equations,” IEEE Trans. Antennas Propagat., vol. 70, no. 3, pp. 2082-2092,2021.
[23] Q. Zhan, Y. Fang, M. Zhuang, M. Yuan, and Q. H. Liu, “Stabilized DG-PSTD method with nonconformal meshes for electromagnetic waves,” IEEE Trans. Antennas Propagat., vol. 68, no. 6, pp. 4714-4726, 2020.
[24] J. Y. Ahn, D. Y. Kil, C. Kong, and B. Kim, “Comparison of oven-drying methods for determination of moisture content in feed ingredients,” Asian Australasian J. Animal Sci., vol. 27, no. 11, pp. 1615-1622, 2014.
[25] W. Guo, X. Zhu, Y. Liu, and H. Zhuang, “Sugar and water contents of honey with dielectric property sensing,” J. Food Eng., vol. 97, no. 2, pp. 275-281, 2010.
[26] W. Guo, Y. Liu, X. Zhu, and S. Wang, “Dielectric properties of honey adulterated with sucrose syrup,” J. Food Eng., vol. 107, no. 1, pp. 1-7, 2011.
[27] S. Aishah, “Development of pure and adulterated honey measurement system using multiple frequencies six-port reflectometer (SPR),” MSc dissertation, Sch. Mechatron. Eng. Univ. Malaysia Perlis, Perlis, Malaysia, 2017.
[28] S. P. Kek, N. L. Chin, S. W. Tan, and Y. A. Yusof, “Classification of honey from its bee origin via chemical profiles and mineral content,” Food Anal. Methods, vol. 10, pp. 19-30, 2017.
[29] S. Ueno, Biological Effects of Magnetic and Electromagnetic Fields. Springer, New York, NY, 1996.
[30] G. Jose, A. Carolina, and D. Erik, “Acute effect of meal glycemic index and glycemix load on blood glucose and insulin responses in humans,” Nutr. J., vol. 22, no. 5, pp. 1-7, 2006.
[31] M. Kumar and R. Gupta, Diamagnetic Susceptibility of Organic Compounds, Oils, Paraffins and Polyethylenes. Berlin Heidelberg: Springer-Verlag, 2008.
BIOGRAPHIES

Lee Kim Yee was born in 1978. He received his BSc Physics, Master and PhD degree from the Universiti Putra Malaysia (stocktickerUPM) in the year 2002, 2004 and 2008 respectively. He joined the Lee Kong Chian Faculty of Engineering and Science, Universiti Tunku Abdul Rahman (UTAR) in 2007. He is currently an associate professor under Department of Electrical and Electronic Engineering. His research interests include microwave measurement technique, microwave circuit and instrumentation, dielectric measurement, and RFID.

Shahriman Abu Bakar is an Assoc Prof in Faculty of Mechanical Engineering Technology In Universiti Malaysia Perlis. He is currently the head of Centre of Excellence in Automotive and Motorsport. He obtained his degree in Mechanical engineering in 1997, Master in Mechanical Engineering in 2006 and Phd in System Design in 2010 all from Mie University Japan. He holds 2 patents and filed for 6 patents in transportation systems. His research interest is in automotive systems for vehicles, mobility as a service, next generation vehicles and agriculture industries. He published more than 240 articles and conference proceedings. He is a professional engineer (Board of engineer Malaysia) and professional technologist (MBOT Malaysia).

Shing Fhan Khor was born in 1982. She obtained her B.Sc. with Edu. (Honours) - Physics in Universiti Putra Malaysia in 2007. She pursued her Ph.D. in Materials Science at the Faculty of Science in 2011 at Universiti Putra Malaysia. Recently, she is an associate professor at Faculty of Electrical Engineering Technology, Universiti Malaysia Perlis (UniMAP). Her main personal research interest is in the glass science and focusing on dielectric, optical, mechanical and thermal properties.

Cheng Ee Meng was born in 1980. He obtained his B.Sc (Honours) - Instrumentation Science in Universiti Putra Malaysia in 2004. He pursued his M.Sc. in Wave Propagation at the Institute for Mathematical Research on 2005 in Universiti Putra Malaysia and his Ph.D. in Microwave at the Faculty of Science, Universiti Putra Malaysia in 2007. Recently, he is an associate professor in Faculty of Electronic Engineering Technology, Universiti Malaysia Perlis. His main personnel research interest is in the computational electromagnetic modeling, microwave dielectric spectroscopy, wave propagation in RF & microwave and microwave sensors development for food and agricultural applications. On the other hand, he is also a Chartered Engineer (Engineering Council, UK) and Professional Technologist (MBOT, Malaysia). He also published more than 100 journals and conference proceedings (ISI/Scopus).

Nashrul Fazli Mohd Nasir received his Bachelor Degree in Biomedical Engineering from Universiti Malaya and later pursued his M.Sc. in Biomedical Engineering at Keele University (UK). He later received his Ph.D. in Electrical Engineering and Computer Engineering from Royal Melbourne Institution of Technology (RMIT) University, Australia. His research interests are in Biomaterials, Biosensors and Material Characterization in Biomedical Engineering. Currently, he is the associate professor in Faculty of Electronic Engineering Technology, Universiti Malaysia Perlis.

Siti Aishah Baharuddin is a full time PhD student in Faculty of Engineering, Universiti Putra Malaysia (UPM) in Food Engineering field. Her doctoral research is to develop functional food from medicinal plants for Colorectal Cancer (CRC) prevention. Her research is conducted under collaboration with Osaka University of Pharmaceutical Sciences, Japan. On top of this, her research work has given her in-depth understanding and knowledge in food processing, food powder technology, and physicochemical properties of food.

Che Wan Sharifah Robiah Mohamad was born in 1978. He obtained his B.Sc. (Honours) - Microbiology in Universiti Sains Malaysia in 2001. She pursued her M.Sc. in Microbiology (Bacteriology) at School of Biological Sciences on 2006 in Universiti Sains Malaysia and his Ph.D. in Biotechnology Microbe in 2006 in Universiti Sains Malaysia. Recently, she is a senior lecturer in Faculty of Electronic Engineering Technology, Universiti Malaysia Perlis. Her main personnel research interest is in the antimicrobial study, biomaterial and tissue engineering for medical and pharmaceutical applications. On the other hand, she is also a Professional Technologist (MBOT, Malaysia).

Emma Ziezie Mohd Tarmizi received her Bsc (Hons) (Material Science), MSc (Dielectric Physics) and PhD (Material Science) from the Universiti Putra Malaysia. She took a keen interest in education and currently serving as a Senior lecturer and Coordinator for Physics (foundation) at the Centre of Foundation Studies For Agricultural Science, Universiti Putra Malaysia. Emma’s research focuses on the various electrical, thermal and optical properties of materials including glasses, polymers and conducting polymers for diverse of applications including laser, fuel cell and solar cell. She currently aims at studying the fundamental aspects of broad range of advanced materials, designing and synthesizing functional materials for biomedical and biological applications which may crosses many disciplines including physics, chemistry, biological, medical and engineering technology.
ACES JOURNAL, Vol. 37, No. 7, 782–794.
doi: 10.13052/2022.ACES.J.370705
© 2022 River Publishers