Research on the Model and Transient Characteristics of the Pantograph-Catenary Arc in Different Sections of Power Supply Lines
Yutao Tang, Fei Li, Chao Zhou, Yulin Wang, and Feng Zhu
1Institute of Electronic and Electrical Engineering
Civil Aviation Flight University of China, Guanghan, 618307, China
835578907@qq.com, zc_cafuc@163.com
2Sichuan Province Engineering Technology Research Center of General Aircraft Maintenance
Civil Aviation Flight University of China, Guanghan, 618307, China
88604045@qq.com, minest@aliyun.com
3School of Electrical Engineering
Southwest Jiaotong University, Chengdu, 610031, China
zhufeng@swjtu.edu.cn
Submitted On: April 20, 2022; Accepted On: July 9, 2022
ABSTRACT
During the operation of high-speed trains, the pantograph will inevitably have occasional and instantaneous separations from the power supply line, resulting in the pantograph catenary arc (PCA). The diverse states of PCA generated in different sections of the power supply line will lead to various electromagnetic interference (EMI). To study the transient characteristics of PCA, firstly, the voltage and the dissipative power of PCA at the common and neutral sections of the power supply line are analyzed and calculated respectively. Secondly, two PCA models that describe the different PCA states are established based on the improved Habedank arc model. Finally, the high-frequency transient voltage and current of the PCA when high-speed trains pass through the common and neutral sections at different speeds are obtained by simulation. In this paper, we comprehensively study the model and the transient characteristics of PCA, which provides a theoretical basis and relevant data for further study of its EMI.
Index Terms: arc model, dissipative power of arc, electromagnetic interference, pantograph-catenary arc.
I. INTRODUCTION
The electromagnetic interference (EMI) produced by the pantograph catenary arc (PCA) of high-speed trains not only affects the surrounding electromagnetic signal, such as communication and navigation signals of airports [1–3] but also impacts the electronic equipment of high-speed trains, such as speed sensors [4–6]. Therefore, it is significant to study the characteristics of PCA. However, the existing research on the model and the characteristics of PCA is not comprehensive.
Some researchers proposed an aerial catenary nonuniform transmission line model to predict the longitudinal propagation characteristic of PCA [7]. The characteristics of the instantaneous voltage and current of PCA were studied based on the improved Habedank arc model in Ref. [8, 9]. The electromagnetic radiation (EMR) from the PCA of the subway has been measured and analyzed in [10]. Scholars further analyzed the relationship between the EMI of PCA and train speed [11]. Furthermore, S. Barmada and his research team have conducted in-depth research on arc detection in real-time Railway applications. They proposed an arc detection method based on a support vector machine, which can detect and locate the arc with great accuracy and obtain useful information on the pantograph/catenary state [12–14]. Their research results can provide a reference for further study on the characteristics of PCA. However, in the existing research, many studies did not take into account the different locations and states of PCA.
As an extension of previous works, firstly, the different states of PCA generated at two typical positions of the power supply line–common and neutral sections are analyzed. Secondly, the voltages and the dissipative powers of PCA in two different states are calculated respectively, which are used to modify the Habedank arc model. Thirdly, the PCA models at the common and neutral sections are established respectively based on the improved Habedank arc model. Finally, the transient voltage and current of the two kinds of PCA are obtained by simulation, and their transient characteristics are analyzed. The research results of this paper can provide a theoretical basis for the comprehensive study of the EMI and EMR caused by PCA.
II. ANALYSIS OF THE STATES OF PCA
A. Formation process of the PCA
High-speed trains get electric power by connecting their pantograph to the power supply line. It can be seen from Fig. 1 that the pantograph has occasional and instantaneous separations from the power supply line during the running of a high-speed train. The high voltage between them is enough to spark the air in the gap, resulting in discharge. Besides, the arc root of the PCA moves forward with the train on the power supply line, which will lengthen the PCA, reduce its radius and increase its resistance. As the train continues to move forward, the length of PCA becomes longer. When the energy absorbed by the PCA cannot meet the energy consumed, the arc will be extinguished.
Figure 1: Simplified process of the PCA formation.
B. States of the PCA at the common and neutral sections
The reason for generating the PCA at the common sections is that there are some fixed hard points on the power supply line and the vibration of the pantograph. At this time, the separation distance between the pantograph and the power supply line is short. Therefore, it can be assumed that the PCA generated here is perpendicular to the horizontal plane of the train roof. Namely, the arc length of PCA at the common section () is approximately equal to the separation distance (), as shown in Fig. 2.
Figure 2: Diagram of the PCA generated at the common section.
The reason for generating the PCA at the neutral sections is that the pantograph needs to be separated from the original power supply line and entered into the neutral line to realize the voltage phase conversion, as shown in Fig. 3.
Figure 3: Diagram of the train passing through the neutral section.
At this time, the ds is long and the angle between the PCA and the horizontal plane of the train roof cannot be ignored, as shown in Fig. 4.
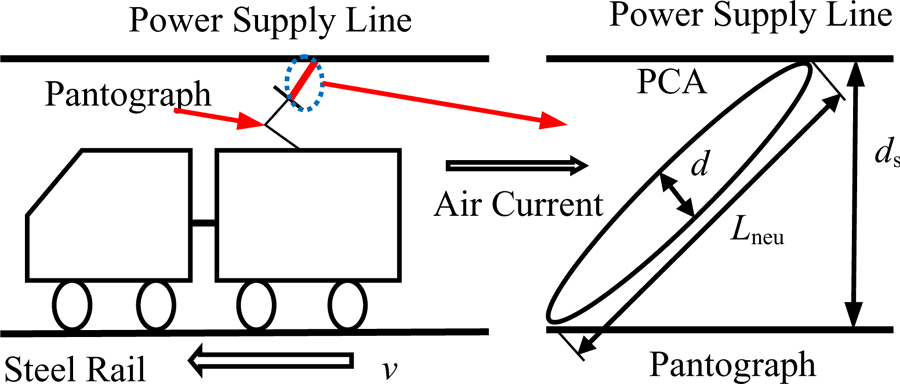
Figure 4: Diagram of the PCA generated at the neutral section.
III. CALCULATION OF THE ELECTRICAL PARAMETERS OF PCA
The characteristics of an arc are related to the length, diameter, voltage, current, and dissipative power of the arc. Among them, dissipative power includes three parts: conducted power, convective power, and radiated power. Because the PCA is affected by transverse or longitudinal arc blowing, it carries out convective heat dissipation. Therefore, the conducted power can be completely ignored. Besides, the convective power generally accounts for more than 80% of the dissipative power, which is the main way of PCA heat dissipation [15].
The convective power can be obtained by:
| (1) |
where is the convective power, and are the convective power generated by the transverse arc blowing and the longitudinal arc blowing respectively.
Because the states of PCA generated at the common and neutral sections are different, the will be different at those two sections. Therefore, it needs to be studied separately.
A. Electrical parameters of the PCA at the common section
The PCA at the common section is almost vertical, as shown in Fig. 2. Therefore, only convective power generated by transverse arc blowing exists. Refs. [16] and [17] give the calculation methods of the convective power per unit length generated by a transverse blowing arc () and the diameter of arc (). To facilitate the subsequent comparison with the measured data, the unit of speed is converted from m/s to km/h. So the and d can be derived by:
| (2) |
| (3) |
where is the moving speed of the arc, which unit is km/h; is the current of PCA.
The can be calculated by Eqs. (2) and (3):
| (4) |
The separation distance between the pantograph and the power supply line can be got by [8]:
| (5) |
where is the separation distance, and which unit is mm.
As shown in Fig. 2, the arc length of PCA at the common section and are equal. According to Eqs. (1), (4), (5), the convective power of PCA at the common sections can be obtained by :
| (6) | |||
Based on Eq. (6), it can be deduced that the dissipative power of PCA at the common section is:
| (7) | |||
According to [8], when PCA is in a stable state, there is a 15 times relationship between its voltage and length. Thus, based on Eq. (5), the voltage of PCA at the common section can be expressed as:
| (8) | |||
where and are the voltage and length of PCA at the common section respectively.
B. Electrical parameters of the PCA at the neutral section
As for the PCA at the neutral section, is longer and not equal to of the PCA at the neutral section (). Thus, both and exist because the PCA has an angle with the horizontal plane as shown in Fig. 4. At this time, the will be elongated because of the multiple external forces, and its stress diagram is shown in Fig. 5. Where is the wind load force, and the direction is opposite to the running direction of the train; is the thermal buoyancy force, and the direction is vertical and upward; is the magnetic force, and the direction is related to the direction of the magnetic field.
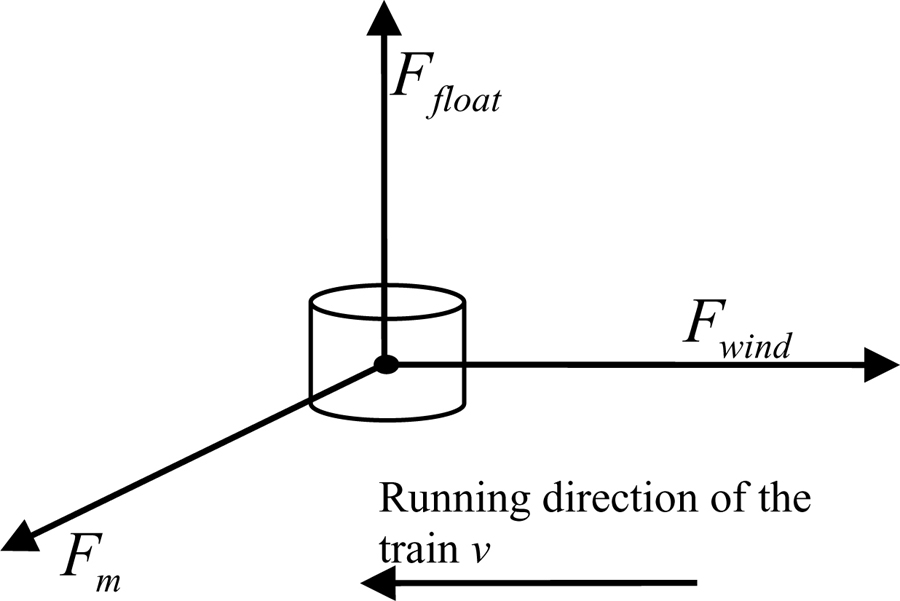
Figure 5: Force diagram of the PCA under the multiple external forces.
It is assumed that the PCA moves at a uniform speed in a short time, and the mass density of the PCA is very small at high temperatures. So its mass can be ignored. Therefore, the resultant force on the PCA is:
| (9) |
where:
| (10) |
where , , and B are the length, current vector, and magnetic induction intensity of the arc microelement.
The PCA can be regarded as a chain model connected by many cylindrical current elements. Therefore, can be refined into the magnetic field force on each current element. The model of the cylindrical current element is shown in Fig. 6.
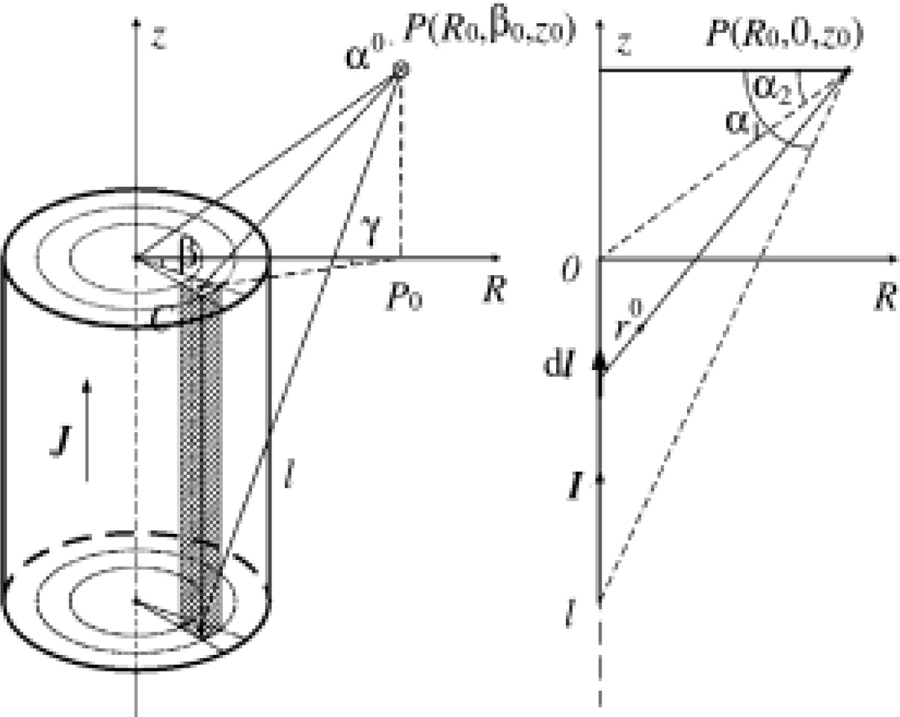
Figure 6: Magnetic field calculation model of cylinder current element.
Based on the Biot-Savart Law, the magnetic induction intensity generated by current J in the current element at P is:
| (11) |
According to the arc chain model and Eq. (11), it can be deduced that the magnetic induction intensity generated by the cylindrical current element at P is:
| markedasmathB | (12) | ||
The sum integral of the magnetic field generated by the current loop flowing through the arc is calculated by Eq. (12). Then, the comprehensive magnetic field at the gravity center of each arc current element can be obtained by coordinate transformation [18].
The values of other relevant parameters in Eq. (10) are shown in Table 1.
Table 1: Relevant parameters of the force calculation of arc microelement [19]
| Name | Value | Name | Value | ||
| Coefficient of wind pressure height variation | 1.17 | Air density in high temperature of arc area | 1.295 | ||
| Coefficient of wind load shape | 0.76 | Arc radius | 0.0013 mm | ||
| Coefficient of uneven wind pressure | 0.67 | wind speed | Equal to the train speed | ||
| Air density | 0.022 | Gravitational acceleration | 9.8 |
Assuming that is 5 mm, the initial length of PCA is equal to . The length change of PCA caused by the external force can be obtained by simulation, as shown in Fig. 7.

Figure 7: Diagram of the change caused by the external force.
The simulation results show that the length of PCA increases with the arcing time, and the maximum of is about 8.4 mm. Therefore, is about 1.68 times that of . The can be derived by Eq. (5):
| (13) |
The per unit length of the PCA () can be expressed as [16]:
| (14) |
where is produced by heating air from temperature to the average temperature of the arc . and are 4000 K and 9500 K respectively. C is the heat capacity coefficient of air, and C is [20]:
| (15) |
The can be derived by Eqs. (3), (14), and (15):
| (16) |
The convective power of the PCA at neutral sections () can be obtained by Eqs. (1), (4), (13), and (16):
| (17) | |||
It is similar to the above, the dissipative power () and the arc voltage () of the PCA at the neutral section is:
| (18) |
and:
| (19) |
IV. MODELING AND SIMULATION OF THE PCA
A. Establishment of the PCA model
The Habedank model is the classical arc model, and its equation is:
| (20) |
where and are the arc conductance/time constant of the Cassie and Mayr arc model respectively.
Besides, and are the voltage and the dissipative power of the arc, and they are assumed to be constants in this model.
However, it can be seen from the above research that and are not constants in practice. Therefore, it is necessary to modify the Habedank arc model to make it conform to the actual situation of PCA. Besides, it also needs to distinguish the different states of PCA at the common and neutral sections.
According to Eqs. (7), (8), and (18-20), the arc models of PCA generated by the high-speed train passing through common and neutral sections are:
| (21) |
and:
B. Transient characteristics of the PCA
The transient voltage and current of PCA can be simulated and calculated by Eqs. (21) and (22).
Because the distance from the traction substation to the nearest neutral section is 25 km, it can be assumed that the PCA occurs in the middle of them. Namely, the distance between PCA and the traction substation is 12.5 km. The characteristic curves of the transient voltage and current of PCA when the train passes through this position at 80 km/h, 150 km/h, and 250 km/h are calculated by simulation, as shown in Fig. 8.

Figure 8: Transient characteristic curve of the PCA at the common section.
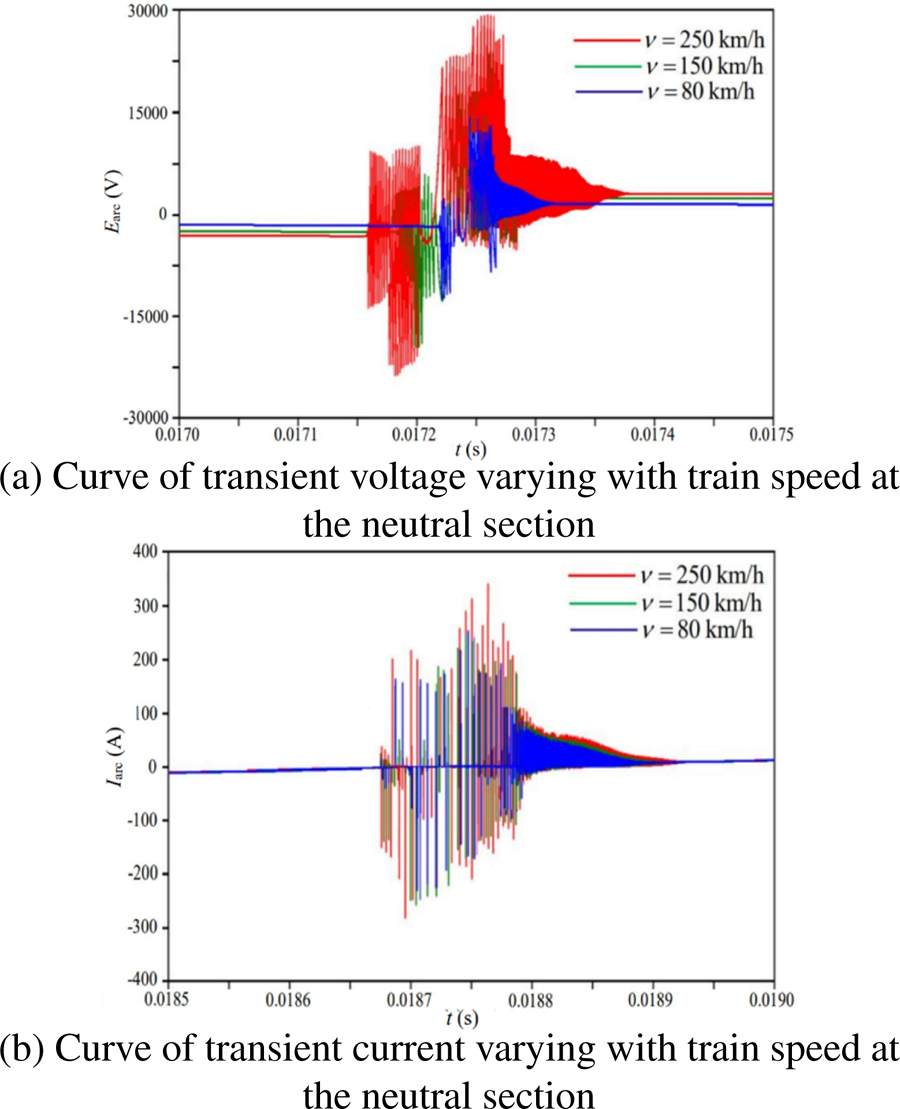
Figure 9: Transient characteristic curve of the PCA at the neutral section.
Similarly, the characteristic curves of the transient voltage and current of PCA when the train passes through the neutral section at 80 km/h, 150 km/h, and 250km/h are shown in Fig. 9.
As shown in Figs. 8 and 9, the EMI radiated by the PCA will produce strong voltage and current pulses. At the common section, the maximum transient voltage pulse is about 19000 V (=250 km/h), and the maximum transient current pulse is nearly 170 A. At the neutral section, they are approximately 29000 V and 350 A respectively (=250 km/h).
C. Experimental validation
The PCA Test System is used to measure the electrical characteristics of PCA. It is composed of a PCA generator and test system, as shown in Fig. 10. Where the variable frequency motor is used to drive the wheel to rotate to simulate the mutual movement of the power supply line and the pantograph, and the arrow direction indicates the moving direction. Besides, the servo motor and roller screw drive are used to simulate the movement of the pantograph [21].

Figure 10: The PCA Test System.
The voltage and current of PCA are measured by using the PCA Test System (=250 km/h). Therefore, the wheel speed is set to 250 km/h, and the voltage and current of PCA are shown in Fig. 11.
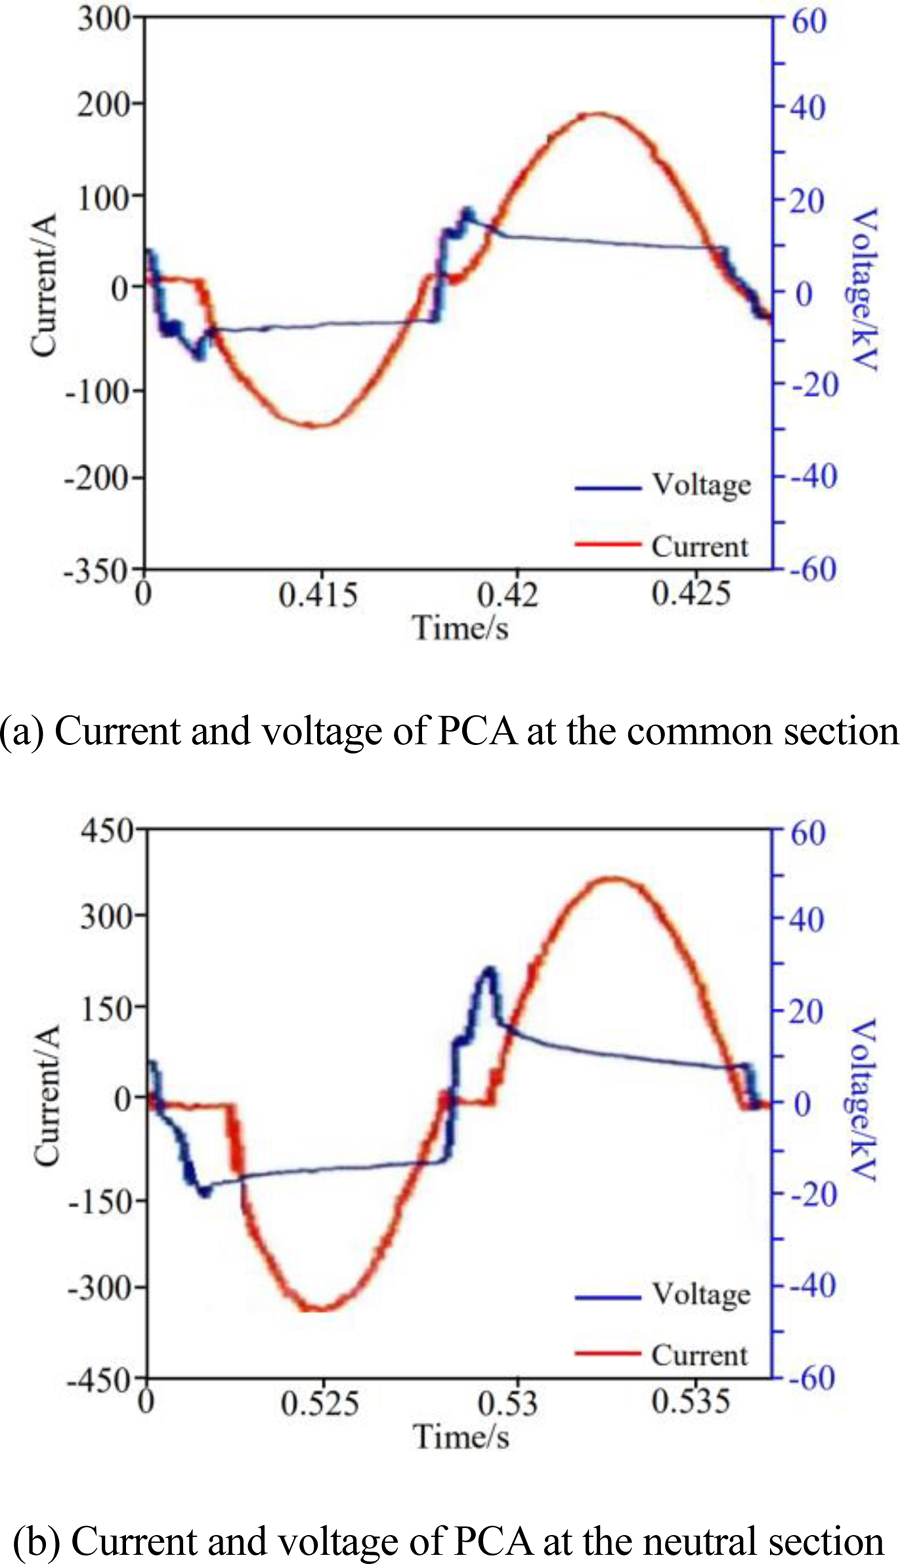
Figure 11: Test results of electrical characteristics of PCA.
The test results show that the maximum voltage is about 19.5 kV and the maximum current is nearly 185 A at the common section. While they are approximately 29.6 kV and 355 A respectively at the neutral section. The test results are consistent with the simulation results, so the above PCA models are correct.
V. CONCLUSION
The models and transient characteristics of PCA at the common and neutral sections are studied in this paper. The conclusions are as follows:
1) The PCA at common and neutral sections have different models because of their different states.
2) The EMI of PCA at the neutral section is more serious than that at the common section, which is reflected in the obvious increase of the peak value and high-frequency component of the transient voltage and current.
3) The peak and high-frequency component of the transient voltage and current will increase significantly with the train speed, which will increase the radiation intensity of PCA. Therefore, the faster the train speed, the more serious the EMI of PCA.
4) The main reason why the train speed affects the characteristics of PCA is that the speed will cause the change of arc length, and then affect the voltage and the dissipative power of PCA.
To summarize, the EMI intensity of PCA will vary with the change of arc position and train speed, which can provide a research basis for the protection of the EMI of high-speed trains.
ACKNOWLEDGMENT
The authors would like to thank the editors and anonymous reviewers for their insightful comments. This paper is supported by the National Key R&D Program of China (No. 2018YFC0809500), the Special Scientific Research Project of CAFUC (ZX2021-03), and the Independent Project of Key Laboratory of Civil Aviation Flight Technology and Safety (FZ2021ZZ03).
REFERENCES
[1] Y. Tang, F. Zhu, and Y. Chen, “For more reliable aviation navigation: improving the existing assessment of airport electromagnetic environment,” IEEE Instrumentation & Measurement Magazine, vol. 24, no. 4, pp. 104-112,2021.
[2] F. Zhu, C. Gao, and Y. Tang, “Influence of pantograph-catenary arc on electromagnetic disturbance of airport terminal omnidirectional beacon,” China Railway Science, vol. 39, no. 1, pp. 116-121, 2018.
[3] J. Gou, F. Zhu, J. Zou, J. Ye, H. Li, and Y. Wang, “Research on EMI of instrument landing system on aircraft caused by pantograph arc,” Journal of the China Railway Society, vol. 40, no. 7, pp. 61-66, 2018.
[4] Y. Tang, F. Zhu, and Y. Chen, “For safer high-speed trains: a comprehensive research method of electromagnetic interference on speed sensors,” IEEE Instrumentation & Measurement Magazine, vol. 24, no. 4, pp. 96-103, 2021.
[5] Y. Tang, F. Zhu, and Y. Chen, “Analysis of EMI from pantograph-catenary arc on speed sensor based on the high-speed train model,” Applied Computational Electromagnetics Society (ACES) Journal, vol. 36, no. 2, pp. 205-212, 2021.
[6] F. Zhu, Y. Tang, and C. Gao, “Mechanism and suppression of electromagnetic interference of pantograph-catenary arc to speed sensor of CRH380BL electric multiple unit,” China Railway Science, vol. 37, no. 6, pp. 69-74, 2016.
[7] X. Li, F. Zhu, H. Lu, R. Qiu, and Y. Tang, “Longitudinal propagation characteristic of pantograph arcing electromagnetic emission with high-speed train passing the articulated neutral section,” IEEE Trans. Electromagn. Compat., vol. 61, no. 2, pp. 319-326, 2018.
[8] Y. Wang, Z. Liu, X. Mu, K. Huang, H. Wang, and S. Gao, “An extended Habedank’s equation-based emtp model of pantograph arcing considering pantograph-catenary interactions and train speeds,” IEEE Transactions on Power Delivery, vol. 31, no. 3, pp. 1186-1194, 2016.
[9] F. Fan, “Study on separation between the pantograph and catenary based on improved habedank arc model,” M.S. Thesis, Southwest Jiaotong University, Chengdu, China, 2011.
[10] X. Li, F. Zhu, R. Qiu, and Y. Tang, “Research on influence of metro pantograph arc on airport navigation system,” Journal of the China Railway Society, vol. 40, no. 5, pp. 97-102, 2018.
[11] Y. Tang, F. Zhu, and Y. Chen, “Research on the influence of train speed change on the EMI of pantograph-catenary arc to main navigation stations,” Applied Computational Electromagnetics Society (ACES) Journal, vol. 36, no. 4, pp. 450-457, 2021.
[12] I. Aydin, S. Celebi, S. Barmada, and M. Tucci, “Fuzzy integral-based multi-sensor fusion for arc detection in the pantograph-catenary system,” Proceedings of the Institution of Mechanical Engineers Part F: Journal of Rail & Rapid Transit, vol. 232, no. 1, pp. 159-170, 2018.
[13] S. Barmada, M. Tucci, M. Menci, and F. Romano, “Clustering techniques applied to a high-speed train pantograph–catenary subsystem for electric arc detection and classification,” Proceedings of the Institution of Mechanical Engineers Part F: Journal of Rail & Rapid Transit, vol. 230, no. 1, pp. 85-96, 2016.
[14] S. Barmada, M. Raugi, M. Tucci, and F. Romano, “Arc detection in pantograph-catenary systems by the use of support vector machines-based classification,” IET Electrical Systems in Transportation, vol. 4, no. 2, pp. 45-52, 2014.
[15] S. Midya, D. Bormann, T. Schutte, and R. Thottappillil, “Pantograph arcing in electrified railways–mechanism and influence of various parameters–part II: with AC traction power supply,” IEEE Trans. on Power Del., vol. 24, no. 4, pp. 1940-1950, 2009.
[16] G. Gao, T. Zhang, W. Wei, Y. Hu, G. Wu, and N. Zhou, “A pantograph arcing model for electrified railways with different speeds,” Proceedings of the Institution of Mechanical Engineers Part F: Journal of Rail & Rapid Transit, vol. 232, no. 6, pp. 1-10, 2018.
[17] Y. Liu, G. Chang, and H. Huang, “Mayr’s equation-based model for pantograph arc of high-speed railway traction system,” IEEE Trans. on Power Del., vol. 25, no. 3, pp. 2025-2027, 2010.
[18] S. Gu, J. He, W. Chen, and G. Xu, “Magnetic force computation for the electric arc of parallel gap lightning protection device on overhead transmissionlines,” Proceedings of the CSEE, vol. 26, no. 7, pp. 140-145, 2006.
[19] C. Chen, “Research on arc model of articulated phase insulator and laws of arc motion development in high speed railway,” M.S. Thesis, Southwest Jiaotong University, Chengdu, China, 2016.
[20] S. Li, X. Jin, and H. Bi, “Numerical calculation on very fast transient overvoltage of UHV gas insulated substation by variable gap arc model,” High Voltage Engineering, vol. 41, no. 4, pp. 1306-1312, 2015.
[21] W. Wang, G. Wu, G. Gao, B. Wang, Y. Cui, and D. Liu, “The pantograph-catenary arc test system for high-speed railways,” Journal of The China Railway Society, vol. 34, no. 4, pp. 22-27, 2012.
BIOGRAPHIES

Yutao Tang was born in Sichuan Province, China, in 1991. She received her B.S. degree in Automation from Southwest Science and Technology University, Mianyang, China, in 2013, and her Ph.D. degree in Electrical Engineering at Southwest Jiaotong University, Chengdu, China, in 2021.
She is currently a Lecturer at the Institute of Electronic and Electrical Engineering, Civil Aviation Flight University of China. Her research interests include electromagnetic environment testing and evaluation, and electromagnetic compatibility analysis and design.

Fei Li was born in Hubei Province, China, in 1983. He received a master’s degree in Engineering Mechanics from Nanjing University of Aeronautics and Astronautics, China, in 2009.
He is currently an engineer in the Aircraft Repair & Overhaul Plant Subsidiary of the Civil Aviation Flight University of China. His research fields include aircraft maintenance and airworthiness.

Chao Zhou was born in Anhui, Province, China, in 1980. He received his M.S. degree from South West Jiaotong University in 2002 and his Ph.D. degree from the University of Electronic Science and Technology of China in 2013, respectively.
He is working at the Civil Aviation Flight University of China, where he is currently a professor, deputy dean of the Institute of Electronic and Electrical Engineering, master tutor, and head of the UAV team. His current research interests include civil unmanned aerial vehicles and civil aviation electromagnetic environmenteffects.

Yulin Wang was born in Jiangxi Province, China, in 1986. He received a master’s degree in Mechanical Design and Theory from Sichuan University, China, in 2011.
He is currently a senior engineer in the Aircraft Repair & Overhaul Plant Subsidiary of the Civil Aviation Flight University of China. His research fields include aircraft maintenance and airworthiness.

Feng Zhu was born in Anhui Province, China, in 1963. He received a B.S. degree in Physics from Huaibei Normal University, Huaibei, China, in 1984, an M.S. degree in Physics from Sichuan University, Chengdu, China, in 1987, and a Ph.D. degree in Electromagnetic Theory and Microwave Techniques from Southwest Jiaotong University, Chengdu, in 1997.
He is currently a Professor in the Department of Electrical Engineering, Southwest Jiaotong University. His research interests include electromagnetic environment test and evaluation, electromagnetic compatibility, and numerical electromagnetic methods.
ACES JOURNAL, Vol. 38, No. 2, 109–116
doi: 10.13052/2023.ACES.J.380205
© 2023 River Publishers