Research on OTA Testing Optimization of 5G IoT Devices
Xiaochen Chen, Xianhui Liu, and Siyang Sun
China Telecommunication Technology Labs
China Academy of Information and Communications Technology, Beijing, 100191, China
sunsiyang@caict.ac.cn
Submitted On: May 6, 2022; Accepted On: September 12, 2022
ABSTRACT
Over-the-air (OTA) testing for wireless devices is crucial to guarantee actual network performance. Current OTA testing requires respectively 266 and 62 grid points for Total Radiated Power (TRP) and Total Isotropic Sensitivity (TIS) measurement. For 5G Internet of Things (IoT) devices, especially for low transmit duty-cycle devices, this number of grid points could lead to an unacceptably large amount of test time. Therefore, test time reduction is significant. The objective of this paper is to determine a suitable measurement grid for OTA testing of 5G IoT devices which balances measurement grid uncertainty/errors with test time. Two reference patterns representing a reasonable worst-case scenario of IoT devices are proposed for measurement uncertainty (MU) analysis of different grid configurations. The effects of different grid configurations on OTA testing accuracy are evaluated. The determination of associated MU term is proposed and determined based on statistical analysis. Finally, the reduction of grid points from currently required 62 (30/30 in theta/phi) to 32 (45/36) could save roughly 50% test time while requiring an uncertainty increase of less than 0.2 dB, which is acceptable for OTA testing of 5G IoT devices.
Index Terms: 5G IoT, measurement grid, MU analysis, over-the-air (OTA) testing.
I. INTRODUCTION
The Internet of Things (IoT) has become the main force driving evolution of mobile communications towards 2020 and beyond, and will penetrate into all industries and ultimately everyone’s daily life. It is expected that the connections of IoT devices will exceed 1 million per square kilometer and 100 billion in total [1–5]. For applications in which global coverage and mobility are major concerns, cellular technologies, especially LTE-M and NB-IoT are preferred technologies. Meanwhile, the majority of devices use non-cellular technologies including Bluetooth, Wi-Fi, ZigBee, EnOcean, SIGFOX, LoRa and others [6–13]. Wireless connection reliability, coverage, response speed and security are factors which heavily impact quality of experience and system performance, which in turn depends on agile and high-performance antennas. Therefore, OTA testing of the overall communications performance for IoT devices is of great significance [3–4].
OTA testing has been used as the standard method for radiated power and receiver performance evaluations of wireless devices in the 3rd Generation Partnership Project (3GPP) and Cellular Telecommunication and Internet Association (CTIA) [14–18]. Traditional single-input single-output (SISO) OTA testing includes Total Radiated Power (TRP) measurements for radiated power and Total Isotropic Sensitivity (TIS) measurements for sensitivity evaluation, requiring measurement grid resolutions of 15 and 30 respectively, for constant step grid. Typically, it takes around 60 and more than 120 minutes respectively for TRP and TIS measurement for 5G mobile phones. During both TRP and TIS measurements, devices under test (DUTs) are required to operate at maximum transmit power. However, many low-power IoT devices, including smart-watches, parking meters, pet tracking devices, etc., are designed to transmit at full power for only a short interval every hour, and as a result, typically have a very small heatsink for the power amplifier and a relatively low-capacity battery. Additionally, batteries in low-power IoT devices, such as those in smart water meters, often have to last 10 years or more. Therefore, attempts to perform OTA testing by current CTIA and 3GPP specifications for mobile phones will, in many cases, make the DUTs shut themselves off, and even become damaged due to excessive heat. Due to the proliferation of such devices, test time reduction is of great importance for OTA testing of 5G IoT. Unfortunately, no relevant research has been carried out or published.
The objective of this paper is to determine a suitable measurement grid for OTA testing of 5G IoT devices which balances measurement grid uncertainty with test time. This paper compares the effect of different grid configurations on OTA testing accuracy of IoT devices. Two reference patterns representing reasonable worst-case scenarios are proposed to mimic radiation of IoT DUTs while a variety of different grid configurations are compared through simulations to determine how well they could accurately reconstruct reference patterns. The related MU terms are analyzed and determined based on statistical analysis. As a result, the recommended grid configuration with resolution of 45/36 (theta/phi) for constant step grid is proposed for OTA testing of IoT devices, especially for low-power IoT devices. Compared with currently-required TIS grid in 3GPP/CTIA (30/30), a roughly 50% test time saving can be realized at the expense of an uncertainty relaxation of less than 0.2 dB.
II. APPROACH FOR MEASUREMENT GRID UNCERTAINTY ANALYSIS
For a complete sphere measured with N theta intervals and M phi intervals, both with even angular spacing, TIS can be calculated as follows:
| (1) |
where EIS is the radiated effective isotropic sensitivity measured at each direction and polarization, and is the weight function. In this research, the Clenshaw-Curtis weights in [19] are used. Considering that TIS requires much more test time than that of TRP, test time reduction for TIS is the first priority. In addition, the research method and its conclusion for TIS also apply to TRP due to reciprocity.
Currently, there are several quick TIS approaches being considered in industry, including the theta-dependent phi optimization [14]; device-reported receive signal strength (RSS) [14, 20–21]; grid point reduction; spiral scan [14]; device rotation during measurement [14]; single or multi-point offset in anechoic chambers and continuous-mode stirring in reverberation chambers [14, 22–25]. Among all of these methods, measurement grid reduction is a more direct and efficient one. It is obvious from (1) that the accuracy for TIS measurement depends highly on the total number and distribution of measurement grid points. The more points, the higher precision, and as a result, the longer test time. For time reduction, a trade-off must be made between accuracy and total number of grid points. Therefore, the effects of different measurement grid configurations on TIS measurement accuracy, and the determination of relevant MU are prerequisite.
In this paper, a variety of grid configurations are simulated to compare how well they could accurately reconstruct the reference patterns and determine the related MUs. Here, reference pattern refers to the worst-case pattern of IoT devices with a reasonable high directivity or narrow beamwidth as well as drastic variations. Two reference patterns are proposed to mimic radiation of IoT DUTs and the related analysis for different grids are presented in next section.
For MU analysis, the most realistic method is to analyze the statistical distribution of the TIS for a large number of random orientations. Although this can be done experimentally, it requires a large number of independent measurements to achieve statistical significance; considering the total test time needed, it is unrealistic for industry. Therefore, in this research, the related MU analysis is performed through numerical simulations, during which the relative orientation between the reference pattern and the TIS measurement grid is altered randomly and the standard deviation (STD) between TISs for each grid configuration can be derived from a set of 10,000 random orientations. For any given grid configuration, the grid-dependent MU term for TIS testing is determined by the STD of TISs. Considering random rotations of a reference pattern with respect to grids of arbitrary resolutions, it is therefore proposed that analytical expression of radiation patterns may be used as a reference.
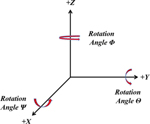
The random rotation mentioned here could be achieved by combinations of rotations around x, y, and z axes, as illustrated in Fig. 1. Due to the non-commutative nature of rotations, the order of rotations is important and must be pre-defined when multiple rotations are involved. The following order of rotations has been followed for the reference pattern orientations specified in this research: first, (rotation around the x axis); second, (rotation around the y axis); last, (rotation around the z axis).
Figure 1: Rotation angle definitions for random rotation.
III. SIMULATIONS AND ANALYSIS
A. Reference pattern 1
In this scenario, the dipole is adopted as the reference pattern to mimic the radiation property of 5G IoT DUTs. This arrangement is based on considerations that: (i) for the majority of IoT devices, the radiation properties of installed antennas are similar to that of dipoles; (ii) dipole could provide relatively drastic variations in theta; (iii) the analytical expression of radiation patterns for dipole is available, which is adopted in this simulation as equation (2) and illustrated in Fig. 2:
| (2) |
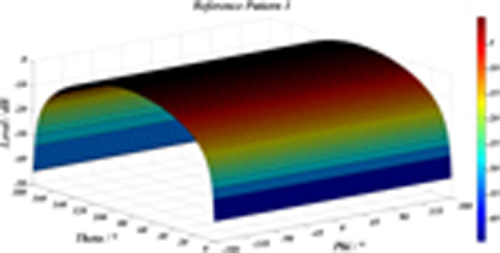
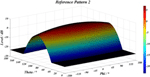
Figure 2: Illustration of reference pattern 1.
Table 1: Statistical analyses of 10k simulations for reference pattern 1 on different grid configurations
| Grids in Theta | Step Size in Theta | Grids in Phi | Step Size in Phi | STD [dB] | TotalNumber |
| 19 | =10 | 36 | =10 | 0.1036 | 614 |
| 12 | =16.36 | 19 | =18.95 | 0.2325 | 192 |
| 13 | =15 | 24 | =15 | 0.1934 | 266 |
| 13 | =15 | 12 | =30 | 0.2507 | 134 |
| 7 | =30 | 24 | =15 | 0.2282 | 122 |
| 12 | =30 | 0.3396 | 62 | ||
| 10 | =36 | 0.3578 | 52 | ||
| 9 | =40 | 0.4947 | 47 | ||
| 8 | =45 | 0.4044 | 42 | ||
| 7 | =51.4 | 0.5930 | 37 | ||
| 6 | =60 | 0.5129 | 32 | ||
| 6 | =36 | 24 | =15 | 0.2938 | 98 |
| 12 | =30 | 0.4726 | 50 | ||
| 10 | =36 | 0.4152 | 42 | ||
| 9 | =40 | 0.6688 | 38 | ||
| 8 | =45 | 0.4937 | 34 | ||
| 7 | =51.4 | 0.5993 | 30 | ||
| 6 | =60 | 0.6453 | 26 | ||
| 5 | =45 | 24 | =15 | 0.3639 | 74 |
| 12 | =30 | 0.4277 | 38 | ||
| 10 | =36 | 0.4360 | 32 | ||
| 9 | =40 | 0.6751 | 29 | ||
| 8 | =45 | 0.6205 | 26 | ||
| 7 | =51.4 | 0.7247 | 23 | ||
| 6 | =60 | 0.8224 | 20 | ||
| 4 | =60 | 24 | =15 | 0.6092 | 50 |
| 12 | =30 | 0.7202 | 26 | ||
| 8 | =45 | 0.8299 | 18 | ||
| 6 | =60 | 0.8751 | 14 |
Based on the settings above, we have performed simulations for different grid configurations, respectively. The simulated STDs are listed in Table 1 for comparison.
The highlighted grid resolutions of 15/15 (theta/phi) and 30/30 are currently required grid configurations in both 3GPP and CTIA for TRP and TIS measurements of mobile phones, which correspond to STDs of 0.1934 dB and 0.3396 dB, respectively. Based on the comparisons, the following observations can be made:
Observation 1: generally, as the grid resolution decreases, the total number of grid points decreases while the calculated STD increases;
Observation 2: as an exception, asymmetric distribution of grid points in both theta and phi could result in higher STDs, even with more grid points.
B. Reference pattern 2
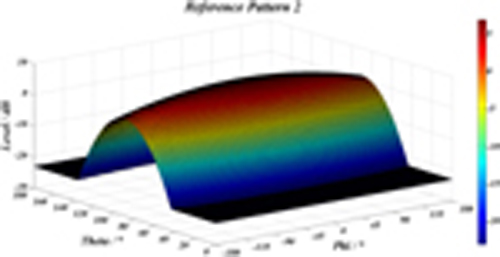
Figure 3: Illustration of reference pattern 2.
Table 2: Reference pattern 2
| Parametric Description | Equations |
|---|---|
| Horizontal radiation pattern | |
| Horizontal HPBW | |
| Vertical radiation pattern | |
| Vertical HPBW | 32.5 |
| Antenna radiation pattern | |
| Gain without antenna losses | G=6.8 dBi |
In this scenario, equations from [18] are utilized to generate reference pattern for MU analysis of different grid configurations. The pattern with 260/32.5 HPBWs (Horizontal/Vertical) and peak directivity of around 6.8 dBi is proposed in Table 2 and illustrated in Fig. 3 for reference. This arrangement is based on considerations that it can provide a reasonably larger directivity (i.e., narrower beamwidth) than that of IoT devices without exaggerating its influence. In addition, this pattern provides less symmetry compared with reference pattern 1.
Table 3: Statistical analyses of 10k simulations for reference pattern 2 on different grid configurations
| Grids in Theta | Step Size in Theta | Grids in Phi | Step Size in Phi | STD [dB] | TotalNumber |
| 19 | =10 | 36 | =10 | 2.1315e-04 | 614 |
| 12 | =16.36 | 19 | =18.95 | 7.6889e-04 | 192 |
| 13 | =15 | 24 | =15 | 5.8576e-04 | 266 |
| 13 | =15 | 12 | =30 | 0.0192 | 134 |
| 7 | =30 | 24 | =15 | 0.0295 | 122 |
| 12 | =30 | 0.0333 | 62 | ||
| 10 | =36 | 0.0867 | 52 | ||
| 9 | =40 | 0.0534 | 47 | ||
| 8 | =45 | 0.2487 | 42 | ||
| 7 | =51.4 | 0.1344 | 37 | ||
| 6 | =60 | 0.7255 | 32 | ||
| 6 | =36 | 24 | =15 | 0.0810 | 98 |
| 12 | =30 | 0.0824 | 50 | ||
| 10 | =36 | 0.1187 | 42 | ||
| 9 | =40 | 0.0935 | 38 | ||
| 8 | =45 | 0.2575 | 34 | ||
| 7 | =51.4 | 0.1555 | 30 | ||
| 6 | =60 | 0.7432 | 26 | ||
| 5 | =45 | 24 | =15 | 0.1828 | 74 |
| 12 | =30 | 0.1866 | 38 | ||
| 10 | =36 | 0.1972 | 32 | ||
| 9 | =40 | 0.1904 | 29 | ||
| 8 | =45 | 0.3177 | 26 | ||
| 7 | =51.4 | 0.2260 | 23 | ||
| 6 | =60 | 0.7414 | 20 | ||
| 4 | =60 | 24 | =15 | 0.4695 | 50 |
| 12 | =30 | 0.4884 | 26 | ||
| 8 | =45 | 0.5623 | 18 | ||
| 6 | =60 | 0.8414 | 14 |
The statistical results for different grid configurations with reference pattern 2 are summarized in Table 3. Based on the comparisons, the following observations can be made:
Observation 1: for the same grid configuration, the STDs with reference pattern 2 are much lower than that with reference pattern 1;
Observation 2: the calculated STD increases as the grid resolution decreases, with the exception that the symmetry distribution of grid points in phi could increase the calculated STDs even with more grid points.
In summary, different trends for calculated STDs can be observed between reference patterns. For reference pattern 1, asymmetric distribution of grid points in both theta and phi could result in higher STDs even with more grid points, which is opposite to that of reference pattern 2. This phenomenon can be attributed to difference in symmetry between different patterns. In other words, symmetric distribution of grid points could perform better for symmetric patterns, and vice versa, which can be used as a guideline for grid configuration selection when performing TIS testing. Compared with the STDs of currently-required 30/30 configuration with both reference patterns, one could also conclude that a proper relaxation in MU is allowed for grid reduction such that the STD is still less than 0.5 dB. Finally, according to the criteria of minimum grid points with STD no more than 0.5 dB, the grid resolution of 45/36 (theta/phi) with a STD of 0.4360 dB is recommended as the reference grid configuration for OTA testing of 5G IoT devices. Compared with currently adopted grid configuration with 62 points, a roughly 50% grid point reduction can be achieved.
IV. CONCLUSIONS
This paper proposes a suitable measurement grid configuration for OTA testing of 5G IoT devices which balances the measurement grid uncertainty with test time. During the research, two radiation patterns representing reasonable worst-case scenarios of IoT devices are proposed as reference to support the analysis of grid configurations. The effects of different grid configurations on OTA testing accuracy are compared while the grid-dependent MU terms for grid configurations are determined based on statistical analysis of the TISs for a large number of random orientations. Based on the proposed criteria, the grid configuration of 45/36 (theta/phi) with a roughly 50% grid point reduction is considered to be optimal for OTA testing of 5G IoT devices.
ACKNOWLEDGMENT
This work was supported by the Key Research and Development Project of Guangdong Province under Grant 2020B0101080001.
REFERENCES
[1] IMT-2020 (5G) Promotion Group, “White paper on 5G concept,” Feb. 2015.
[2] ITU-R, “Recommendation ITU-R M.2083-0: IMT vision – framework and overall objectives of the future development of IMT for 2020 and beyond,” Sep. 2015.
[3] Y. Qi, G. Yang, L. Liu, J. Fan, A. Orlandi, H. Kong, W. Yu, and Z. Yang, “5G over-the-air measurement challenges: Overview,” IEEE Trans. Electromagn. Compat., vol. 59, no. 6, pp. 1661-1670, 2017.
[4] P. Shen, Y. Qi, W. Yu, J. Fan, and F. Li, “OTA measurement for IoT wireless device performance evaluation: Challenges and solutions,” IEEE Internet Things J., vol. 6, no. 1, pp. 1223-1237, 2019.
[5] Y. Zhang, G. Tian, S. Zhang, and C. Li, “A knowledge-based approach for multiagent collaboration in smart home: From activity recognition to guidance service,” IEEE Trans. Instrum. Meas., vol. 69, no. 2, pp. 317-329, 2020.
[6] L. Chettri and R. Bera, “A comprehensive survey on Internet of Things (IoT) toward 5G wireless systems,” IEEE Internet Things J., vol. 7, no. 1, pp. 16-32, 2020.
[7] K. Shafique, B. A. Khawaja, F. Sabir, S. Qazi, and M. Mustaqim, “Internet of Things (IoT) for next-generation smart systems: A review of current challenges, future trends and prospects for emerging 5G-IoT scenarios,” IEEE Access, vol. 8, pp. 23022-23040, 2020.
[8] S. Henry, A. Alsohaily, and E. S. Sousa, “5G is real: Evaluating the compliance of the 3GPP 5G new radio system with the ITU IMT-2020 Requirements,” IEEE Access, vol. 8, pp. 42828-42840,2020.
[9] X. Chen, J. Tang, T. Li, S. Zhu, Y. Ren, Z. Zhang, and A. Zhang, “Reverberation chambers for over-the-air tests: An overview of two decades of research,” IEEE Access, vol. 6, pp. 49129-49143, 2018.
[10] H. T. Chattha, M. K. Ishfaq, B. A. Khawaja, A. Sharif, and N. Sheriff, “Compact multiport MIMO antenna system for 5G IoT and cellular handheld applications,” IEEE Antennas Wireless Propag. Lett., vol. 20, no. 11, pp. 2136-2140, 2021.
[11] X. Chen, “Measurement uncertainty of RC and its reduction techniques for OTA tests: A review,” IET Microw. Antennas Propag., vol. 13, no. 15, pp. 2598-2604, 2019.
[12] B. Xiao, H. Wong, D. Wu, and K. L. Yeung, “Design of small multiband full-screen smartwatch antenna for IoT applications,” IEEE Internet Things J., vol. 8, no. 24, pp. 17724-17733, 2021.
[13] R. Rodriguez-Cano and R. W. Ziolkowski, “Single-layer, unidirectional, broadside-radiating planar quadrupole antenna for 5G IoT applications,” IEEE Trans. Antennas Propag., vol. 69, no. 9, pp. 5224-5233, 2021.
[14] CTIA Certification Program, “Test plan for wireless device Over-the-Air performance,” V3.9.3, Sep. 2021.
[15] CTIA Certification Program, “Test plan for 2x2 downlink MIMO and transmit diversity Over-the-Air performance,” V1.2.2, Dec. 2021.
[16] CTIA Certification Program, “Test plan for millimeter-wave wireless device Over-the-Air performance,” V1.0.2, Dec. 2020.
[17] 3GPP, TR 37.977, “Universal Terrestrial Radio Access (UTRA) and Evolved Universal Terrestrial Radio Access (E-UTRA); Verification ofradiated multi-antenna reception performance of User Equipment (UE),” V16.0.0, Jun. 2020.
[18] 3GPP, TR 38.810, “NR; Study on test methods,” V16.6.0, Sep. 2019.
[19] C. W. Clenshaw and A. R. Curtis, “A method for numerical integration on an automatic computer,” Numerische Mathematik, vol. 2, p. 197-205,1960.
[20] P. Shen, Y. Qi, W. Yu, F. Li, and J. Fan, “Fast and accurate TIS testing method for wireless user equipment with RSS reporting,” IEEE Trans. Electromagn. Compat., vol. 58, no. 3, pp. 887-895, 2016.
[21] Y. Qi, P. Jarmuszewski, Q. Zhou, M. Certain, and J. Chen, “An efficient TIS measurement technique based on RSSI for wireless mobile stations,” IEEE Trans. Instrum. Meas., vol. 59, no. 9, pp. 2414-2419, 2010.
[22] F. Li, S. Huang, W. Xue, Y. Ren, and X. Chen, “Signal and coherence bandwidth effects on total radiated power measurements of LTE devices in reverberation chambers,” IEEE Trans. on Instrum. Meas., vol. 71, pp. 1-3, 2022.
[23] W. Xue, F. Li, and X. Chen, “Effects of signal bandwidth on total isotropic sensitivity measurements in reverberation chamber,” IEEE Trans. Instrum. Meas., vol. 70, pp. 1-8, 2021.
[24] CTIA Certification Program, “Test plan for wireless Large-Form-Factor device Over-the-Air performance,” V1.2.1, Feb. 2019.
[25] W. Xue, F. Li, X. Chen, S. Zhu, A. Zhang, and T. Svensson, “A unified approach for uncertainty analyses for total radiated power and total isotropic sensitivity measurements in reverberation chamber,” IEEE Trans. Instrum. Meas., vol. 70, pp. 1-12, 2021.
BIOGRAPHIES

Xiaochen Chen Senior Engineer, Chinese Leaders of EU FP6 GO4IT, FP7 WALTER, is responsible for several key research projects at the National Development and Reform Commission and the Ministry of Industry and Information Technology. He is responsible for formulating more than 20 domestic and foreign communication standards, applying for/owning 6 patents, and has published more than 20 academic papers. He is now with China Telecommunication Technology Labs, China Academy of Information and Communication Technology.

Xianhui Liunn is currently a Senior Engineer with China Telecommunication Technology Labs, China Academy of Information and Communications Technology. He is mainly engaged in 5G OTA testing, MIMO OTA and related technology research.

Siyang Sun is currently an Associate Professor with China Telecommunication Technology Labs, China Academy of Information and Communications Technology. He is mainly engaged in 5G standardization, 5G OTA testing, MIMO OTA and related technology research.
ACES JOURNAL, Vol. 38, No. 1, 1–6
doi: 10.13052/2023.ACES.J.380101
© 2023 River Publishers