Modeling the Insertion Loss of Structured Ethernet Cabling Standard using the Scattering Parameters
Olusegun Ogundapo and Charles Nche
School of Engineering, American University of Nigeria, PMB 2250, Yola-Nigeria
olusegun.ogundapo@aun.edu.ng, charles.nche@aun.edu.ng
Submitted On: August 27, 2021; Accepted On: March 21, 2022
Abstract
A method of simulating the insertion loss of different channel configurations of structured Ethernet cabling with reference to standard specifications is presented. The method can aid cable engineers in the study of the performance of Ethernet cabling systems during standardization in order to have a view of what to expect in real life. The paper considered the standard category 8 cabling system as a case study. The method presented used the scattering parameters implemented in Matrix Laboratory (MATLAB) to model the insertion loss of standard category 8 cabling system. The insertion loss simulation results provided good agreements with the standard category 8 cabling system. The method presented will serve as a basis to cable engineers who want to study future structured cabling systems under standardization to aid the design of prototype Ethernet cables.
Keywords: Category 8 cabling, Ethernet cables, insertion loss, scattering parameters, structuredcabling.
I. INTRODUCTION
Cable engineers and designers often seek for a way of simulating cable performance with reference to the specifications provided [1, 2] during standardization. The ability to effectively simulate and predict the cable performance is not only needed to have a view of what to expect in real life but also to aid the design and manufacture of the cables. There is the need for cable engineers to study the characteristics of the cable by simulating their performance using the specifications and data provided before their eventual prototype design. This research used the category 8 cabling standard as a case study to model the insertion loss based on the specifications and data provided by the IEEE Task Force on standardization of the cable [2, 3]. Although a method of predicting the insertion loss of the structured Ethernet cabling system has been provided in [4], this paper extends it further by providing simulations, which enhances the study of the effects of patch cord and backbone cable lengths on the insertion loss of different channel configurations. This is to enable a comparison between the different channel configurations.
Insertion loss (attenuation) is a measure of the decrease in signal strength along the length of a transmission line or channel [5]. When it comes to transmitting data over twisted pair wired channels, Ethernet is the technology widely used [6]. Ethernet is now used in Internet of Things for homes, industries, public places, etc. [7]. The 40GBASE-T is the next generation following the 10-Gigabit Ethernet over twisted pair cabling [8]. The 40GBASE-T system is being supported by category 8 twisted pair cable and is expected to have a maximum length of 30 m [9]. The Telecommunications Industry Association (TIA) in collaboration with the International Organization for Standardization/International Electro-Technical Commission (ISO/IEC) worked on creating the category 8 cabling and connector specifications under the IEEE 802.3bq task force [8]. The effort of the IEEE 802.bq Task Force with the TIA and the ISO/IEC resulted in the publication of the category 8 cabling standard which specifies how the 40GBASE-T cabling system is expected to operate with two connectors at a maximum frequency of 2000 MHz [1, 3]. These specifications provided by the ISO/IEC and the TIA for the category 8 standard will be used to provide a method of simulating the channel insertion loss of the structured cabling using the scattering parameters.
The scattering parameters have been used extensively for modeling, characterization, and design of microwave devices and networks. It has also been applied to transmission line network behavior design and analysis [10, 11]. The major advantage of scattering parameters is that it permits flexibility in design and can be used to analyze cascaded cable performance [11]. The category 8 topology has been specified to consist of two connectors that have effects on the overall loss and the insertion loss deviation due to the channel. These losses due to the connectors will be factored into the channel insertion loss modeling using the scattering parameters which presently does not have expressed provisions for it. The demand for higher Gigabit Ethernet cabling system was driven by the need for increasing access speeds across networks and higher rate throughput by data centers [13]. This is due to increasing demand for data bandwidth in the area of visualization, cloud computing, big data analytics, video-on-demand, etc. [9, 13].
The S-parameters can be expressed in terms of transmission line wave propagation characteristics as [14]
| (1) |
| (2) |
In eqn (1) and (2), is the characteristics impedance of the test equipment in ohms, is the cable or patch cord impedance in ohms, is the propagation constant, and l is the cable length in meters.
| (3) |
The propagation constant () is given in [4] and [15] as
| (4) |
The phase constant is expressed in [4] and [15] as
| (5) |
where the velocity of propagation constant ( is given in [15] as
| (6) |
The attenuation (for 100-m cable is expressed in [12] and [15] as
| (7) |
Therefore, the attenuation constant per meter is
| (8) |
The mathematical relationship between the S-parameters and the T-parameters that can be used to convert S-parameters to T-parameters and vice versa is expressed in [10] and [14] as
| (9) |
| (10) |
| (11) |
| (12) |
| (13) |
This research, therefore, provides a method that can be used to simulate the channel insertion loss of structured cabling standard and also study the effects of patch cords and cable lengths on the insertion loss. Different channel configurations were compared with each other to observe the effect on the insertion loss. All these simulations are in reference to the category 8 (40GBASE-T) cabling specifications using scattering parameters implemented in Matrix Laboratory (MATLAB).
II. MATERIALS AND METHODS
A. Category 8 channel configuration
The schematic diagram of the category 8 channel configuration as presented in [1], [2], and [4] is shown in Figure 1.
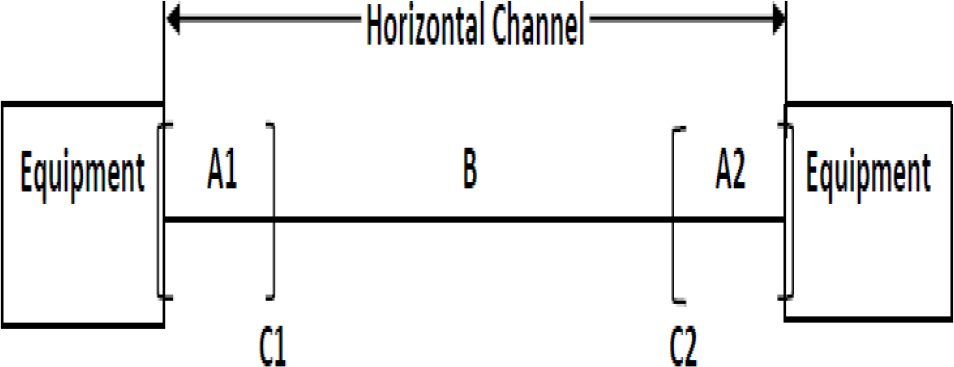
Figure 1: Category 8 horizontal channel configuration.
Note: A1 and A2 are the equipment cords or patch cords; C1 and C2 are the hardware connectors; B is horizontal cabling under consideration.
The maximum length requirement as given in [1] is
A + C (see Table 1)
B: 24 m (79 ft).
The specifications considered for this research are presented in [2]–[4] as follows:
| (14) |
where IL means the insertion loss and is the insertion loss deviation due to the channel.
The backbone cabling insertion loss for a 100-m length is
, for:
| (15) |
The insertion loss due to the connecting hardware is as follows:
for:
| (16) |
for
| (17) |
Table 1: Cord thickness (AWG) and maximum length allowed
| Cord (AWG) | A + C (m) |
|---|---|
| 22-23 | 8 |
| 24 | 6 |
| 26 | 4 |
The patch cord insertion loss is
| (18) |
The insertion loss deviation due to the channel is
| (19) |
The modifications provided to the insertion loss deviation of the channel to ensure good agreement with the category 8 cable specifications are
for:
| (20) |
| (21) |
The overall channel insertion loss of category 8 (40GBASE-T) cabling system was determined usingeqn (13).
B. Application of the scattering parameters to model the channel configuration
The schematic diagram of the scattering parameters method for predicting the insertion loss of the category 8 channel configuration is shown in Figure 2.
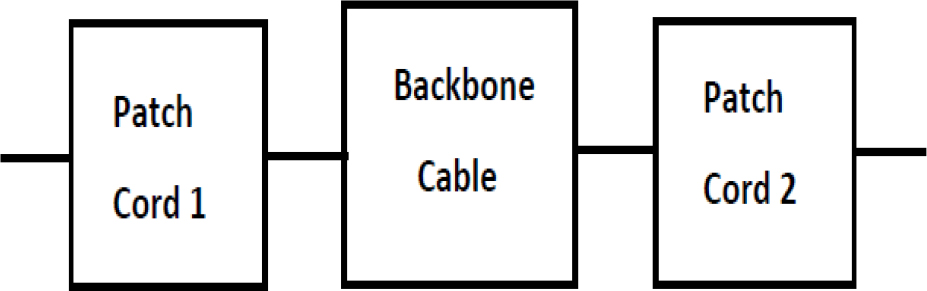
Figure 2: Schematic diagram of the scattering parameter approach.
In Figure 2, the S-parameters of the first patch cord, backbone cable, and second patch cord are taken as S, S, and S respectively.
To model the category 8 channel, the asymptotic impedances of the channel components are presented in [12] as cable asymptotic impedance ) = 104.5 ohms, patch cord asymptotic impedance () = 95.5 ohms, and equipment asymptotic impedance () = 100 ohms. These asymptotic impedances of the cable and patch cords are multiplied with a heuristic impedance equation which has been proven extensively to describe very well the mean characteristics impedance values. This heuristic impedance equation is expressed in [12] and [14] as
| (22) |
Therefore, the new characteristic impedances of the cable and patch cords are calculated as
| (23) |
| (24) |
The S-parameters of the cable and patch cords can now be determined individually using eqn (2).
C. Concatenation of channel cables
The concatenation of the channel cables in Figure 2 can be achieved by converting the S-parameters obtained from the two patch cords and the backbone cable into T-parameters and multiplying them sequentially as
| (25) |
The equivalent T-parameters obtained from eqn (25) are then converted back to S-parameters. The S-parameters from this conversion can be used to determine the insertion loss in decibels using eqn (13) in addition to the two connecting hardware insertion losses and the insertion loss deviation due to the channel.
III. RESULT OF THE MODELED STRUCTURED ETHERNET CHANNEL
The model simulation of the S-parameters from all the processes explained in Sections I and II was implemented in MATLAB to see if they agree with the category 8, 30m channel length prediction in [2]. The 3m-24m-3m and 1m-24m-5m channel configurations were used as samples for the S-parameter test simulation. The results of the MATLAB simulation in Figures 3 and 4 show very good agreement with the standard category 8 prediction, indicating that the model can now be used for a further analysis of the channel behavior.
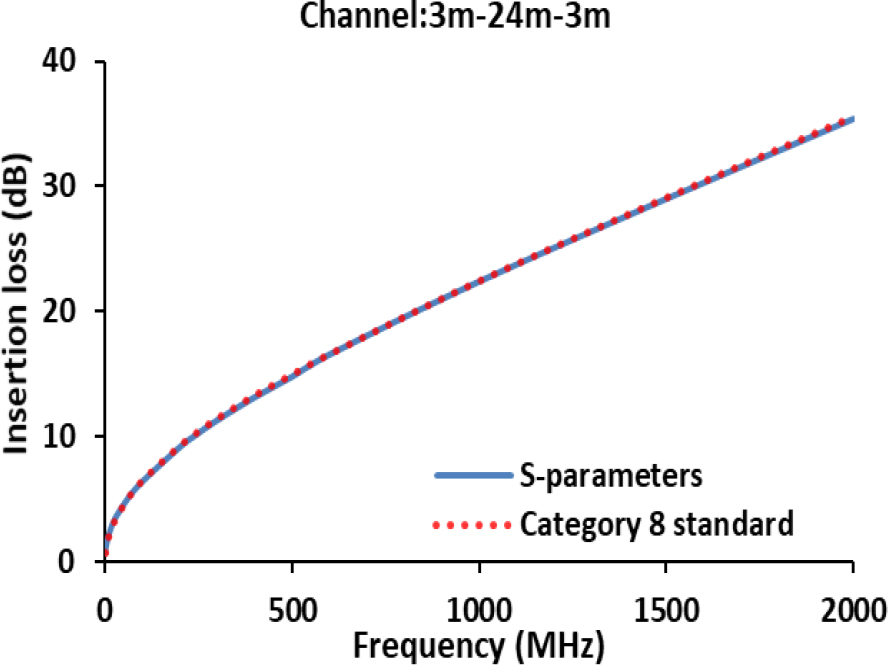
Figure 3: Insertion loss for 3m-24m-3m channel.
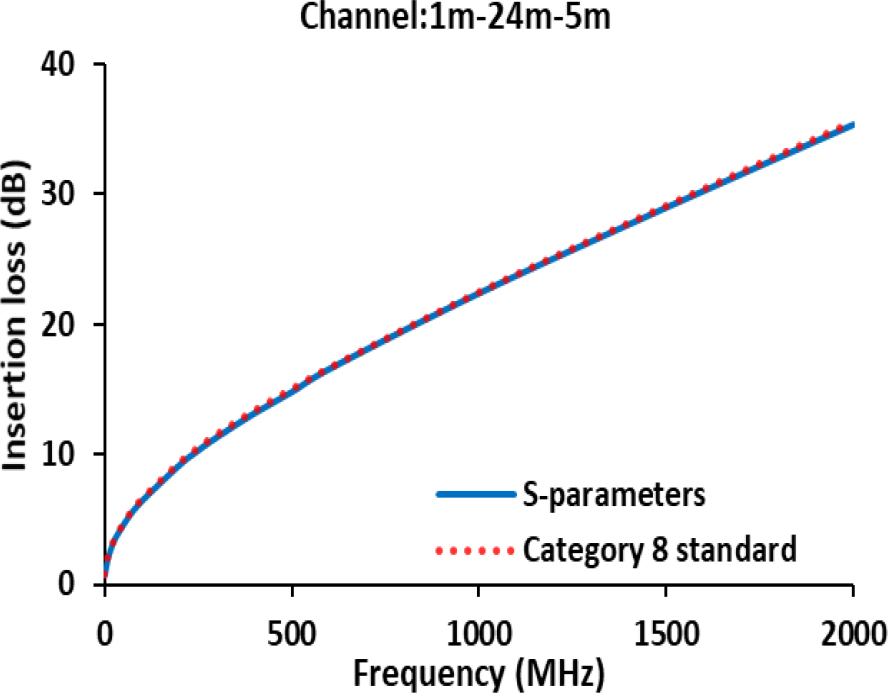
Figure 4: Insertion loss for 1m-24m-5m channel.
A. Category 8 channel behavior under different configurations
This paper studies the effect of patch cords and cabling lengths on the channel insertion loss, which were not considered in [4].
The configurations considered are:
(i) 3m-24m-3m, 2m-24m-2m and 1m-24m-1m
(ii) 3m-24m-3m, 3m-22m-3m and 3m-20m-3m
(iii) 3m-10m-3m, 2m-10m-2m and 1m-10m-1m
(iv) 3m-24m-3m, 2m-10m-2m and 1m-3m-1m
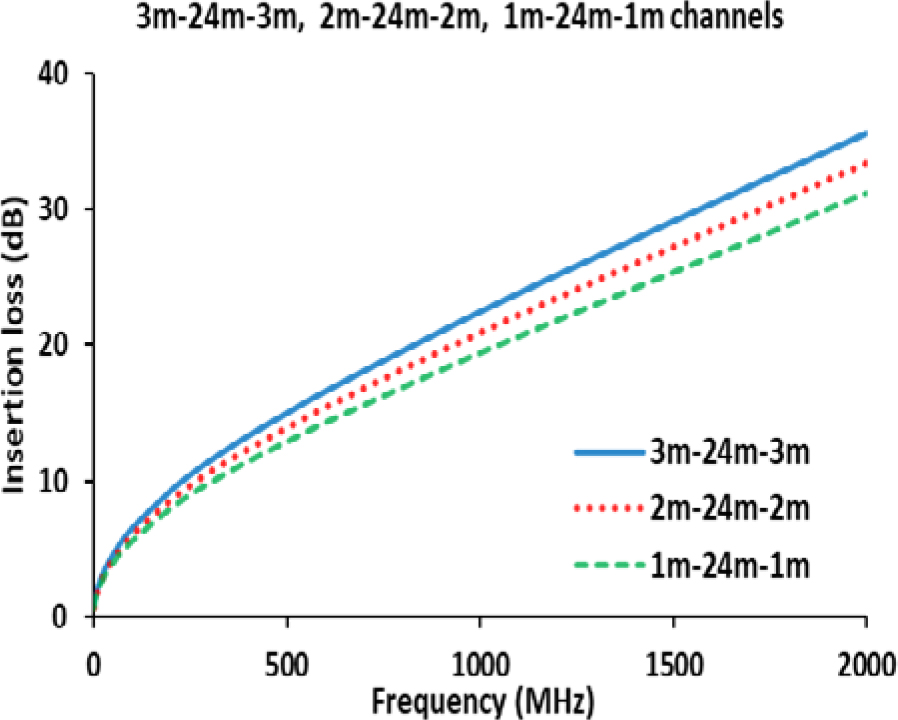
Figure 5: Comparison of the 3m-24m-3m, 2m-24m-2m, and 1m-24m-1m channels.
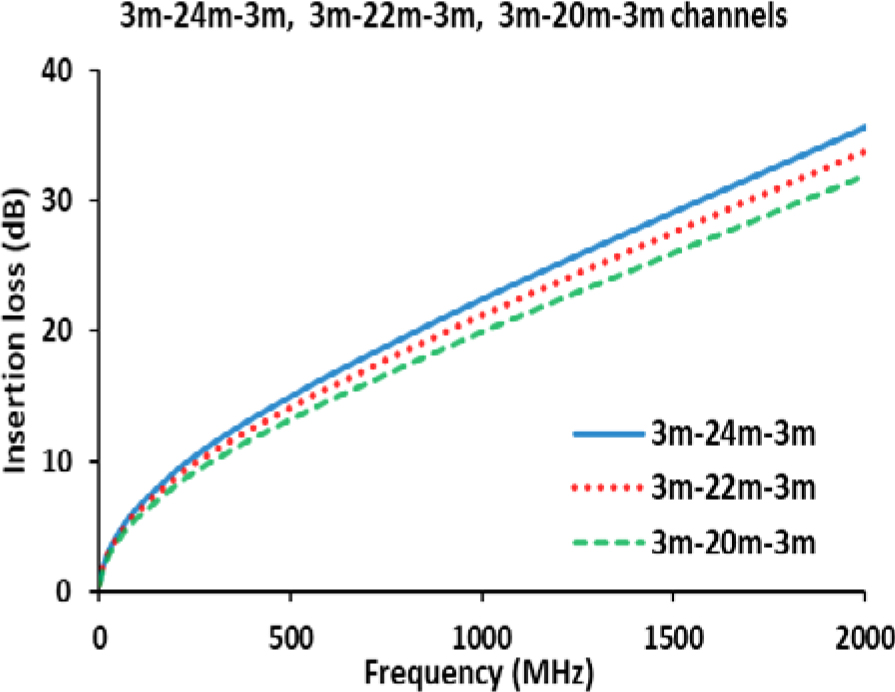
Figure 6: Comparison of the 3m-24m-3m, 3m-22m-3m, and 3m-20m-3m channels.
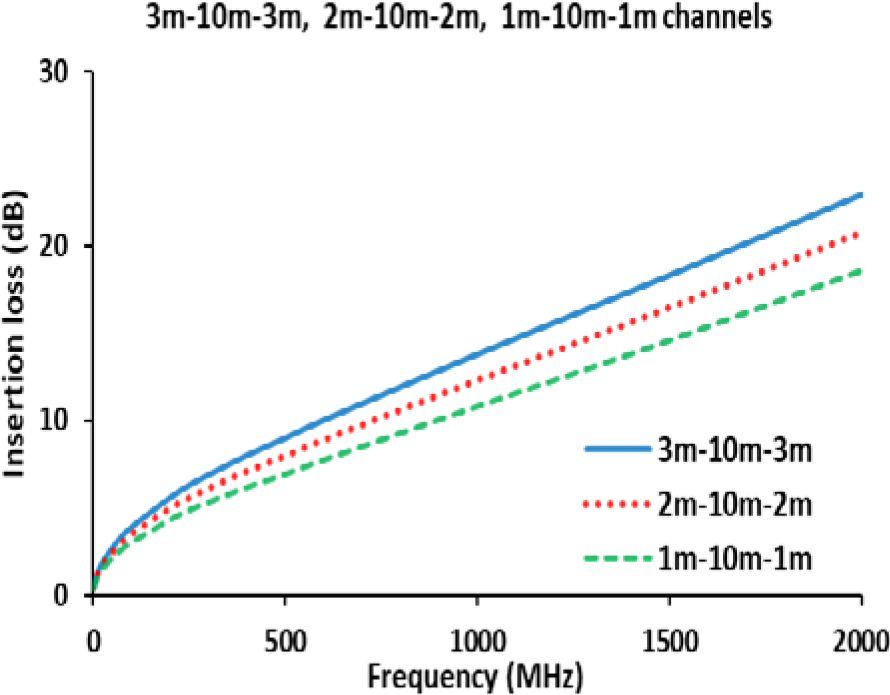
Figure 7: Comparison of the 3m-10m-3m, 2m-10m-2m, and 1m-10m-1m channels.
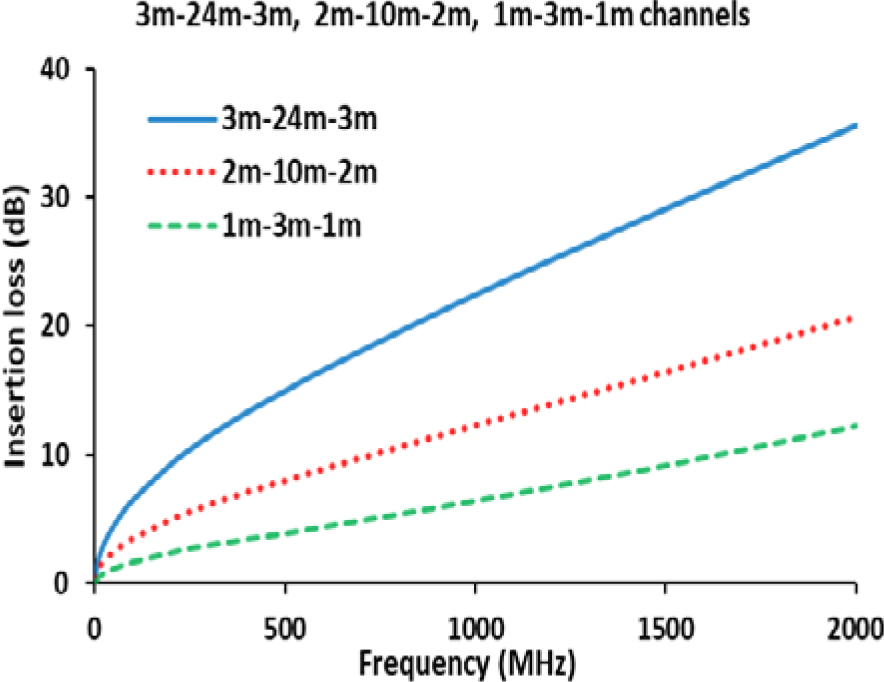
Figure 8: Comparison of the 3m-24m-3m, 2m-10m-2m, and 1m-3m-1m channels.
IV. DISCUSSIONS
In Figure 5, the comparison of the 3m-24m-3m, 2m-24m-2m, and 1m-24m-1m channels shows that the insertion loss decreases with decreasing patch cords lengths. In Figure 6, the comparison of the insertion loss of the 3m-24m-3m, 3m-22m-3m, and 3m-20m-3m channels shows that the insertion loss decreases with decreasing backbone cable lengths, which reduces the overall channel length. The results in both Figures 5 and 6 indicate that the insertion loss reduces when there is a decrease in patch cords and backbone cabling lengths. Similarly, in Figure 7, the comparison of the 3m-10m-3m, 2m-10m-2m, and 1m-10m-1m channels shows a reduction in the overall insertion loss of the channels confirming that the channel insertion loss decreases with deceasing channel lengths. Finally, Figure 8 shows that a comparison of the 3m-24m-3m, 2m-10m-2m, and the 1m-3m-1m channels indicates that the highest channel length of 3m-24m-3m has the largest insertion loss, followed by the 2m-10m-1m and the 1m-3m-1m channels. This is a further confirmation that channel lengths affect the channel insertion loss of the category 8 configurations.
V. CONCLUSION
This paper has presented a method that can be used by cable engineers to simulate the insertion loss of structured cabling standard and also study the effects of patch cord and backbone cable lengths on different channel configurations. The method can be used to predict the performance of different channel configurations of structured cabling standard which could aid the cable prototype design. The research used the category 8 cabling standard as a case study. The insertion loss prediction of the S-parameters model developed shows very good agreements with that of the category 8 cabling standard. The results also show that category 8 channel insertion loss reduces with decreasing channel lengths from either patch cords or backbone cabling or both. The method provided can be extended to predict the insertion loss of similar Ethernet cabling standards over structured cabling.
REFERENCES
[1] S. Vaden, “Inside the specifications of the new category 8 cabling standard,” in Cabling Installation and Maintenance Magazine, vol. 24, no. 8, pp. 27-29, Aug. 2016.
[2] C. DiMinico, “40GBASE-T channel insertion loss,” in IEEE P802.3bq 40GBASE-T Task Force Study Group Public Area, vol. 3, no. 11, Nov.2016.
[3] ANSI/TIA-568-C2-1, Addendum 1, Balanced twisted pair cabling and components standard: specifications for category 8 cabling, vol. 6, no. 7, Jul. 2016.
[4] O. Ogundapo, A. Duffy, C. Nche, and J. Gow, “Scattering parameters approach to insertion loss prediction for 40 GBASE-T systems over structured cabling,” Proceedings of the World Congress on Engineering, vol. 1, pp. 64-69, Jul.2014.
[5] M. Guo, Q. Chen, D. Sang, Y. Zheng, and Y. Fu, “Dual polarized dual-band frequency selective rasorber with low insertion loss,” IEEE- Antennas and Wireless Propagation Letters, vol. 19, no. 1, pp. 48-52, Jan. 2020.
[6] S. Buhr, X. Xu, M. Kreibig, and F. Ellinger, “A low power fast ethernet physical layer transceiver,” 26 IEEE International Conference on Electronic Circuits and Systems (ICECS), Italy, pp. 31-37, Nov. 2019.
[7] R. Eltom, E. Hamood, A. Mohammed, and A. Osman, “Early warning firefighting system using internet of things,” International Conference on Computer, Control, Electrical and Electronics Engineering (ICCCEEE), Khartoum, pp. 28-35, Aug. 2018.
[8] F. Straka, “40 Gbits/s over twisted pair copper cable is on the way,” in Electronic Products Magazine, vol. 56, no. 9, pp. 20-22, 2013.
[9] P. Mclaughlin “Category 8 questions answered,” in Cabling Installation and Maintenance Magazine, vol. 23, no. 10, pp. 23-25, Oct.2015.
[10] J. Dobrowolski, “Microwave network design using the scattering matrix,” published by Artech House 2010.
[11] R. Allred and C. Furse, “Linearization of S-parameter cascading for analysis of multiple reflections,” Applied Computational Electromagnetic Society (ACES) Journal, vol. 33, no. 12, Dec.2018.
[12] J. Walling and A. Duffy, “The modeling of 4 pair data grade channels with the aim to use differential mode transmission parameters which are given in the standardized specification requirements,” 57 International Wire and Cable Symposium, Rhode Island, USA, pp. 532-540, Nov.2008.
[13] J. Young, “The race to 40GBASE-T,” in COMM- SCOPE publication, vol. 3, no. 9, Sep. 2013.
[14] R. Papazyan, P. Petterson, H. Edin, R. Eriksson, and U. Gafvert., “Extraction of high frequency power cable characteristics from S-parameters measurements,” in IEEE Transactions on Dielectrics and Electrical Insulation, vol. 11, no. 3, pp. 461-470, Jun. 2004.
[15] P. Kish, “Channel return loss results,” in IEEEP802.bq 40GBASE-T Task Force Study Group Area, Nov. 2016.
BIOGRAPHIES

Olusegun Ogundapo received the Ph.D. degree in electronic engineering from De Montfort University, United Kingdom, the M.Sc. degree in electrical engineering from Ahmadu Bello University, Zaria, and the B.Eng. degree in electrical and electronic engineering from the Federal University of Technology, Yola now Modibbo Adama University, Yola-Nigeria.
He is currently an Assistant Professor with the School of Engineering, American University of Nigeria, Yola-Nigeria. His research interests are in computational electromagnetics, wireless/wired communication media analysis, modeling, and optimization. Other interests are Internet of Things (IOT), model data, and network analytics.

Charles Nche is the formal Dean of the Graduate School and currently a faculty in the School of Engineering (SOE), American University of Nigeria (AUN), Nigeria. He received the Ph.D. degree in computer networks from Loughborough University of Technology, Britain. He holds an Electrical and Electronics Engineering degree and a Master’s degree in digital communication systems.
He has worked for several companies, including BroadCom, Marconi, Mitel, etc. His research interest is centered on providing capacity, improving coverage, and increasing the efficiency of the network, using heterogeneous network (HETNET) and device-to-device communications (D2D). His other areas of interest include, but not limited to, high speed networks (40GBase-T System); wireless infrastructures and networks, resource allocation within 4G/5G networks using AI (ML and DL), and PV systems’ performance.
ACES JOURNAL, Vol. 37, No. 4, 435–440.
doi: 10.13052/2022.ACES.J.370409
© 2021 River Publishers