A Hybrid EMC Testing Facility: Combining Transmission Line and Reverberation Chamber Measurement System
Kai Chen, Wenjun Qi, Peng Peng, Hailong Wang, Xueqi Shen, Yongjiu Zhao, and Qian Xu
1College of Electronic and Information Engineering
Nanjing University of Aeronautics and Astronautics, Nanjing, 211106, China
chenkay@nuaa.edu.cn, qiwenjun@nuaa.edu.cn, emhai@foxmail.com, yjzhao@nuaa.edu.cn,
emxu@foxmail.com
2Nanjing Rongce Testing Technology Ltd
Nanjing, 211112, China
george@emcdir.com
3EMC technical expert with Ford Motor Research & Engineering Center (Nanjing)
Nanjing, 211100, China
pp02003125@126.com
Submitted On: May 7, 2022; Accepted On: February 16, 2023
ABSTRACT
By combining a transmission line system (TLS) and a reverberation chamber (RC), a hybrid electromagnetic compatibility (EMC) testing facility is designed and constructed. Generally, the lowest usable frequency (LUF) of an RC is limited by its dimension, which limits the application of RCs for EMC testing at low frequencies. Therefore, to improve the field uniformity (FU) of an RC at frequencies lower than the LUF, a TLS is integrated into the RC. After optimizing the load resistance, length, and width of the TLS, the resonant frequency and electric field spikes of the hybrid system are eliminated. The FU of the E-field in the system is greatly improved in the frequency range of 0-30 MHz. Moreover, using an oscillating wall stirrer in the RC, the FU satisfies the standard (IEC 61000-4-21) above 80 MHz. Results show that combining the TLS and the RC testing system could be widely used for EMC testing in the frequency range of 0-30 MHz and 80 MHz-6 GHz.
Index Terms: electromagnetic compatibility, field uniformity, reverberation chamber, transmission line system.
I. INTRODUCTION
Nowadays, nearly all electronic products should comply with electromagnetic compatibility (EMC) standards [1–2]. Ideally, products should be tested in a uniform and well-described facility in the frequency range of interest. If the field is not uniform enough in the testing area, the E-field fluctuation could be large and the accuracy of testing results may not be guaranteed. Thus, a variety of well-developed techniques have been introduced into the EMC testing industry, such as anechoic chambers, reverberation chambers (RC) [3], and transmission line systems [4–6].
An RC is an electrically large shielded cavity, which tunes the boundary conditions to create a statistically uniform, isotropic, and randomly polarized field [7-10]. Utilizing different kinds of stirring methods, such as source stirring [11], mechanical stirring [12–13], and frequency stirring [14], RCs have been widely applied to EMC testing. The lowest usable frequency (LUF) of an RC is affected by its first resonance frequency limited by the dimension of an RC [8]. For an RC with dimensions of 12.7 m 10.8 m 6.3 m, the LUF is about 80 MHz. How to extend the usable frequency range at the lower bound has attracted researchers’ attention in recent years [15–18].
Another important method for EMC testing is the transmission line technique [19–21]. It can only generate a transverse electromagnetic (TEM) mode in the testing frequency range. When the frequency increases, higher modes exist and the FU is deteriorated. Since an RC has a LUF while a TLS has a highest usable frequency (HUF), by combining these two facilities, the working frequency range could be expanded in one facility.
In this paper, we integrate a TLS and an RC to realize a hybrid EMC testing system in the frequency range of 0 - 30 MHz and 80 MHz - 6 GHz. The designed TLS generates testing fields below 30 MHz, and the RC using a sliding wall generates testing fields at frequencies above 80 MHz. The paper is organized as follows: section II presents the design and verification of the proposed TLS. Measurement results of the FU in the RC are shown in section III. Finally, section IV concludes the paper.
II. DESIGN AND VERIFICATION OF THE TLS
A stripline is realized by placing a transmission line above and parallel to the ground plane. When one end of the stripline is excited, the other end is connected with broadband resistances, it transmits TEM waves at working frequencies. The E-field generated by a stripline is uniform at low frequencies. The designed stripline and the geometry of the structure are demonstrated in Figs. 1 (a) and (b). By optimizing the load resistance and the cutoff frequency comprehensively, the structure dimensions are obtained as follows: , , and . Furthermore, the characteristics of the stripline in the open area test site (OATS) are verified and good performance is obtained. In the operating frequency band, the voltage standing wave ratio (VSWR) is less than 4, and the cutoff frequency is up to 30 MHz, which satisfies the designed requirements. Then the simulation model of the RC and the oscillating wall is built as shown in Fig. 2 (a), the oscillating wall is composed of four irregular horizontal plates, used as the mechanical stirrer inside the RC.
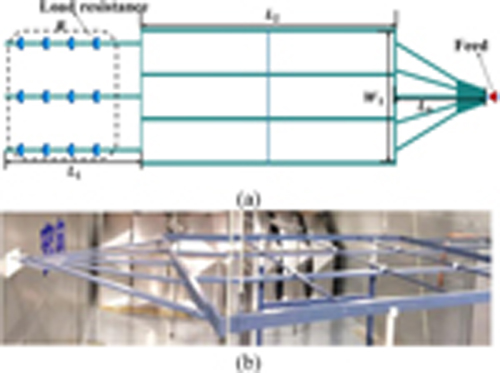
Figure 1: The designed strip line. (a) Geometry structure. (b) Fabricated sample.
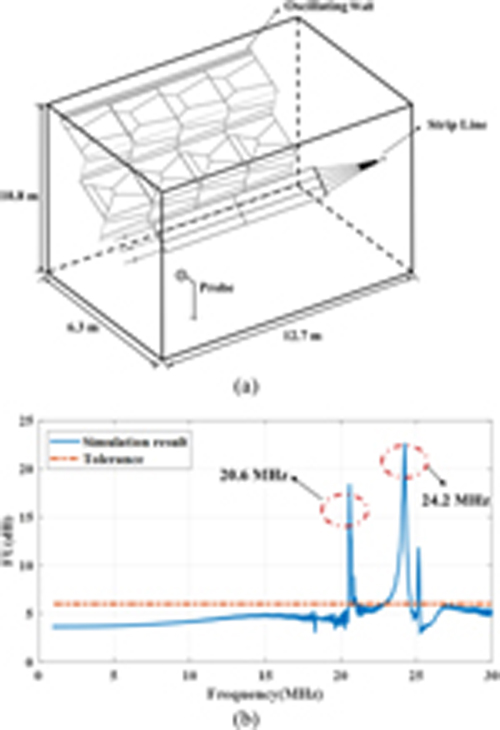
Figure 2: (a) The initial hybrid system. (b) The simulation results of FU in an RC.
According to the displacement of the oscillating wall, the scenarios are marked as 0%, 50% and 100%, respectively. 0% means that the movement of the stirrer is the smallest. We measure the FU at a 1 m height plane [1] using
| (1) |
where is the maximum value of E-field and is the minimum value of E-field in the testing area. The simulation result is demonstrated in Fig. 2 (b), some FU spikes over the frequency range of 20-30 MHz exist.
Generally, we can perturb the system to shift the resonance frequency of an RC and obtain a uniform field in the usable frequency band. Two methods are given: (a) change the position of the oscillating wall. The resonance frequency varies with the inner structures of the RC; (b) reduce the Q-factor of the E-field at resonance frequency until it can be ignored. During the simulation process, the latter method is selected and the oscillating wall is fixed at 100% state.
For the optimization of the designed stripline, the load impedance is first discussed. Considering that high field strength is applied during the EMC testing process, distributed resistances are adopted, to avoid exceeding the power tolerance of the resistances. We use a distributed loading network which is formed by many resistances in series and in parallel. Ceramic resistors are selected to ensure temperature and frequency stablity. In Figs. 3 (a) and (b), the simulation results of E-field for 1 W input power and the FU using different values of the load resistances are analyzed. With the increase of the single load resistance, the FU first tends to be flat and then deteriorates along with the frequency varies. When the value is about 110, the E-field and FU are the best.
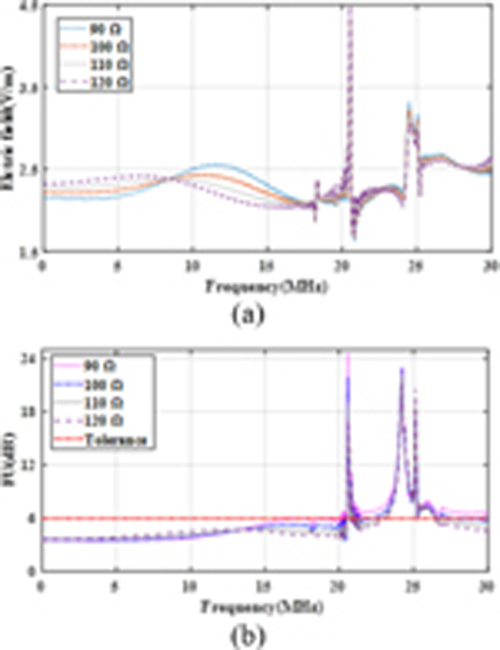
Figure 3: From 0 to 30 MHz, the simulation results changing with the value of load in an RC, (a) E-field for 1 W input power and (b) FU.
Then, the E-field distribution of the hybrid system at frequencies where the field resonances appear is analyzed. In Figs. 4 (a) and (b), the resonant frequency of is about 20.6 MHz, resulting in a nonuniform E-field under the stripline. In addition, from Figs. 4 (c) and (d), at 24.2 MHz, the sharp edges enhance the E-field below the strip line, which affect the field uniformity significantly. Thus the resonances need to be shifted or reduced at some frequencies. To achieve this effect, we place three horizontal metal rods in front of the oscillating wall. By increasing the coupling between the metal rods and the oscillating wall (where the E-field are in the same direction), the resonance can be reduced or shifted. It can be observed from the simulation results in Fig. 5 (a) that the FU around 20 MHz is reduced to below 6 dB. However, the FU deteriorates from 25 MHz to 30 MHz, which needs to be further optimized.
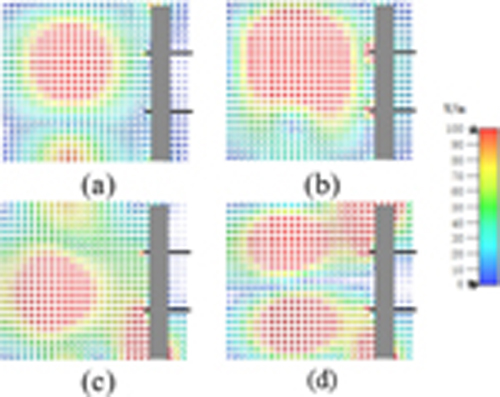
Figure 4: The E-field distribution on the 1 m plane at 20.6 MHz (a) t=0; (b) t=; at 24.2 MHz; (c) t=0; (d) t=T/4.
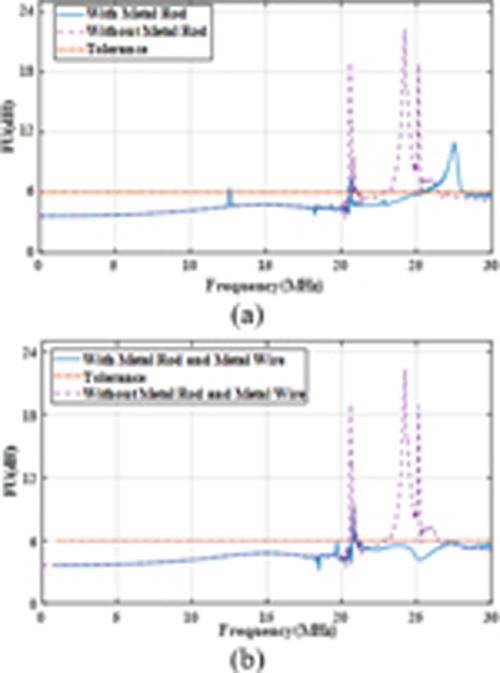
Figure 5: The optimizing simulation results of FU in an RC compared with the tolerance requirements combining (a) metal rod, and (b) metal rod and metal wire.
To further reduce the resonance effect, some extra structures are added to the hybrid system in Fig. 6 (a). After analyzing the E-field again, we put 500 loads at both ends of the metal rods and added two vertical metal wires into the system. The two metal wires terminated with 500 resistors on both sides are placed in front of the oscillating wall. The resonance is reduced and the FU is improved. The simulation results from Fig. 5 (b) show that the FU spikes from 25 MHz to 30 MHz is reduced to below 6 dB. The spike of E-field at about 20 MHz could be ignored here, which would be eliminated by tuning the position of the oscillating wall in the testing process. Finally, the simulation results satisfied the testing requirements.
III. MEASUREMENTS OF THE HYBRID SYSTEM
We test the FU of the hybrid system in two scenarios: one utilizing the proposed TLS in an RC from 0 - 30 MHz, the other using the oscillating wall as a mechanical stirrer from 80 MHz to 6 GHz. The measurement results demonstrate that the usable frequency range of the hybrid system can be extended.
A. Measurement of FU from 0-30 MHz
As shown in Fig. 6 (b), the hybrid system is composed of an RC, a stripline, a field probe, an oscillating wall, a signal generator, and a power amplifier. In an ideal simulation process (the metal and the boundary are perfect electrical conductors), the input power is 2500 W and 100 V/m field strength is generated. During the actual measurement,due to the loss of RF cables and the cavity, a higher input power is used to meet the requirements.
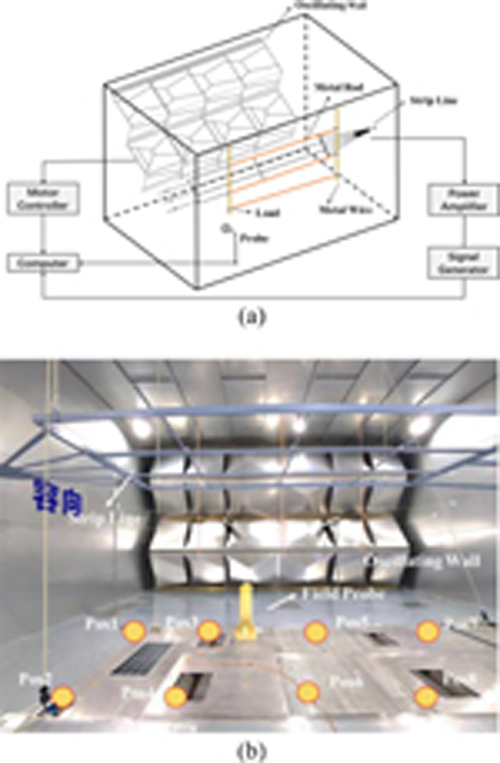
Figure 6: Typical FU measurement setup with the TLS: (a) schematic plot, and (b) measurement scenario in an RC.
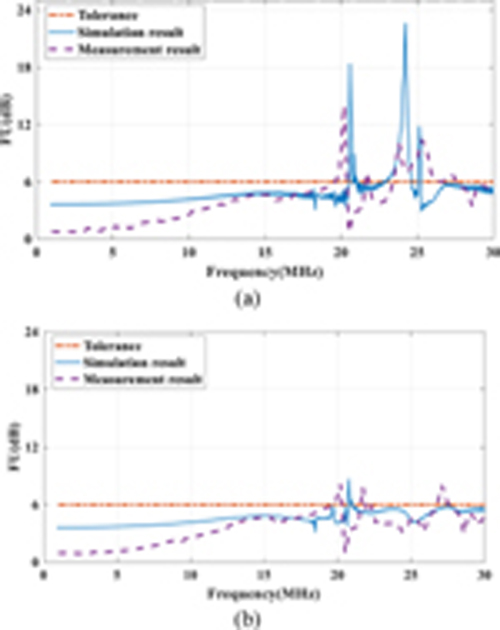
Figure 7: From 0 MHz to 30 MHz, the simulation and measurement results of FU in the RC combining the TLS compared with the tolerance requirements, (a) initial results, and (b) optimized results.
In this measurement, the designed TLS is placed beside the metal wall in the RC. Moreover, the E-field probes are placed at 8 different positions at the corner of the working volume under the TLS. We measure the FU of the hybrid system as shown in Fig. 7 (a), the initial measurement results have slightly deviated from the simulation results. In the frequency range of 1 MHz - 18 MHz, the simulated FU is higher than the measured FU, due to the field probe positions of simulation being sampled at a higher density than used in the measurements. From 18 MHz to 30 MHz, some spikes of FU appeared. The maximum FU of the stripline is 14.0 dB, which does not satisfy the expected results.
The final measurement scenario in an RC with the TLS is shown in Fig. 6. Additional metal rods are added in the hybrid system. The optimized simulation and measurement results are shown in Fig. 7 (b). Compared with the initial results in Fig. 4, the FU is almost less than 6 dB over the whole frequency band. Considering the frequency dependeny of the resistors, the measurement result is not as ideal as the simulation result. The reasons could be due to the difference between the simulation model and the reality. In the simulation, the structure of the stirrer inside the RC and is simplified as we do not have the detailed drawings from the manufacturer. The position of the stirrer in the simulation and reality may not be exactly the same. Since the RC is a high Q cavity, the difference in the models could lead to very different results. As we do not expect the same results between simulation and measurement, as long as our approach works well in both simulation and measurement, it could be enough in practice and the measurement data is finally used in EMC testings.
It is noted that only a few samples of FU exceeded 6 dB in the frequency range of 18 MHz - 23 MHz and 26 MHz - 28 MHz. To avoid the resonance and achieve a lower FU, we need to tune the position of the oscillating wall (0%, 50%, and 100%) inside the RC to perform mechanical stirring in the frequency range of 20 MHz-30 MHz.
By shifting the resonant frequencies, the final results shown in Fig. 8 can achieve a lower FU, which satisfied the testing requirements in the entire working area. We show that different positions of the oscillating wall could avoid the spikes of FU and the hybrid system is proved to be feasible.

Figure 8: The FU in the RC with different state of the oscillating wall compared with the tolerance requirements from 0 - 30 MHz.
B. Measurement of FU from 80 MHz-6 GHz
In an RC, the FU characterizes the statistical uniformity of the E-fields. The statistical FU is defined as the relative standard deviation of the maximum E-fields obtained at the eight positions in the testing volume [2]. The standard deviation (i.e. the FU) is defined as
| (2) |
When the FU is lower than the tolerance given in [2], the field in an RC can be regarded as statistically uniform. Generally, the LUF occurs at three to six times the first chamber resonance f. The f of the RC is 18.23 MHz and the theoretical LUF is about 54.7 MHz-109.39 MHz. Furthermore, the LUF is about 80 MHz, corresponding with the theoretical value.
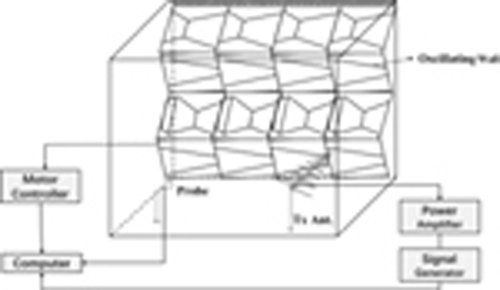
Figure 9: Typical FU measurement setup using an oscillating wall.
A typical measurement setup is given in Fig. 9 from 80 MHz to 6 GHz. The measurement system consists of the RC, a Tx antenna, the oscillating wall, and the E-field probes. In the testing, the oscillating wall [12] moves back and forth to perturb inner structures of the RC during one measurement period. With the movement of the oscillating wall in the range of 3 m, the field of the RC achieves statistical uniformity. A power amplifier is used to compensate for the cable loss and the cavity loss.
In Fig. 10, the FUs obtained from field probes are lower than the FU tolerance from 80 MHz to 6 GHz. Furthermore, the FUs for different polarizations (, , and ) and the total FU are all less than 4 dB from 80 MHz to 100 MHz and less than 3 dB from 100 MHz to 6 GHz, which satifisfies the limit in the IEC 61000-4-21standard.

Figure 10: The FU in the RC using oscillating wall compared with the tolerance requirements from 80 MHz - 6 GHz.
IV. CONCLUSION
For EMC testing, by combining the TLS and the RC, the usable frequency band of the hybrid system has been extended. The stripline is designed in the frequency of 0-30 MHz which can generate a uniform E-field. Moreover, through optimizations, the stripline is integrated into the RC. Additional structures are added to tune the resonant frequencies and improve the uniformity of the E-field. The results show that the FU is below 6 dB within 0-30 MHz, and the resonances in the frequency range of 20-30 MHz can be avoided by tuning the structures inside the RC.
ACKNOWLEDGMENT
This work was supported in part by Nanjing Rongce Testing Technology Ltd, the National Defense Basic Scientific Research Program of China under Grant JCKYS2021DC05, and The Fund of Prospective Layout of Scientific Research for NUAA.
REFERENCES
[1] IEC 61000-4-21, Electromagnetic Compatibility (EMC) – Part 4-21: Testing and Measurement Techniques – Reverberation Chamber Test Methods, IEC Standard, Ed 2.0, 2011-01.
[2] ISO 11452-2, Road Vehicles — Component Test Methods for Electrical Disturbances From Narrowband Radiated Electromagnetic Energy — Part 2: Absorber-lined Shielded Enclosure, ISO Standard, Ed 2.0, 2004-11.
[3] M. Migliaccio, G. Gradoni, and L. R. Arnaut, “Electromagnetic reverberation: The legacy of Paolo Corona,” IEEE Trans. Electromagn. Compat., vol. 58, no. 3, pp. 643-652, Jun. 2016.
[4] M. L. Crawford, “Generation of standard EM fields using TEM transmission cells,” IEEE Trans. Electromagn. Compat., vol. EMC-16, no. 4, pp. 189-195, Nov. 1974.
[5] M. Valek, T. Korinek, and T. Bostik, “Design of stripline for EMC testing,” Proc. 14th IEEE Conf. Microw. Tech., Prague, Czech Republic, pp. 1-4, 2008.
[6] B. E. Roseberry and R. B. Schulz, “A parallel-stripline for testing of RF susceptibility,” IEEE Trans. Electromagn. Compat., vol. 7, no. 2, pp. 142-150, Jun. 1965.
[7] D. A. Hill, Electromagnetic Fields in Cavities: Deterministic and Statistical Theories, Wiley-IEEE Press, New Jersey, USA, 2009.
[8] Q. Xu and Y. Huang, Anechoic and Reverberation Chambers: Theory, Design and Measurements, Wiley-IEEE, Chichester, UK, 2019.
[9] X. Chen, J. Tang, T. Li, S. Zhu, Y. Ren, Z. Zhang, and A. Zhang, “Reverberation chambers for over-the-air tests: An overview of two decades of research,” IEEE Access, vol. 6, pp. 49129-49143, Aug. 2018.
[10] A. Adardour, G. Andrieu, and A. Reineix, “On the low-frequency optimization of reverberation chambers,” IEEE Trans. Electromagn. Compat., vol. 56, no. 2, pp. 266–275, Apr. 2014.
[11] Q. Xu, L. Xing, Y. Zhao, T. Jia, and Y. Huang, “A source stirred reverberation chamber using a robotic arm,” IEEE Trans. Electromagn. Compat., vol. 62, no. 2, pp. 631-634, Apr. 2020.
[12] Z. Zhou, P. Hu, X. Zhou, J. Ji, M. Sheng, P. Li, and Q. Zhou, “Performance evaluation of oscillating wall stirrer in reverberation chamber using correlation matrix method and modes within Q-bandwidth,” IEEE Trans. Electromagn. Compat., vol. 62, no. 6, pp. 2669-2678, Dec. 2020.
[13] K. Madsen, P. Hallbjorner, and C. Orlenius, “Models for the number of independent samples in reverberation chamber measurements with mechanical, frequency, and combined stirring,” IEEE Antennas Wireless Propag. Lett., vol. 3, pp. 48-51,2004.
[14] T. A. Loughry, “Frequency stirring: An alternate approach to mechanical mode-stirring for the conduct of electromagnetic susceptibility testing,” Phillips Laboratory, Kirtland Air Force Base, NM Technical Report 91-1036, 1991.
[15] A. Coates and A. P. Duffy, “Maximum working volume and minimum working frequency tradeoff in a reverberation chamber,” IEEE Trans. Electromagn. Compat., vol. 49, no. 3, pp. 719-722, Aug. 2007.
[16] H. Sun, Z. Li, C. Gu, Q. Xu, X. Chen, Y. Sun, and F. Martin, “Metasurfaced reverberation chamber,” Sci. Rep. vol. 8, no. 1577, Jan. 2018.
[17] J. Perini and L. S. Cohen, “Extending the operation of mode stirred chambers to low frequencies,” IEEE International Symp. on Electromagn. Compat., Minneapolis, MN, USA, pp. 964-965,2002.
[18] M. L. Crawford, M. T. Mark, J. M. Ladbury, and B. F. Riddle, Measurement and Evaluation of a TEM/Reverberating Chamber, National Institute of Standards and Technology, Gaithersburg, 1990.
[19] S. Hilavin and A. Kustepeli, “Design and implementation of a TEM stripline for EMC testing,” IEEE Trans. Electromagn. Compat., vol. 56, no. 1, pp. 23-27, Feb. 2014.
[20] P. Kay, “Considerations on a hybrid TEM-reverberation chamber,” Electromagn. Compat. Symp., Adelaide, 2009.
[21] W. Bittinger, “Properties of open strip lines for EMC measurements,” Proc. IEEE Int. Symp. Electromagn. Compat., Dallas, TX, USA, pp. 120-125, Aug. 1993.
BIOGRAPHIES
Kai Chen received his M.Eng. degree in Agricultural Mechanization from Yangtze University, Jingzhou, China, in 2014. He is currently pursuing a Ph.D. degree in Electromagnetic Field and Microwave Technology at the College of Electronic and Information Engineering, Nanjing University of Aeronautics and Astronautics. He was an EMC Engineer with H3C, Hangzhou, China, in 2010. He is an Application Engineer with Nanjing Rongce Testing Technology Ltd., Nanjing, China. His main research interests include reverberation chamber and electromagnetic compatibility (EMC).

Wenjun Qi received her B.Eng. degree and M.Eng. degree from Nanjing University of Aeronautics and Astronautics, Nanjing, China in 2018 and 2021, respectively, and she is currently pursuing a Ph.D. degree in Electromagnetic Field and Microwave Technology.
Her main research interests include reverberation chamber, computational electromagnetics and statistical electromagnetics, over-the-air (OTA) testing and electromagnetic compatibility (EMC).

Peng Peng received his M.Eng. Degree from the College of Mechanical Engineering, Southeast University, Nanjing, China in 2010. Prior to 2021, he was an EMC expert at Ford Motor China Engineering Center. He is interested in new EMC solutions for automotive EMC design and validation, and now works for a leading EVcompany.

Hailong Wang received his B.E. degree from Jinling Institute of Technology, Nanjing, China, in 2019, and his M.Eng. degree from the College of Electronic and Information Engineering from Nanjing University of Aeronautics and Astronautics, China, in 2022. He is currently working as an EMS Engineer. His research interests include liquid antennas, electromagnetic interference and EMC measurement methods.

Xueqi Shen received his M.Eng. degree from the Department of Radio, Southeast University, Nanjing, China, in 1989. He founded the Rongxiang Company in 2004 and Nanjing Rongce Testing Technology Ltd. in 2012, which is an EMC laboratory recognized by Ford and Yutong. Currently, Nanjing Rongce has the largest vehicle reverberation chamber in China. He is currently a Committee Member of Branches A, I, and D of the National Technical Committee on Radio Interference of Standardization Administration of China.
Yongjiu Zhao received his M.Eng. and Ph.D. degrees in Electronic Engineering from Xidian University, Xi’an, China, in 1990 and 1998, respectively. Since March 1990, he has been with the Department of Mechano-Electronic Engineering, Xidian University where he was made a professor in 2004. From December 1999 to August 2000, he was a Research Associate with the Department of Electronic Engineering at The Chinese University of Hong Kong. His research interests include antenna design, microwave filter design and electromagnetic theory.

Qian Xu (Member, IEEE) received his B.Eng. and M.Eng. degrees from the Department of Electronics and Information, Northwestern Polytechnical University, Xi’an, China, in 2007 and 2010, and received his Ph.D. degree in Electrical Engineering from the University of Liverpool, U.K, in 2016. He is currently an Associate Professor at the College of Electronic and Information Engineering, Nanjing University of Aeronautics and Astronautics, China.
He was an RF engineer in Nanjing, China in 2011 and an Application Engineer at CST Company, Shanghai, China in 2012. His work at the University of Liverpool was sponsored by Rainford EMC Systems Ltd. (now part of Microwave Vision Group) and the Centre for Global Eco-Innovation. He has designed many chambers for industry and is the author of the book, Anechoic and Reverberation Chambers: Theory, Design, and Measurements (Wiley-IEEE, 2019). His research interests include statistical electromagnetics, reverberation chamber, EMC and over-the-air testing.
ACES JOURNAL, Vol. 38, No. 1, 15–21
doi: 10.13052/2023.ACES.J.380103
© 2023 River Publishers