Reducing the Measurement Time in a Reverberation Chamber to Less than 1 Second
Wenjun Xia, Wenjun Qi, Feng Fang, Chong Li, Lei Xing, and Qian Xu
College of Electronic and Information Engineering
Nanjing University of Aeronautics and Astronautics, Nanjing, 211106, China
xiawenjun@nuaa.edu.cn, emxu@foxmail.com
Submitted On: June 10, 2022; Accepted On: July 22, 2022
ABSTRACT
To increase the speed of the measurement, a time-efficient multi-probe system in a reverberation chamber (RC) is validated. The system consists of 4 printed circuit board (PCB) switches integrating with 128 probe antennas. By using solid-state switches, all antennas can be switched over in sequence in less than 1 second. Typical characteristics of the RC and the total radiated power (TRP) of the device under test (DUT) are performed to verify the validity of this configuration. Compared with the RC using mechanical stirrers, this system shows its superiority in terms of testing efficiency.
Index Terms: measurement technique, multi-probe system, OTA, reverberation chamber.
I. INTRODUCTION
A reverberation chamber (RC) is an electrically large shielded room with mechanical stirrers used to change the field in the chamber [1–2]. With rotated stirrers, a statistically uniform and isotropic environment in the chamber can be created.
In past decades, the RC has been widely applied to both electromagnetic compatibility (EMC) measurements and over-the-air (OTA) testing. It can be used to evaluate the performance of some antennas and devices under test (DUTs), such as radiation efficiency [3–4], radiated emission and immunity tests [5], diversity gain [6], total radiated power (TRP) [7–10], total isotropic sensitivity (TIS) [10–11], and various different fields.
In order to achieve a well-stirred RC for accurate measurements, numerous independent samples are needed. For a typical RC with mechanical stirrers, the measurement is a time-consuming process because the stirrers are rotated with steps. Recently, optimized stirrers have been designed to improve the stirring performance [12]. Meanwhile, the source-stir technique has been applied to improve testing efficiency [13–21]. The multi-probe system, one of the stir techniques, is generally used in the RC [18–21]. By placing several receiving antennas (source-stirring) on the wall instead of mechanical stirring, both the calibration and other measurements can be performed quickly. In this paper, we design a time-efficient multi-probe system with 128 antenna probes integrated on the 4 PCB switches, which can be used in the RC to perform measurements. The measurement setup is shown in Fig. 1. Instead of using software switching controlled by a computer, digital sequences with a hardware control unit is applied which accelerate the switching process significantly. Important parameters of the RC have been measured to validate its configuration.
This paper is organized as follows: The configuration and design of the multi-probe system are given in Section II. Measurement results such as field uniformity (FU), quality factor (Q factor), and TRP are detailed in Section III. Section IV gives the conclusion.
II. DESIGN AND ANALYSIS
As shown in Fig. 1, the multi-probe system is composed of 4 PCB switches considering the size of the RC. Every PCB switch has 8 single-pole four-throw (SP4T) solid-state switches and 1 single-pole eight-throw (SP8T) solid-state switch, which are used to switch 32 radio frequency (RF) paths. The multi-probe system controller consists of a digital signal generator used to send logic control signals to solid-state switches and a 1 SP4T switch intended for receiving RF signals from the 4 PCB switches. Antenna (Ant) 1 is connected to Port 1 of the vector network analyzer (VNA), the output port of the system controller is connected to Port 2. At each position, we measure S-parameters for 60,001 frequency points in the frequency range of 100 MHz - 6 GHz. The front of the multi-probe PCB switch is illustrated in Fig. 2 (a). The SMA connectors connected with receiving antennas are distributed in the four sides of the PCB. The back of the PCB switch is the control path, which is shown in Fig. 2 (b). Signals on each path need to pass through 1 SP8T solid-state switch, 1 SP4T solid-state switch, and some microstrip lines.
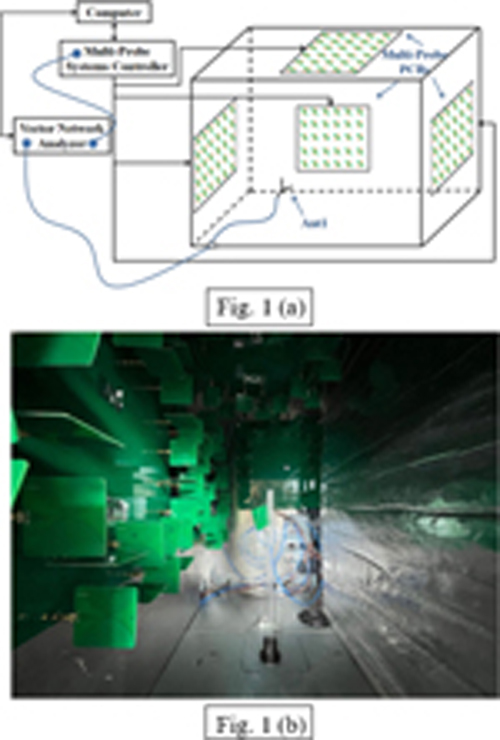
Figure 1: Measurement setup: (a) schematic plot. (b) Measurement in multi-probe RC, the inner dimensions of the RC are 1.2 m 0.8 m 1.2 m.
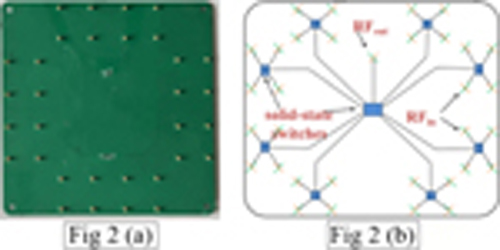
Figure 2: The structure of the multi-probe PCB switch: (a) 32 probe antennas integrated on the PCB. (b) The RF paths of the PCB switch.
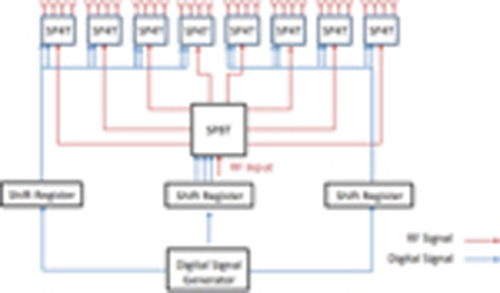
Figure 3: The system network diagram of the PCB switch.
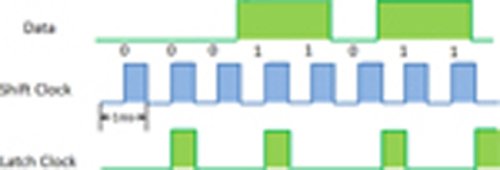
Figure 4: The schematic diagram of the digital signals to control the SP4T solid-state switch.
Generally, an SP4T solid-state switch needs 2 logic control input signals and an SP8T solid-state switch needs 3 logic control input signals. Considering the limited output terminals of the digital signal generator, we utilize an 8-bit output shift register to extend the number of the control signals. Figure 3 shows the system network diagram of the PCB switch. As is shown, the digital signal generator sends data and clock signals to 3 shift registers which are used to control 8 SP4T switches and 1SP8T switch. By toggling the switch state, the RF input signal can arrive at any of the 32 paths. The schematic diagram of the digital signals to control the SP4T switch is shown in Fig. 4. Through setting the interval of the shift clock as 1ms, the data can be output every 2 ms. Thus, the SP4T solid-state switch can alter 4 times within 8 ms. The control of the SP8T solid-state switch is similar to this.
III. MEASUREMENT AND RESULTS
In this paper, we demonstrate the validity of the proposed configuration using a vector network analyzer (VNA). Two parameters of the RC: quality factor and field uniformity are investigated to characterize its performance. The TRP of a DUT has also been measured to show the test efficiency.
Q factor is an important parameter of the RC, which is defined as the ratio of the stored power U to the dissipated power P:
| (1) |
It is well known that we can also use the time domain (TD) method to calculate Q factor using the following equation (2):
| (2) |
where is the angular frequency, and is the chamber decay constant. Thus, although measurements are performed in the frequency domain (FD) through the VNA, we can obtain TD results using the inverse Fourier transform (IFT) to the FD response. The and Q factor are demonstrated in Fig. 5.
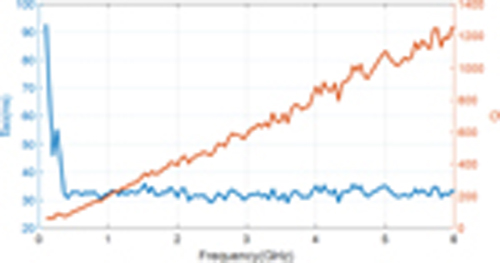
Figure 5: Measured and Q factor in the RC.
The FU can characterize the statistical uniformity of an RC, which is defined as the relative standard deviation of the average values obtained at the nine positions in RC [2]. We can judge whether the RC has statistical uniformity according to the tolerance requirements given in the IEC Standard [22]. Due to the limit of the frequency of the solid-state switch, we measure S-parameters for 6,001 frequency points in the frequency range of 100 MHz - 6 GHz. 9 test positions of the working volume are performed resulting in a total of 1152 measurement samples. The FU in the RC compared with the tolerance requirements is demonstrated in Fig. 6. As it shows, the FUs captured from the mean received power are lower than the tolerance requirements in the frequency range, which proves that the proposed system has a good stirring efficiency.
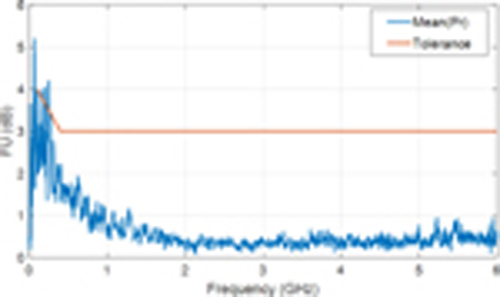
Figure 6: The FU in the RC compared with the tolerance requirements.

Figure 7: The TRP measurement scenario in an RC.
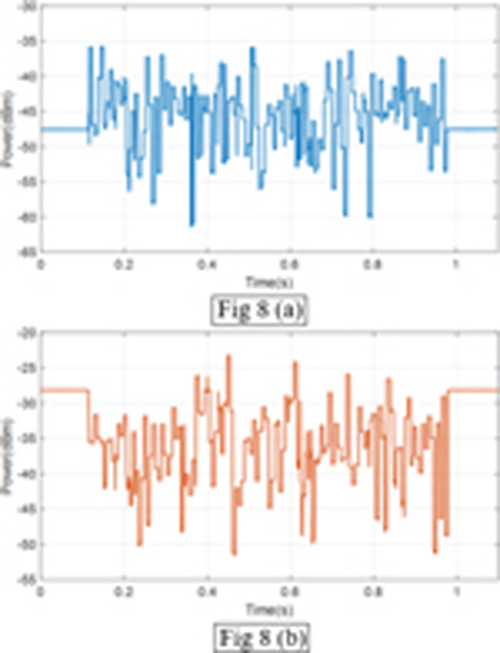
Figure 8: The received power sequence from 128 probe antennas in the RC: (a) Ref source. (b) DUT.
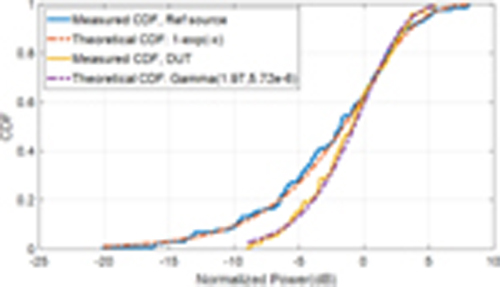
Figure 9: CDFs of the measured normalized power samples at 2.4GHz.
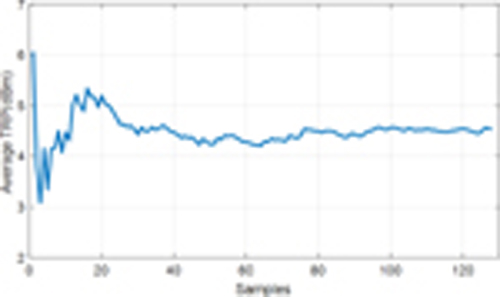
Figure 10: The average TRP at 2.4GHz, 4.56 dBm.
Figure 7 shows the TRP measurement scenario in the RC. In order to explain the calculation process of the TRP clearly, the equations are represented below in decibel (dB) unit. The reference antenna acts as a reference source with known total radiated power (). Once averaging the received power from the 128 probe antennas (), the chamber transfer function () can be obtained in dB unit [23]:
| (3) |
when the DUT transmits the signals (), a similar procedure has been performed. With the average received power of the DUT (), the can also be written in dB units:
| (4) |
thus, the TRP of the DUT can be obtained from the equation (3) and (4) in dB units:
| (5) |
We record 128 power samples at 2.4 GHz and calculate the TRP of the DUT to verify the high efficiency and accuracy of the proposed configuration. The received power samples in the switching sequence is illustrated in Fig. 8. As can be seen, the total measurement time is less than 1 second.
The cumulative density function (CDF) of the received power is shown in Fig. 9. The measured samples are normalized to the mean value. When the reference antenna is the signal transmitter, it can be considered as a single frequency source. Thus, the received power samples () is exponential distribution. The received power samples () of the DUT is gamma distribution because of the wideband radiated spectrum [23–25]. The TRP of the DUT at 2.4 GHz is also calculated and shown in Fig. 10. With the increasing of the sample number, the average TRP converges to 4.56 dBm.
IV. CONCLUSION
In this paper, we have proposed a multi-probe RC system based on a hardware-switching technique. Compared with conventional mechanical stirrers, the hardware cost is increased for small RCs, but the measurement efficiency is improved greatly. The total measurement time from 128 antennas can be shortened to less than 1 second. Two parameters of the RC and TRP of the DUT have demonstrated the validity of the proposed multi-probe system.
To maintain the measurement accuracy in each time slot, we set the interval of the shift clock to 1 ms. It should be noted that the test time can be further shortened if we decrease the interval of the hardware clock. However, the total time of 1 second is already short enough for most measurements and too short a measurement interval could lead to inaccuracy for some measurements (such as received power, throughput, bit error rate, and error vector magnitude) which require a short time average.
REFERENCES
[1] D. A. Hill, Electromagnetic Fields in Cavities: Deterministic and Statistical Theories, Wiley-IEEE, New Jersey, USA, 2009.
[2] Q. Xu and Y. Huang, Anechoic and Reverberation Chambers: Theory, Design and Measurements, Wiley-IEEE, Chichester, UK, 2019.
[3] C. L. Holloway, H. A. Shah, R. J. Pirkl, W. F. Young, D. A. Hill, and J. Ladbury, “Reverberation chamber techniques for determining the radiation and total efficiency of antennas,” IEEE Trans. Antennas Propag., vol. 60, no. 4, pp. 1758-1770, Apr. 2012.
[4] W. Xue, Y. Ren, X. Chen, Z. Wang, Y. Li, and Y. Huang, “Measurement uncertainty of antenna efficiency measured using the two-antenna method in a reverberation chamber,” Applied Computational Electromagnetics Society (ACES) Journal, vol. 36, no. 9, pp. 1152-1158, Sep. 2021.
[5] G. B. Tait, C. Hager, M. B. Slocum, and M. O. Hatfield, “On measuring shielding effectiveness of sparsely moded enclosures in a reverberation chamber,” IEEE Trans. Electromagn. Compat., vol. 55, no. 2, pp. 231-240, Apr. 2013.
[6] X. Chen, P.-S. Kildal, J. Carlsson, and J. Yang, “MRC diversity and MIMO capacity evaluations of multi-port antennas using reverberation chamber and anechoic chamber,” IEEE Trans. Antennas Propag., vol. 61, no. 2, pp. 917-926, Feb. 2013.
[7] H. G. Krauthauser, “On the measurement of total radiated power in uncalibrated reverberation chambers,” IEEE Trans. Electromagn. Compat., vol. 49, no. 2, pp. 270-279, May 2007.
[8] L. Ma, A. Marvin, Y. Wen, E. Karadimou, and R. Armstrong, “An investigation of the total radiated power of pantograph arcing measured in a reverberation chamber,” International Conference on Electromagnetics in Advanced Applications (ICEAA), Palm Beach, Aruba, pp. 550-553, 2014.
[9] F. Li, S. Huang, W. Xue, Y. Ren, and X. Chen, “Signal and coherence bandwidth effects on total radiated power measurements of LTE devices in reverberation chambers,” IEEE Transactions on Instrumentation and Measurement, vol. 71, no. 5500503, pp. 1-3, Jan. 2022.
[10] W. Xue, F. Li, X. Chen, S. Zhu, A. Zhang, and T. Svensson, “A unified approach for uncertainty analyses for total radiated power and total isotropic sensitivity measurements in reverberation chamber,” IEEE Transactions on Instrumentation and Measurement, vol. 70, no. 1003112, pp. 1-12, Jan. 2021.
[11] C. Orlenius, P.-S. Kildal, and G. Poilasne, “Measurements of total isotropic sensitivity and average fading sensitivity of CDMA phones in reverberation chamber,” IEEE Antennas and Propagation Society International Symposium, Washington, DC, USA, pp. 409-412, 2005.
[12] J. Tang, F. Li, J. Zheng, X. Chen, Y. Li, and J. Chen, “A new mode stirrer design for the reverberation chamber,” Applied Computational Electromagnetics Society (ACES) Journal, vol. 36, no. 9, pp. 1182-1188, Sep. 2021.
[13] Y. Huang and D. J. Edwards, “A novel reverberating chamber: the source-stirred chamber,” Eighth International Conference on Electromagnetic Compatibility, Edinburgh, UK, pp. 120-124, 1992.
[14] A. De Leo, G. Cerri, P. Russo, and V. M. Primiani, “Experimental comparison between source stirring and mechanical stirring in a reverberation chamber by analyzing the antenna transmission coefficient,” International Symposium on Electromagnetic Compatibility (EMC EUROPE), Amsterdam, Netherlands, pp. 677-682, 2018.
[15] A. De Leo, V. M. Primiani, P. Russo, and G. Cerri, “Optimization techniques for source stirred reverberation chambers,” International Symposium on Electromagnetic Compatibility — EMC EUROPE, Wroclaw, Poland, pp. 199-204, 2016.
[16] W. Li, C. Yue, and W. Yu, “Study on array source stirring reverberation chamber, ” Applied Computational Electromagnetics Society (ACES) Journal, vol. 29, no. 12, pp. 1067-1076, Dec. 2014.
[17] A. Cozza, “Source correlation in randomly excited complex media,” IEEE Antennas Wireless Propag. Lett., vol. 11, pp. 105-108, Jan. 2012.
[18] W. Li, C. Yue, and W. Yu, “Study on array source stirring reverberation chamber,” Applied Computational Electromagnetics Society (ACES) Journal, vol. 29, no. 12, pp. 1067-1076, Aug. 2021.
[19] D. Mandaris, R. Vogt-Ardatjew, E. Suthau, and F. Leferink, “Simultaneous multi-probe measurements for rapid evaluation of reverberation chambers,” IEEE International Symposium on Electromagnetic Compatibility and IEEE Asia-Pacific Symposium on Electromagnetic Compatibility, Suntec City, Singapore, pp. 590-594, 2018.
[20] D. Mandaris, R. Vogt-Ardatjew, M. Z. Mahfouz, E. Suthau, and F. Leferink, “Time efficient reverberation chamber performance analysis using simultaneous multiprobe measurement technique,” International Symposium on Electromagnetic Compatibility, Amsterdam, Netherlands, pp. 1-5, 2018.
[21] W. Qi, F. Fang, W. Xia, Y. Zhao, L. Xing, and Q. Xu, “A compact multi-probe reverberation chamber for over-the-air testing,” Applied Computational Electromagnetics Society (ACES) Journal, vol. 36, no. 9, pp. 1196-1201, Sep. 2021.
[22] IEC 61000-4-21, Electromagnetic Compatibility (EMC) – Part 4-21: Testing and Measurement Techniques – Reverberation Chamber Test Methods, IEC Standard, Ed 2.0, Jan. 2011.
[23] Q. Xu, W. Qi, C. Liu, L. Xing, D. Yan, Y. Zhao, T. Jia, and Y. Huang, “Measuring the total radiated power of wideband signals in a reverberation chamber,” IEEE Antennas Wireless Propag. Lett., vol. 19, no. 12, pp. 2260-2264, Oct. 2020.
[24] W. Xue, F. Li, X. Chen, and T. Svensson, “Statistical analysis of measurement uncertainty in total radiated power of wireless devices in reverberation chamber,” IET Microwaves, Antennas & Propagation, vol. 14, no. 11, pp. 1241-1245, Jun. 2020.
[25] N. Wellander, M. Elfsberg, H. Sundberg, and T. Hurtig, “Destructive testing of electronic components based on absorption cross section RC measurements,” International Symposium on Electromagnetic Compatibility — EMC EUROPE, Barcelona, Spain, pp. 778-783, 2019.
BIOGRAPHIES

Wenjun Xia received his B.Eng. degree in Electronic Information Engineering from Suzhou University of Science and Technology, Suzhou, China in 2020. He is currently pursuing a M.Eng. degree in Electromagnetic Field and Microwave Technology at Nanjing University of Aeronautics and Astronautics, Nanjing, China. His main research interests include reverberation chambers, spatial channel models, over-the-air testing, and electromagnetic compatibility.

Wenjun Qi received her B.Eng. degree and M.Eng. degree from Nanjing University of Aeronautics and Astronautics, Nanjing, China in 2018 and 2021, respectively. She is currently pursuing a PhD in Electromagnetic Field and Microwave Technology. Her main research interests include reverberation chambers, computational electromagnetics and statistical electromagnetics, over-the-air testing, and electromagnetic compatibility.

Feng Fang received his B.Eng. degree in Electromagnetic Field and Microwave Technology from Nanjing University of Aeronautics and Astronautics, Nanjing, China in 2020, where he has been currently working toward his M.Eng. His main research interests include microwave measurement techniques, reverberation chambers, and wireless communication testing, especially over-the-air testing.
Chong Li received his B.Eng. degree in Communication Engineering from Nanchang Hangkong University, Nanchang, China in 2021. He is currently pursuing a M.Eng. degree in Electromagnetic Field and Microwave Technology, Nanjing University of Aeronautics and Astronautics, Nanjing, China. His research interests include reverberation chambers, phased array systems, electromagnetic compatibility, and antenna design.

Lei Xing received her B.Eng. and M.Eng. degrees from the School of Electronics and Information, Northwestern Polytechnical University, Xi’an, China, in 2009 and 2012. She received her PhD in Electrical Engineering and Electronics at the University of Liverpool, U.K. in 2015. She is currently an Associate Professor at the College of Electronic and Information Engineering, Nanjing University of Aeronautics and Astronautics, China.

Qian Xu received his B.Eng. and M.Eng. degrees from the Department of Electronics and Information, Northwestern Polytechnical University, Xi’an, China, in 2007 and 2010, and his PhD in Electrical Engineering from the University of Liverpool, U.K. in 2016. He is currently an Associate Professor at the College of Electronic and Information Engineering, Nanjing University of Aeronautics and Astronautics, China. He was a radio frequency (RF) engineer in Nanjing, China in 2011, an Application Engineer at CST Company, Shanghai, China in 2012. His work at the University of Liverpool was sponsored by Rainford EMC Systems Ltd (now part of the Microwave Vision Group) and the Centre for Global Eco-Innovation. He has designed many chambers for industry and is the author of the book Anechoic and Reverberation Chambers: Theory, Design, and Measurements (Wiley-IEEE, 2019). His research interests include statistical electromagnetics, reverberation chambers, electromagnetic compatibility, and over-the-air testing.
ACES JOURNAL, Vol. 38, No. 1, 22–27
doi: 10.13052/2023.ACES.J.380104
© 2023 River Publishers