Non-Destructive Detection of Pipe Line Cracks Using Ultra Wide Band Antenna with Machine Learning Algorithm
B. Ananda Venkatesan and K. Kalimuthu
Department of Electronics and Communication Engineering, SRM IST, Kattankulathur, Chennai-603203, India
anandavenkatesan@gmail.com, kalimutk@srmist.edu.in
Submitted On: August 7, 2022; Accepted On: December 15, 2022
ABSTRACT
In this article, an Ultra-Wide Band (UWB) antenna for the pipeline crack detection process is proposed. A UWB antenna has been designed with the dimension of 32 x 32 mm and it resonates from 3 GHz to 10.8 GHz. The designed antenna produces a peak gain of 4.36 dB. A pair of UWB antennas are employed in various pipeline scenarios and the received pulse from antenna 1 to antenna 2 is used for further processing and detection of pipeline cracks. Through the suitable machine learning data classifier algorithm the dimension of the crack has been detected. The various features such as mean, standard deviation (), mean average deviation (mad), skewness, and kurtosis have been extracted from the received pulse. Then the three different machine learning algorithms namely Support Vector Machine (SVM), k-Nearest Neighbor (kNN), and Naïve Bayse (NB) were trained and tested using extracted features, and the dimension of the void has been identified. Out of these three machine learning algorithms, kNN provides better accuracy and precision. It predicts the small cracks with 100% accuracy having a dimension as small as 1 mm width.
Index Terms: crack detection, machine learning, pulse characteristics, UWB antenna.
1 INTRODUCTION
For most infrastructure projects metallic structure plays an important role. Excessive loading and rough environmental conditions may lead to the formation of cracks. Crack sensing is an important process in structural health monitoring that may cause mechanical failure. In the United States, water, petroleum, and natural gas are carried by buried pipelines that run approximately 11 million miles. It is accepted that there is a significant increase in the rate of failure over the 40 years. For the next 25 years, 40 trillion dollars are required to improve the road and water facilities. A report submitted by Battelle Memorial Institute estimates that 4.5 billion dollars are needed for water supply rehabilitation projects with an annual growth rate of 8-10% [1]. Triple band microstrip patch antenna has been proposed for crack detection. The resonant frequency of each band is shifted due to variations in the impedance of the antenna when the crack is present in the ground plane [2].
A compact Antipodal Vivaldi antenna designed to operate at 1 to 3 GHz is used for non-destructive testing and assessment of construction materials such as concrete and dielectric composite materials[3]. In microwave imaging, the target is subjected to an electromagnetic wave and the reflected signal is processed to reconstruct the image of the object. To detect the flaws in construction material, it is necessary to have an antenna with a high depth of penetration and high resolution. High depth of penetration is possible at relatively low frequency (1-3 GHz) and resolution is achieved using larger bandwidth [4].
The circular-shaped RFID antenna is reported for structural health monitoring. The shift in the resonant frequency is used as an important feature to detect and characterize the crack on the metallic surface. In the process of structural health monitoring, early detection of cracks is an important and challenging task. Some of the existing techniques are using of strain gauges, fiber optic sensors, and ultrasonic sensors. The disadvantage of these methods is the need for a data acquisition system, more skilled technicians, high material cost, and difficulty to deploy. These difficulties can be overcome by using sensor-based tag antennas operating in ultrahigh-frequency (UHF) regions. The formation of cracks or deformation in the structure is detected by continuously monitoring the resonant frequency of the antenna sensor [5]. An open-ended waveguide is used for surface crack detection. When the waveguide is probed over the metal surface, it acts as a short circuit in the absence of a crack. If a crack exists then the reflection characteristics of the waveguide are altered which in turn will bring the changes in the standing wave characteristics of the wave that can be probed with the aid of a diode detector. The sensitivity of this technique is relatively low and can be improved by increasing the operating frequency this may lead to highly increased complexity and cost of the measuring setup [6].
The cracks in the metal surface are detected with the help of dual characteristics resonator filters in the near field region. It will produce a 50 MHz shift in the resonant Frequency for 200 m. This method has low resolution and a need to analyze the transmission coefficient (S) for a wide range of frequencies which increases the difficulty in measurement [7]. A microstrip line excited complementary split ring resonator is used for crack detection in metallic surfaces. This method has relatively high sensitivity and can detect surface cracks as small as 100 m in length with a shift of approximately 240 MHz [8]. A microwave ring resonator that operates at 2.5 GHz is utilized for the detection of breaches in pipeline coatings. Any defect in the pipeline coating may cause a variation in the resonant frequency and bandwidth of the sensor. Failure in the detection of these defects or breaches in the early stage may lead to the spreading of cracks [9]. High sensitivity complementary split ring resonator-based sensor has been presented. This technique has advantages like spatial resolution, high sensitivity, and scalability. It can able to detect surface cracks of length 10m with a shift of 200MHz. The behavior of materials to EM waves is based on three parameters conductivity (), permittivity (and permeability (The interaction between EM waves and materials has been investigated for the detection and characterization of cracks [10]. Time domain computation has been proved as a useful tool for characterizing the electrical properties of various materials over a wide range of frequencies [11]. Ultra-wideband technology produces very narrow pulses in the order of nanoseconds [12, 13]. Due to its shorter duration high resolution and precision can be achieved in the crack detection process. This high resolution is possible even through the lossy media such as soil, foliage, wall, and floor of buildings [14].
This method examines the theoretical importance [15] of ultra-wideband signals for surface crack detection as a non-destructive testing (NDT) technique in the frequency domain (FD). The conventional frequency domain analysis of UWB signals involves the investigation of individual frequency components to cover a wide range of frequencies. This makes the NDT technique a complex and time-consuming process. An alternate approach to solve this problem is the Time Domain (TD) method in which field distribution is assumed as a general function of time [16]. The notable advantage of the TD method is its applicability to a wide range of frequencies and the ability to detect the small defects in the specimen by observing the changes in the received signals. UWB non-destructive testing is widely used to estimate the dielectric constant of the material, in the industry to detect the surface crack and to detect abnormalities in the human body in biomedicine. In the NDT technique, the metal surface is exposed to an electromagnetic field and the reflected signal is analyzed with the help of a vector network analyzer. If the crack is present on the surface of the metal, then the scattering behavior of the EM field will change in nature and this property is utilized for surface crack detection [17]. A non-symmetric circular patch antenna operating at 2.45 GHz is used to identify human ethnicity. The extracted features from the return loss are used to find the ethnicity of the human with the aid of a machine learning algorithm [18].
Ultra-Wide Band technology has some unique characteristics such as being capable to generate short pulses having nanoseconds duration, broad frequency range, and high fidelity. This makes UWB antennas a suitable candidate for various real-time applications such as medical diagnosis, ground penetration radar (GPR), detection of unexploded land mines, intrusion/suspicious detection, and identification of cracks in buildings, highway lanes, and bridges [19]. A UWB antenna has been used as the sensor to detect the discharges from the high-voltage machinery. In industries, it is necessary to monitor the partial discharge (PD) from the high voltage equipment for smooth operation. A UWB antenna operates from 1.1 to 4.5 GHz and has been used to detect PD efficiently [20].
This research article is divided into five sections. Section 1 describes Introduction of the work, antenna design is discussed in Section 2, testing procedure is explained in Section 3, detection process is elaborated in Section 4 and conclusion is given in the 5th section.
2 ANTENNA DESIGN
The final design of a UWB antenna has been obtained after three stages of evolution as shown in Fig. 1. In the first stage (Fig. 2 (a)), a planar antenna has been constructed on an FR4 substrate with a rectangular-shaped radiator and partial ground plane. This design does not produce any resonance in the required frequency band. In the next stage (Fig. 2 (b)), two square slits are made on the bottom edges of the rectangular radiator. In this stage, the antenna resonates from 3.2 GHz to 10.7 GHz. In the final stage (Fig. 2 (c)), two triangular portions are etched out from the ground plane and a slit of dimension 1 x1 mm has been introduced in the center of the ground plane, thereby capacitance between the ground plane and radiator has been decreased; the antenna resonates from 3 GHz to 10.8 GHz [21].
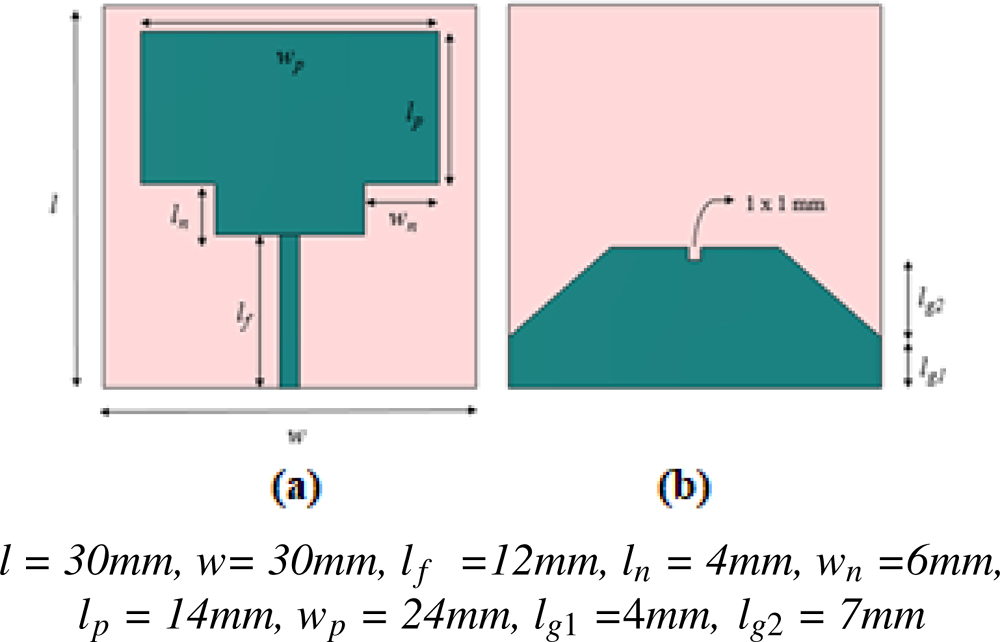
Figure 1: Schematic diagram of UWB antenna. (a) Front view. (b) Rear view.
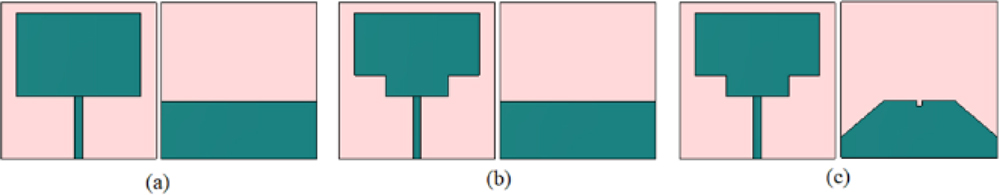
Figure 2: Evolution stages of UWB Antenna. (a) Stage 1. (b) Stage 2. (c) Stage 3.
The reflection coefficient characteristics for various stages of evolution are depicted in Fig. 3. In stage 3 the antenna reflection coefficient characteristics are less than 10dB for the entire band from 3 to 10.8 GHz.
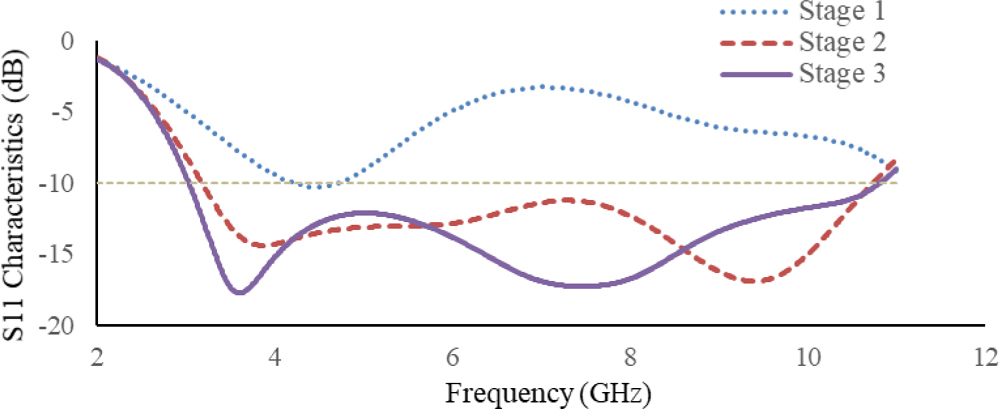
Figure 3: Reflection coefficient (S) characteristics of various Stages of evolution.
Figure 4 shows the simulated and measured reflection coefficient characteristics of the proposed UWB antenna. From the figure, it is clear that the measured result well agrees with the simulated values.
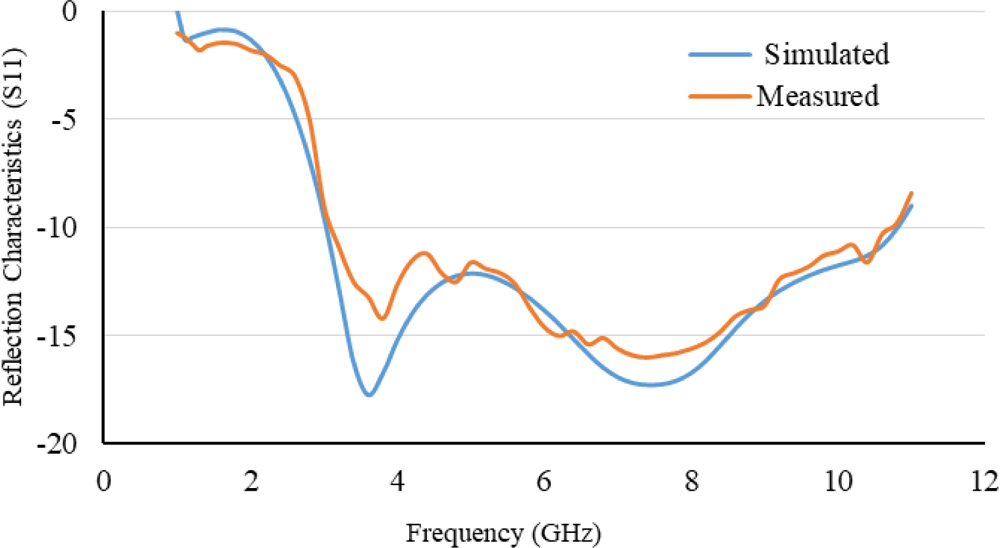
Figure 4: Simulated and Measured Reflection Coefficient (S) Characteristics.
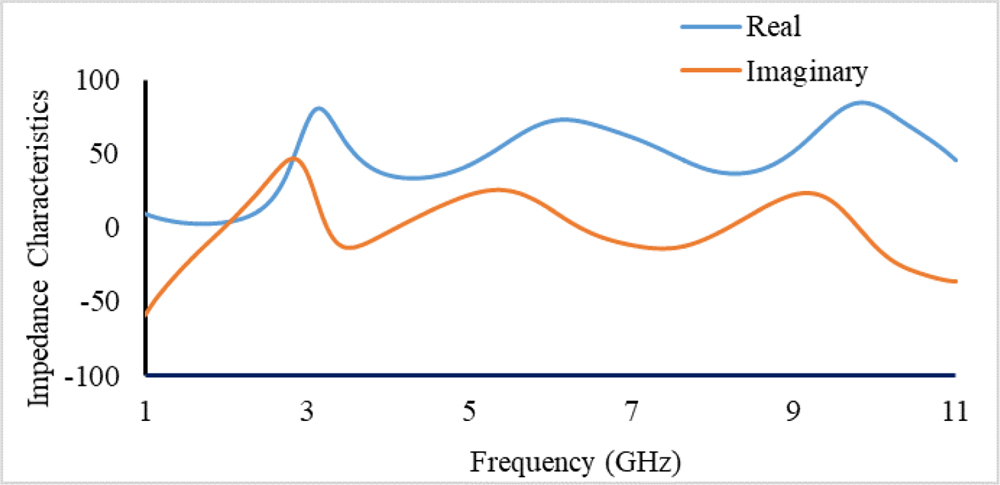
Figure 5: Real and imaginary impedance characteristics.
The real and imaginary impedance characteristics of the antenna are plotted in Fig. 5. In the operating frequency band (3-10.8 GHz), the real impedance slightly oscillates around 50 ohms and the imaginary impedance varies around zero ohms.
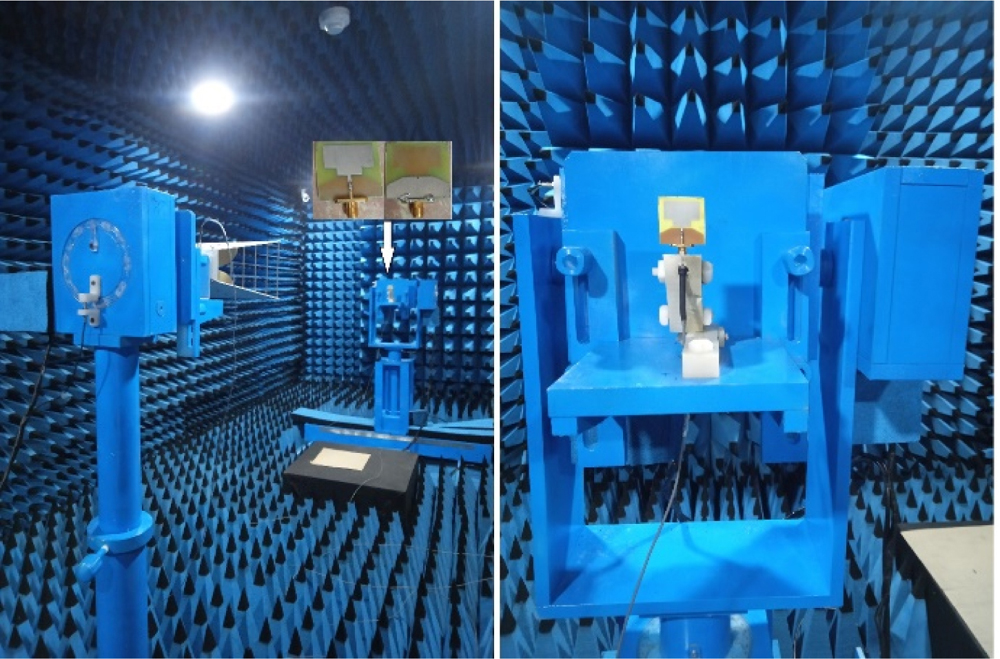
Figure 6: Radiation pattern measurement in anechoic chamber.
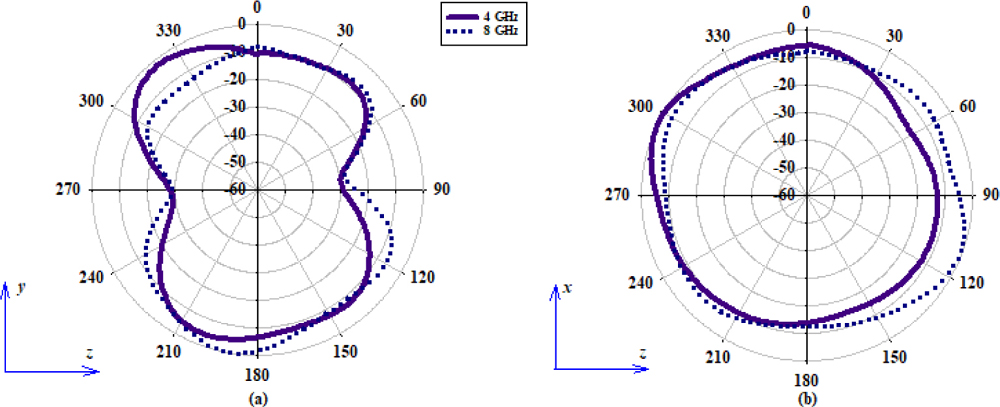
Figure 7: Measured radiation pattern of the UWB Antenna. (a) E-field pattern, = 90. (b) Ant1 H-field pattern, = 0.
The radiation pattern of the fabricated antenna is measured in an anechoic chamber as shown in Fig. 6. Fig. 7 depicts the E-plane and H-plane, radiation characteristics of an antenna at 4 and 8 GHz.
3 TESTING PROCEUDRE
The pipeline structure has been constructed [22] using a dielectric (Taconic) material which is having permittivity (=4) almost equal to the permittivity of Poly Vinyl Chloride (PVC). The pipe has been loaded with distilled water. Then the pair of UWB antennas have been used in a face-to-face configuration for collecting the time domain pulses from antenna 1 to antenna 2. The amplitude variation and distribution of the collected pulses have been utilized for the detection of cracks in the pipe [23]. The various key metrics such as mean, standard deviation, mean average deviation, skewness and kurtosis have been calculated for the obtained pulses for the identification and characterization of the cracks. Then the three different machine learning algorithms, such as the Support Vector Machine (SVM), k-Nearest Neighbours (kNN), and Naïve Bayes (NB) algorithms, have been used as data classification algorithms for detecting the presence of the cracks and predicting the width of the crack.
3.1 Feature extraction
The various key features such as the mean, standard deviation, mean average deviation, skewness, and kurtosis have been extracted from the short-duration time domain pulses and it has been used for testing and training the machine learning algorithms. These features possess information about the shape and amplitude of the pulse. The amplitude and shape of the pulse are a pure function of the permittivity of the medium through which it propagates. Because the permittivity of the medium only decides the group delay () and amount of signal absorption.
The Mean Absolute Deviation represents the distribution of the data set around the mean value. The lower value of MAD indicates that the data points are close to the mean value. It gives information about the volatility in a dataset:
| (1) |
where is the i data point, is the mean of all data point, and n is the total number of data point.
Skewness is a measure of the symmetry of data distribution. Negative skewness indicates, the data distribution is longer on the left side than on the right:
| (2) |
where, is the Skewness, N is the total number of data points in the distribution, is the ith data point, and is the mean of all data point.
Kurtosis is a statistical estimation of how data is distributed in the tail of the curve. If the kurtosis value is positive, means that data is distributed heavily on the tail side.
3.2 Machine learning algorithm
SVM is a supervised data classifier algorithm that can able to solve linear and non-linear data sets, and predicts the class of particular data. Another supervised machine learning algorithm called kNN is a non-parametric and lazy learning algorithm, which predicts the class of data points by looking at the neighboring data points. The Naïve Bayes algorithm is a probabilistic machine learning data classifier that works on the principle of Bayes probability theory. The short-time duration pulses for different pipeline environments have been collected by placing a pair of UWB antennas at certain distances with specific separation between the antennas.
The received pulse characteristics for various pipeline environments have been categorized into two groups. One set of data is used for training the data classifier algorithm and another set of data is used for testing and validation.
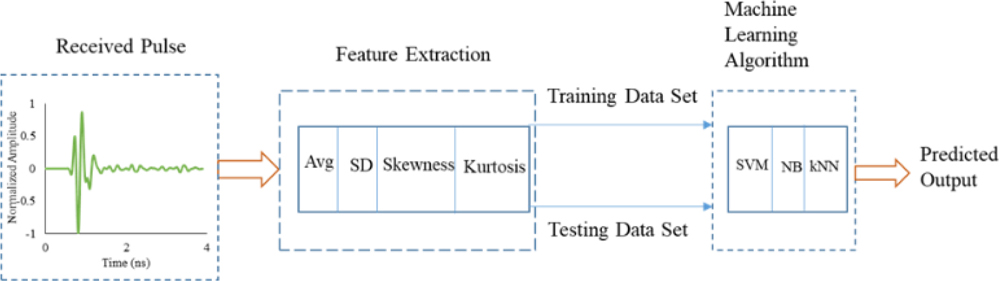
Figure 8: Proposed pipeline crack detection machine learning system model.
4 DETECTION PROCESS
The distance between the pipeline and the Antenna is referred to as “d” and the separation between the antennas is referred to as “l” as shown in Fig. 9. The distance (d) is set as 30mm and 60mm, two sets of pulse characteristics are taken. The separation (l) is varied as 40mm, 60mm, and 80mm, and three sets of received pulse characteristics are simulated. So, a total of six sets of readings are taken for one type of configuration (No crack, 1 mm, 2 mm, 5 mm, and 10mm cracks).

Figure 9: Face-to-face configuration of UWB antenna in the pipeline environment without crack.
While generating the time domain pulse characteristics the length of the crack is fixed as 10mm and the width is varied as 1mm, 2mm, 5mm, and 10mm as illustrated in Fig. 10. The time domain pulses are generated for different distances (d), separations (l) and various crack lengths have been classified into two groups of data. One set of data is used for training the classifier (SVM, kNN, Naïve Bayes) and the other set of data is used for testing and validating the correctness of the prediction.
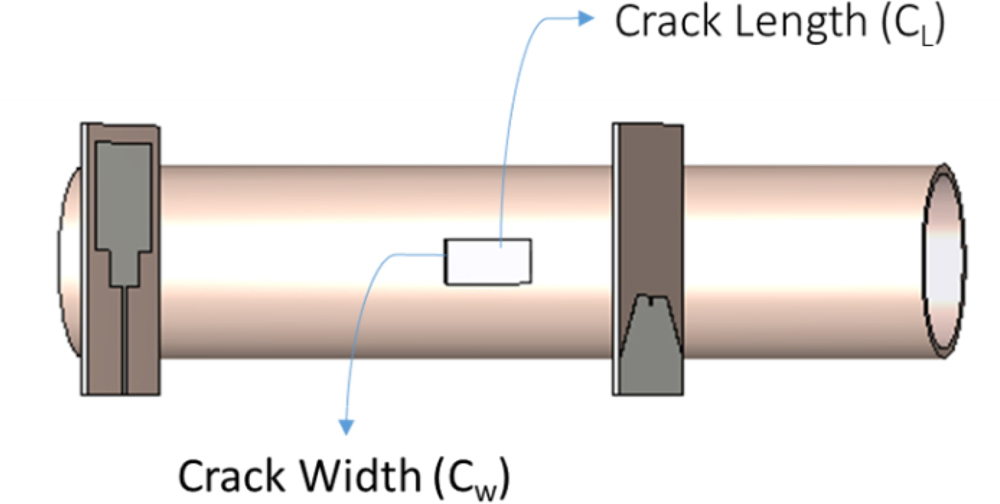
Figure 10: Face-to-face configuration of UWB antenna in the pipeline environment without crack.
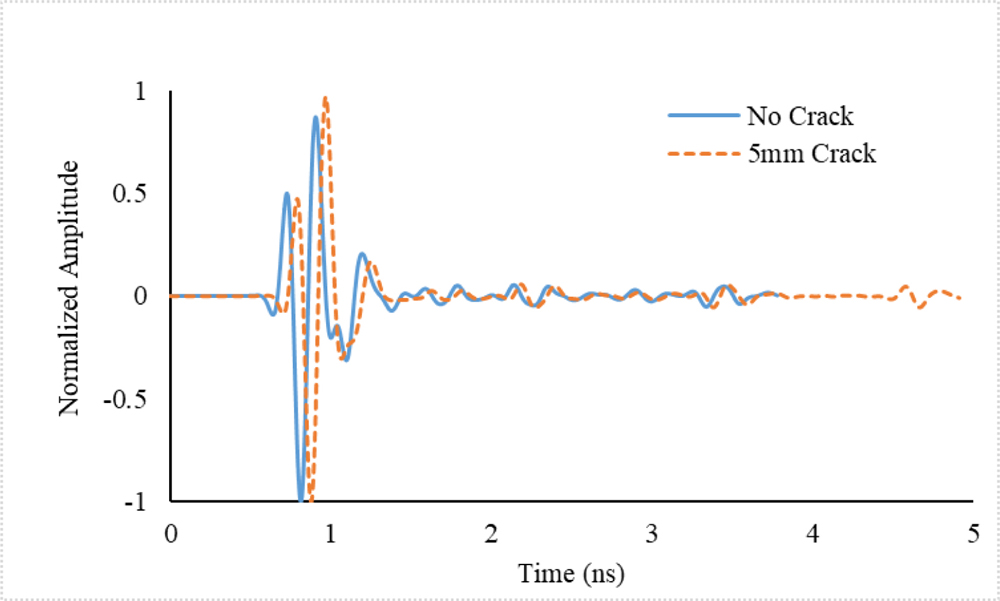
Figure 11: Received pulse characteristics of a pipeline with no crack and with a 5 mm crack.
The high spatial resolution property of the UWB signal is utilized for identifying the presence of the crack and classification of the crack width. A pair of UWB antennas are operated in various pipeline environments such as pipe without void and pipe with various void dimensions. Two antennas are placed on either side of the crack and the change in the pulse characteristics has been analyzed. The shape and amplitude of the pulse are highly dependent on the permittivity of the medium through which it propagates. If the void is present in the pipeline then the characteristics of the EM wave traveling path change, which in turn influences the shape and amplitude of the UWB pulse. The level of variation in the signal amplitude is a function of the dimension of the void as shown in Fig. 11.
| (3) |
where Z= exp (-j () d).
The time domain pulse amplitudes are labeled with unique numbers for reference. No crack, 1mm, 2mm, 5mm, and 10mm crack group pulses are labeled as numerical from 1 to 5 respectively. The data classifier algorithms (SVM, kNN, Naïve Bayes) are trained with training data sets for various crack dimensions. Then the trained data classifier algorithms are tested with the help of a separate set of time domain pulse characteristics. The correctness of the prediction for various machine learning algorithms is compared.
Table 1: Comparison between various machine learning algorithms
| Crack Width (mm) | Numerical Label | Prediction | ||
|---|---|---|---|---|
| SVM | k-NN | Naïve Bayse | ||
| No Crack | 1 | 1 | 1 | 2 |
| 1 mm | 2 | 1 | 2 | 2 |
| 2 mm | 3 | 1 | 3 | 2 |
| 5 mm | 4 | 4 | 4 | 4 |
| 10 mm | 5 | 5 | 5 | 5 |
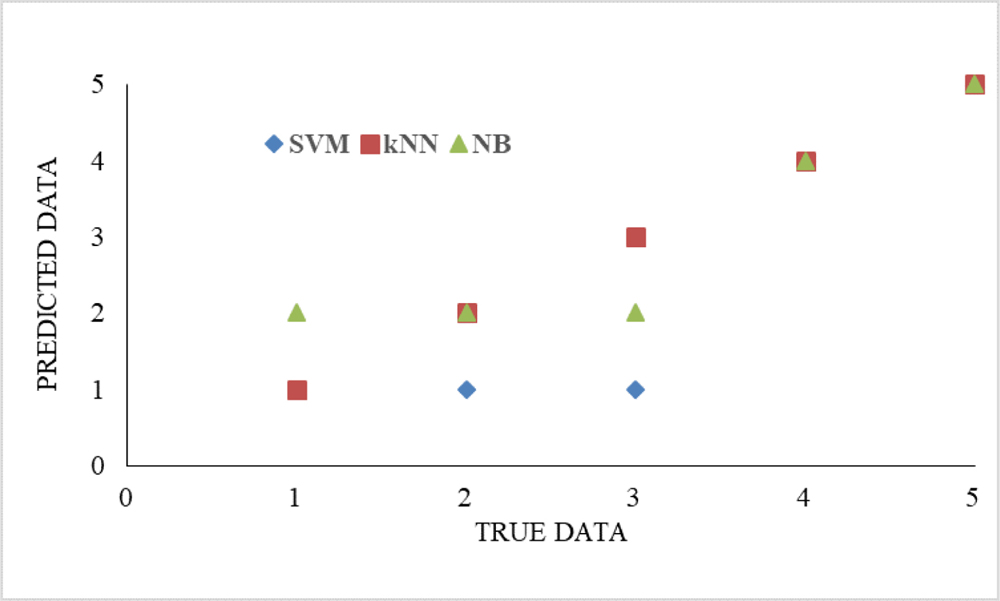
Figure 12: Received pulse characteristics of a pipeline with no crack and with a 5 mm crack.
Table 2: Comparison of the recently reported works with the proposed technique
| Ref | Antenna Type | Operating Frequency (GHz) | Dimensions (mm mm), ( ) | Parameter used for Crack Detection | Sensitivity | Requirement of Additional Processing Unit | Use of Machine Learning Algorithm |
| [2] | Triple Band Antenna | 2.687,4.997, 9.518 | 40x50, 0.36x0.45 | Shift in resonance frequency, Impedance Variation | Low | No | X |
| [3] | Antipodal Vivaldi Antenna | 1to 30 | 96x100, 0.32x0.33 | Image Construction | Moderate | Yes | |
| [4] | RFID Antenna | 1.285 | 35x35, 0.15x0.15 | Shift in resonance frequency | low | No | X |
| [5] | Wave Guide | 24 | — | Changes in Standing Wave Pattern | High | Yes | |
| [6] | Resonator Filter | 8.08 to 13.557 | 25.4x25.4, 0.69x0.69 |
Shift in resonance frequency | High | No | X |
| [7] | Complementary Split Ring Resonator | 5GHz | 3x3, 0.05x0.05 | Shift in resonance frequency | High | No | X |
| [8] | Ring Resonator | 2.5 | — | Shift in resonance frequency, Change in quality factor | High | No | X |
| [9] | Complementary Split Ring Resonator | 9.8GHz | 3x3, 0.1x0.1 | Shift in resonance frequency | Very High | No | X |
| Proposed | UWB Antenna | 3-10.8 | 32x32, 0.32x0.32 | Variation in Pulse Receiving Characteristics | Moderate | No |
The proposed research finding is compared with the already presented works in Table 2 and the key merits of this work are summarized as follows:
Pair of planar monopole UWB antennae works at 3 to 10.8 GHz and is used for crack detection in pipelines. It has a simple design, easy to fabricate, and low cost.
The crack is detected by investigating the received UWB time domain pulses.
The various key of the received pulses has been extracted, which has been used to train and test the different machine learning algorithms.
This method does not require any additional processing unit for analyzing the data.
The presence of crack has been detected in a non-destructive manner with the hybrid combination of UWB Antenna with a machine learningalgorithm.
5 CONCLUSION
An ultra-wideband antenna that operates from 3 to 10.8 GHz has been used for pipeline crack detection. A pair of UWB antennas are used in various pipeline scenarios. One antenna is used as a transmitter and another one is used as a receiver. The time domain pulses received by the receiving antenna have been utilized for the detection and characterization of the cracks in the pipe. The shape and the amplitude of the received pulse will vary depending on the medium (permittivity ) through which it propagates. For the received pulse various features such as mean, standard deviation, skewness, and kurtosis have been calculated. The three different supervised machine learning algorithms such as SVM, kNN, and NB are used for the prediction of crack dimension. These Machine learning algorithms are trained with one set of pulse features and tested with different data set. All three algorithms can predict and differentiate cracks having a width of 5 mm. However, the kNN algorithm provides better prediction with 100% accuracy and can differentiate small cracks having a width as small as 1 mm.
REFERENCES
[1] A. Jaganathan, E. Allouche, and S. Neven, “Numerical modeling and experimental evaluation of a time domain UWB technique for soil void detection,” Tunnelling and Underground Space Technology, vol. 25, pp. 652-659, 2010.
[2] H. Andre, P. Emeraldi, R. Fernandez, M. Muharam, Firdaus, and E. P. Waldi, “Triple band circular microstrip antenna for metallic material crack sensing,” International Conference on Applied Science and Technology, Manado, Indonesia, pp. 373- 374, 2019.
[3] X. R. Wang, X. B. Wang, H. Ren, N. S. Wu, J. W. Wu, W. M. Su, Y. L. Han, and S. Xu “Optically transparent microwave shielding hybrid film composited by metal mesh and graphene,” Progress In Electromagnetics Research, vol. 170, pp. 187-197, 2021.
[4] M. Moosazadeh, S. Kharkovsky, J. T. Case, and B. Samali, “Miniaturized UWB antipodal vivaldi antenna and its application for detection of void inside concrete specimens,” IEEE Antennas and Wireless Propagation Letters, vol. 16, pp. 1317-1320, 2016.
[5] C. Wang, C. Wang, G. C. Wan, M. S. Tong, S. Guan, and L. Y. Xie, “RFID antenna sensor for quantitatively monitoring surface crack growth,” IEEE International Conference on Computational Electromagnetics (ICCEM), Shanghai, China, pp. 1-3, 2019.
[6] C. Y. Yeh and R. Zoughi, “A novel microwave method for detection of long surface cracks in metals,” IEEE Transactions on Instrumentation and Measurement, vol. 43, no. 5, pp. 719-725, Oct. 1994.
[7] J. Kerouedan, P. Quéffélec, P. Talbot, C. Quendo, S. De Blasi, and A. Le Brun, “Detection of micro-cracks on metal surfaces using near-field microwave dual-behavior resonator filters,” Measurement Science and Technology, vol. 19, no. 10, 2008.
[8] A. M. Albishi, M. S. Boybay, and O. M. Ramahi, “Complementary split-ring resonator for crack detection in metallic surfaces,” IEEE Microwave and Wireless Components Letters, vol. 22, no. 6, pp. 330-332, 2012.
[9] M. H. Zarifi, S. Deif, M. Abdolrazzaghi, B. Chen, D. Ramsawak, M. Amyotte, N. Vahabisani, Z. Hashisho, W. Chen, and M. Daneshmand, “A microwave ring resonator sensor for early detection of breaches in pipeline coatings,” IEEE Transactions on Industrial Electronics, vol. 65, no. 2, pp. 1626-1635, 2018.
[10] A. M. Albishi and O. M. Ramahi, “Surface crack detection in metallic materials using sensitive microwave-based sensors,” IEEE 17th Annual Wireless and Microwave Technology Conference (WAMICON), pp. 1-3, 2016.
[11] C. L. Bennett and G. F. Ross, “Time-domain electromagnetics and its applications,” Proceedings of the IEEE, vol. 66, no. 3, pp. 299-318, 1978, doi: 10.1109/PROC.1978.10902.
[12] S. Mohandoss, S. K. Palaniswamy, R. R. Thipparaju, M. Kanagasabai, B. R. B. Naga, and S. Kumar, “On the bending and time domain analysis of compact wideband flexible monopole antennas,” International Journal of Electronics and Communications, vol. 101, pp. 168-181, 2019.
[13] S. R. Zahran, M. A. Abdalla, and A. Gaafar, “Time domain analysis for foldable thin UWB monopole antenna,” International Journal of Electronics and Communications, vol. 83, pp. 253-262, 2018.
[14] Y. Rahayu, T. A. Rahman, R. Ngah, and P. S. Hall, “Ultrawide band technology and its applications,” International Conference on Wireless and Optical Communications Network, Surbaya, pp. 1-5,2008.
[15] M. Bozorgi and A. Tavakoli, “Polarimetric scattering from a 3-D rectangular crack in a PEC covered by a dielectric layer,” American Computation Electromagnetics Society (ACES) Journal, vol. 26, no. 6, pp. 502-511, 2022.
[16] X. Han, H. Li, Y. Zhou, L. Wang, S. Liang, and F. Javaid “An elliptically polarized wave injection technique via TF/SF boundary in subdomain level DGTD method,” Progress in Electromagnetics Research, vol. 175, pp. 13-27, 2022.
[17] A. Mirala and R. Sarraf Shiraz, “Detection of surface cracks in metals using time domain microwave non-destructive testing,” IET Microwaves, Antennas & Propagation, vol. 11, pp. 564-569, 2017.
[18] W. Saadat, S. A. Raurale, G. A. Conway, and J. McAllister, “Wearable antennas for human identification at 2.45 GHz,” IEEE Transactions on Antennas and Propagation, vol. 70, no. 1, pp. 17-26, 2022.
[19] X. He and T. Jiang, “Target identification in foliage environment using UWB radar with hybrid wavelet-ICA and SVM Method,” Physical Communication, vol. 1, pp. 197-204, 2014.
[20] J. P. Uwiringiyimana, U. Khayam, Suwarno, and G. C. Montanari, “Design and implementation of ultra-wide band antenna for partial discharge detection in high voltage power equipment,” IEEE Access, vol. 10, pp. 10983-10994, 2022.
[21] E. Zhou, Y. Cheng, F. Chen, H. Luo, and X. Li, “Low-profile high-gain wideband multi-resonance microstrip-fed slot antenna with anisotropic meta surface,” Progress in Electromagnetics Research, vol. 175, pp. 91-104, 2022.
[22] F. Jiang, S. Liu, and L. Tao, “Quantitative research on cracks in pipe based on magnetic field response method of eddy current testing,” American Computation Electromagnetics Society (ACES) Journal, vol. 36, no. 1, pp. 99-107, 2021.
[23] F. Deek and M. E. Shenawee, “Microwave detection of cracks in buried pipes using the complex frequency technique,” American Computation Electromagnetics Society (ACES) Journal, vol. 25, no. 10, pp. 894-902, 2010.
BIOGRAPHIES

B. Ananda Venkatesan is currently working towards a Ph.D. degree at SRMIST, Chennai. His research interests include planar antennas, machine learning, and signal processing.

K. Kalimuthu was born in india. He has completed his Ph.D. degree in Cognitive Radio from the ECE Department of SRMIST Chennai. Currently, he is working as an Associate professor in the Department of ECE, SRMIST, Chennai. His research interests include wireless communication, antennas, signal processing, and cognitive radio networks.
ACES JOURNAL, Vol. 37, No. 11, 1131–1138
doi: 10.13052/2022.ACES.J.371103
© 2022 River Publishers