A Noninvasive Method for Measuring the Blood Glucose Level Using a Narrow Band Microstrip Antenna
Ayman R. Megdad, Rabah W. Aldhaheri, and Nebras M. Sobahi
Department of Electrical and Computer Engineering, King Abdulaziz University, Jeddah, 21589, Saudi Arabia
A.mkdad93@gmail.com, Raldhaheri@kau.edu.sa, Nsobahi@kau.edu.sa
Submitted On: August 23, 2022; Accepted On: January 4, 2023
ABSTRACT
In this paper, a narrowband and compact antenna resonating at 6.1 GHz with a peak realized gain of 3.3 dBi is proposed to monitor the glucose concentration in the blood without taking invasive blood samples. The proposed antenna is fabricated using a low-cost FR-4 substrate with compact dimensions of 30 mm 30 mm 1.6 mm. The impedance bandwidth of this antenna ranges from 5.2 to 7.1 GHz. For measuring blood glucose levels, a human finger phantom model with dimensions of 15 mm 12 mm 10 mm is constructed using the EM simulation (HFSS) environment. The finger phantom consists of different layers such as skin, fat, muscle, blood, and bone modeled at 6.1 GHz using various dielectric materials for various glucose concentrations. The finger phantom model is placed at different locations around the antenna to measure the frequency shift for monitoring glucose concentration in blood samples. The proposed finger phantom model is validated by conducting an experimental study by placing a real human finger around the fabricated antenna and measuring the frequency shift. This study shows a very good agreement with the results obtained by the simulated phantom model. The advantages and outperformance of the proposed sensor are highlighted in terms of the sensitivity obtained and compared with other techniques given in the literature.
Index Terms: glucose levels, directional antenna, non-invasive, narrow band antenna.
1 INTRODUCTION
In most cases, diabetes is caused by very high levels of glucose in the blood over a prolonged period, which is the primary feature of diabetes [1–2]. According to the World Health Organization (WHO) and the International Diabetes Federation (IDF), there are 463 million individuals worldwide who have diabetes, with more than 60 percent of the population living in the “risk zone.” It is recommended that this identification be performed at frequent intervals to improve the accuracy of the results. The detection of diabetics may be accomplished with the use of finger prick tests and glucose meters [3–4], although this approach is considered intrusive. It is occasionally necessary to sandwich the liquid under investigation between two microstrip resonators. On the other hand, invasive procedures hurt the patient because blood samples must be taken often.
As reported in [5], a band-stop filter with a defective ground structure (DGS) was employed to monitor glucose levels intravenously. Furthermore, the sensitivity to changes in glucose levels in blood samples as well as the depth of penetration is lower than previously reported. However, when it comes to testing blood sugar levels, various options are discussed [6–12]. Furthermore, several innovative microwave sensors were presented by Lukas in [13], and another pressure sensor was proposed by Satish in [14]. A technique for determining glucose levels was developed by Deshmukh, and Ghongade, who used a ring resonator to calculate the dielectric properties and estimate the glucose levels [15]. The authors of [16] addressed the measurement of glucose in the presence of animal tissues by utilizing mm-wave methods in the presence of animal tissues. In addition, in [17–23], numerous innovative approaches for more accurately calculating glucose concentration in blood samples were reported.
Microwave filters or antennas are employed for monitoring glucose levels in the blood [24–25]. This is a non-invasive technology that has been developed. Their great sensitivity to minor fluctuations in glucose levels, as well as their simplicity of deployment, make antenna systems the most common of all non-invasive glucose monitoring technologies. [26–28]. Furthermore, since they do not ionize, they penetrate deeply, are resistant to noise, temperature, and other disturbances, and are widely used in the medical area as well as other fields. The authors of [26] developed an artificial hand with a finger phantom and used it to compute glucose concentrations in blood samples by simulating S-parameters and evaluating the dependence of frequency shift on dielectric parameters. The antenna that has been created functions at frequencies ranging from 1 to 6 GHz. However, because of the omnidirectional radiation pattern produced by this antenna, it is not recommended for practical use. Ref [27] describes the construction of a patch antenna that can operate at 2.4 and 5.8 GHz and is filled with deionized water and glucose for use in medical applications. The antenna match was altered in response to changes in glucose levels. Ref. [28] describes the development of phantom-loaded patch components for use in an antenna operating at a frequency of 4.75 GHz. A range of liquid phantoms, including pig blood and physiological solutions, were evaluated, with glucose levels ranging from 150 mg/dL to 550 mg/dL in the samples analyzed. The solution induced a linear change in frequency of 5 MHz, which was observed. Even though the temperature and volume of the test samples varied, there was no link between the readings. Meta-materials can also be utilized to detect glucose, as described in [29]. Recent review papers explain in detail the current state of research on glucose level monitoring sensors and the need to build more sensitivesensors [30–38].
To monitor glucose levels, a microstrip antenna is used as a microwave sensor operating at 6.1 GHz. Furthermore, a human finger phantom is designed with a length of 15 mm, a height of 10 mm, and a width of 12 mm, with layers of skin, fat, muscle, blood, and bone. However, the key innovation of this study is that the proposed antenna produces a significant frequency change when a finger phantom is placed on it to measure glucose levels.
The remainder of the paper’s structure is as follows: In Section 2, the microstrip antenna structure, design method, and parametric study are described. Section 3 presents results and discussion, including the modeling of a finger phantom and an associated study on frequency shifts for different positions of the finger phantom and varying glucose levels. In Section 4, the paper is concluded.
2 ANTENNA STRUCTURE
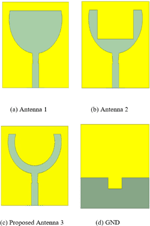
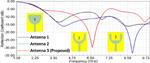
The proposed antenna is designed and optimized using the ANSOFT HFSS electromagnetic simulator. Figure 1 illustrates the evolution of the antenna design until we reach the final proposed antenna (Antenna 3). As is customary in antenna design, Antenna 1 is designed by doing an initial theoretical calculation to determine the dimensions of the initial antenna, as seen in Fig. 1. The first antenna has a half-elliptic shaped and is fed by a 50-ohm feedline with a partial ground plane on the substrate’s back side. The current distribution of antenna 1 is depicted in Fig. 2, where the current distribution is minimal in the patch’s central half. As a result, this portion can be removed, and then a rectangular and half-elliptic slot is etched in the middle, as shown in Fig. 1 (b) and Fig. 1 (c). This rectangular and half-elliptic slot is responsible for shifting the resonant frequency, as explained below. In the next step, to obtain one resonant frequency, a rectangular cut-out in the upper center of the ground is constructed for all designs, as illustrated in Fig. 1 (d). From the reflection coefficient values plotted for all the three antennas given in Fig. 3, it is observed that antenna 3 gives the desired resonant band from 5.2 to 7.1 GHz with a resonant frequency of 6.1 GHz, which is the required frequency for glucose monitoring in blood samples. Hence, antenna 3 is considered the proposed antenna to meet the target application (glucose monitoring).
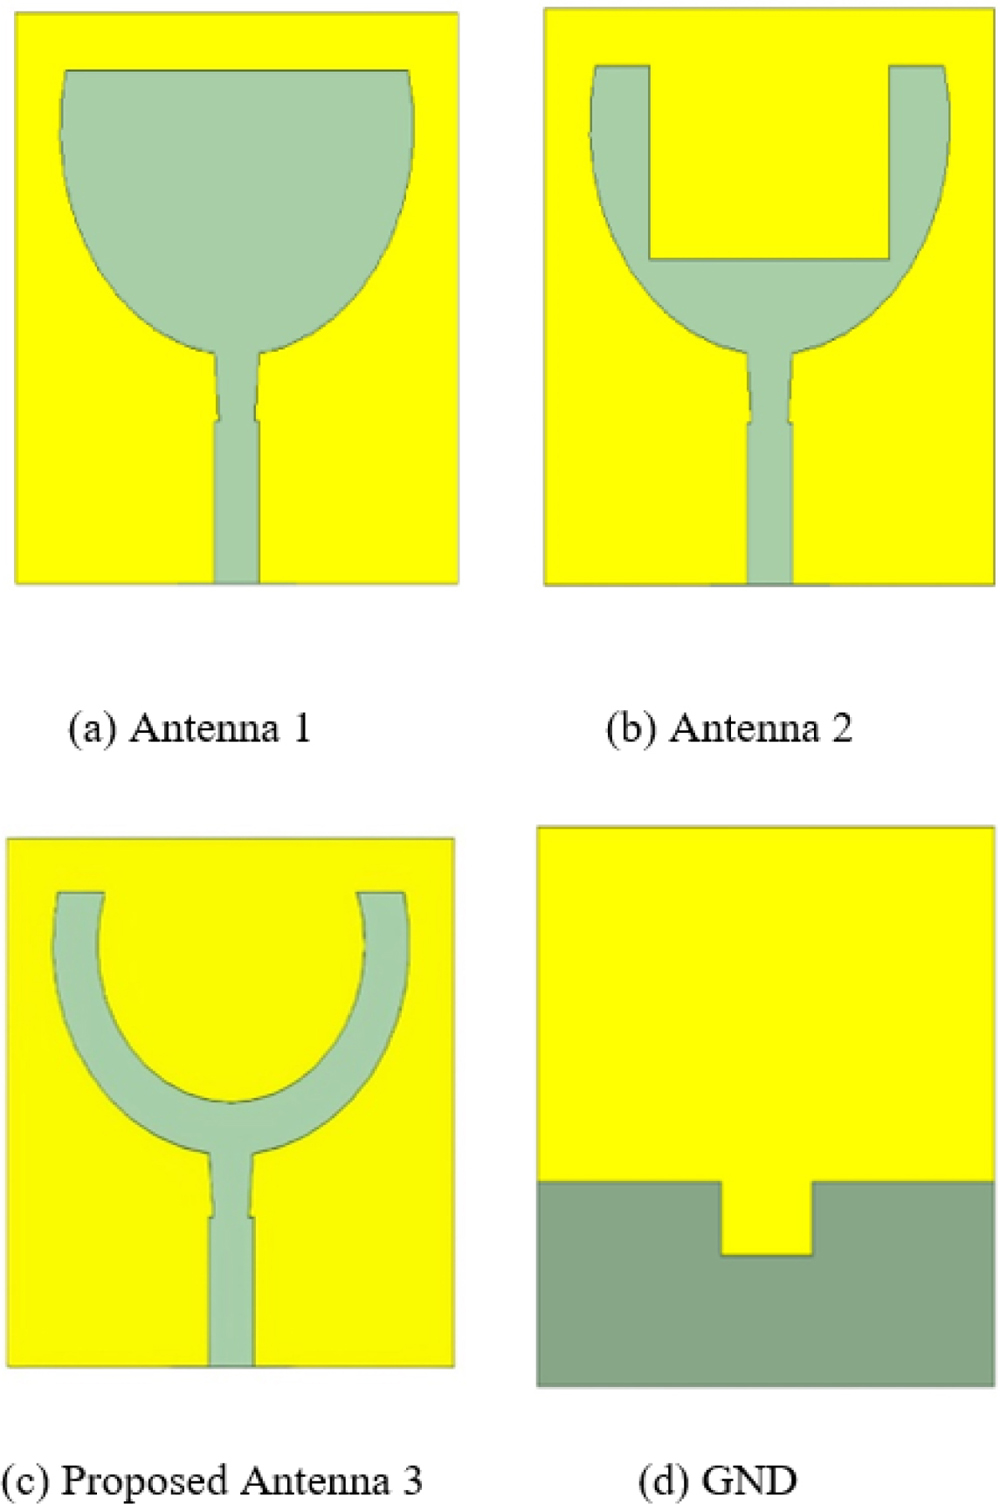
Figure 1: Evolution of the proposed antenna. (a-c) Top views of Antennas 1, 2, and 3. (d) Bottom view.
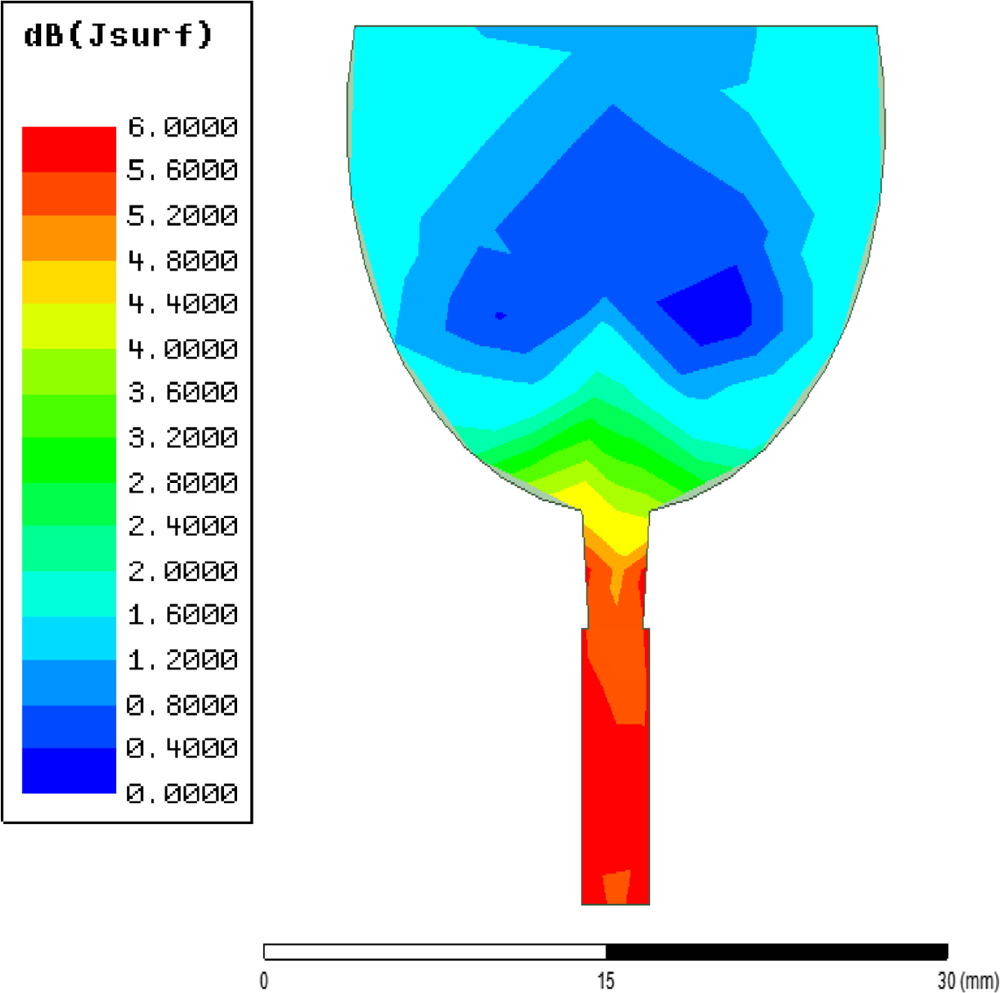
Figure 2: Current distribution of Antenna 1 at 6 GHz.
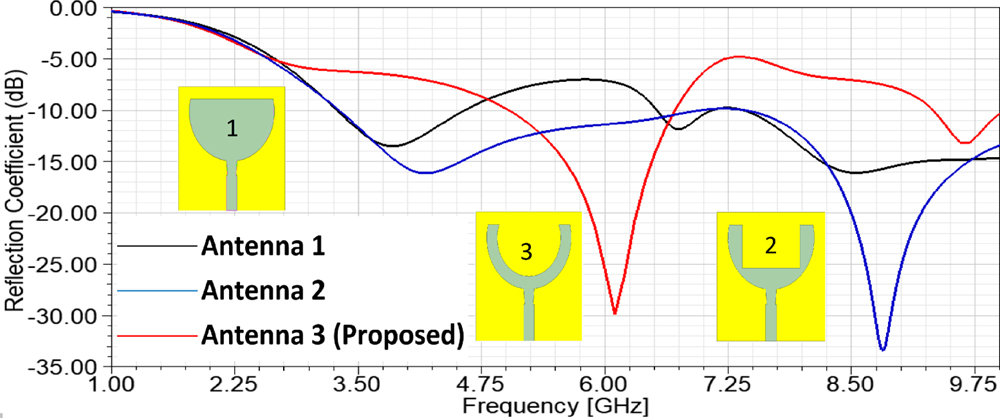
Figure 3: Simulated reflection coefficient of Antenna 1, Antenna 2, and Antenna 3.
2.1 Design procedure of the proposed antenna
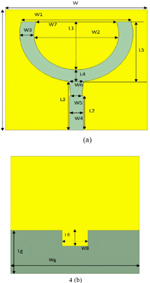
Figure 4 depicts the schematic view of the proposed antenna. The antenna is made from an FR4 substrate with a relative permittivity of 4.4, a thickness of 1.6 mm, and a loss tangent of 0.02. To achieve a 50-Ohm input impedance match, a rectangular and trapezoidal-shaped feed is employed to feed the antenna. The antenna consists of a rectangular ground plane with a rectangular cut-out in the top center of the ground, as seen in Fig. 4 (b), and a half-ellipse with a major radius W2 and minor radius L1, as shown in Fig. 4 (a).
The antenna is a planar patch antenna with a U-shaped patch. The optimized element dimensions are listed in Table 1, and the antenna is optimized to operate at 6.1 GHz. The U-shaped design has a critical role to play in achieving desired radiation properties with enhanced gain, which is the primary characteristic required for estimating the glucose level. The half-elliptic slot is etched away from the radiating area, and this is used for shifting the band characteristics for monitoring glucose levels.

Figure 4: Geometry of proposed antenna, (a) Top view. (b) Back view.
2.2 Parametric study
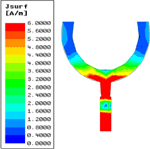
Figure 5 depicts the finalized antenna structure’s surface current distributions. At 6.1 GHz, it is seen that a significant number of current flows through the patch, indicating that this antenna is a good radiator at the selected frequency. A parametric study on various dimensions of the antenna is performed to characterize the antenna’s radiating behavior.

Figure 5: Current distribution of proposed antenna at 6.1 GHz.
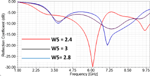
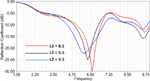
The parametric analysis is performed concerning the parameters W2, W5, and L2 of half-elliptic slots, as shown in Figs. 6, 7 and 8 respectively. From Fig. 6, it is observed that better reflection coefficient values are obtained for W2 = 18 mm. Similarly, from Fig. 7, it is observed that W5 = 2.4 mm yields good reflection coefficient values. Similarly, from Fig. 8, it is observed that good reflection coefficient values in the desired band are obtained for L2 = 8.5 mm. The final results of the optimal parameters are listed in Table 1.
Table 1: Dimensions of the Proposed Antenna
| Parameters | Dimension (mm) |
|---|---|
| L | 30 |
| W | 30 |
| Lg | 11 |
| Wg | 30 |
| W1 | 23.24 |
| W2 | 18 |
| W3 | 3.12 |
| W4 | 3 |
| W5 | 2.4 |
| W6 | 3 |
| W7 | 17 |
| W8 | 6 |
| L1 | 11.88 |
| L2 | 8.5 |
| L3 | 12 |
| L4 | 3.12 |
| L5 | 15 |
| L6 | 4 |
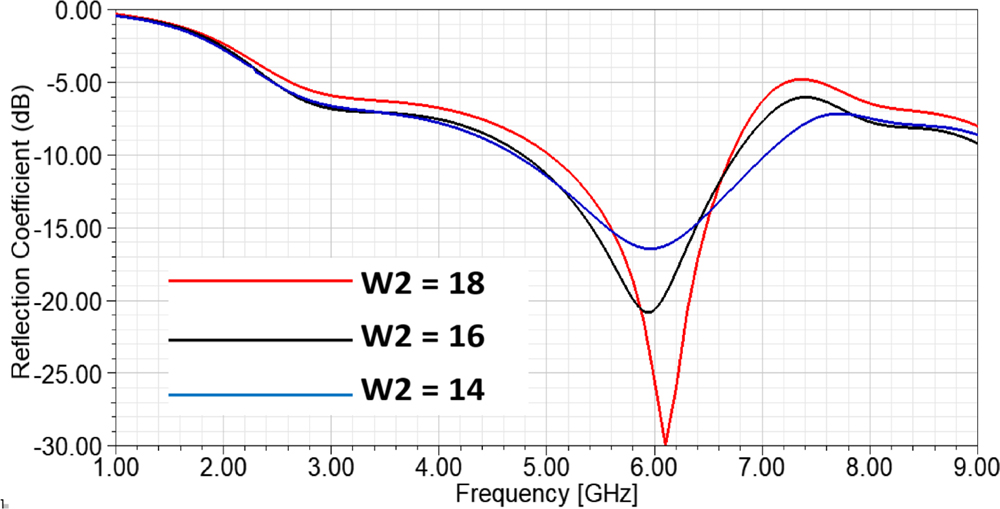
Figure 6: Parametric analysis w.r.t. W2.
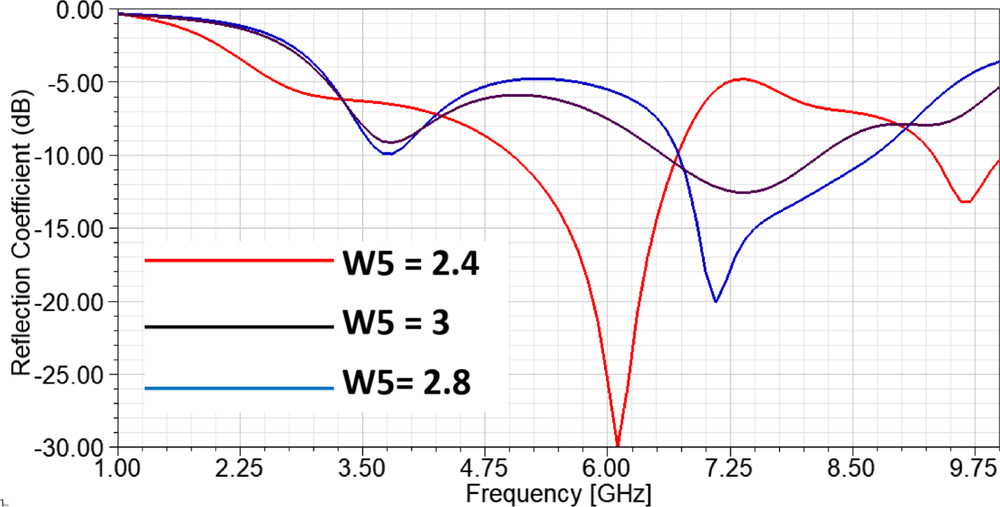
Figure 7: Parametric analysis w.r.t. W5.
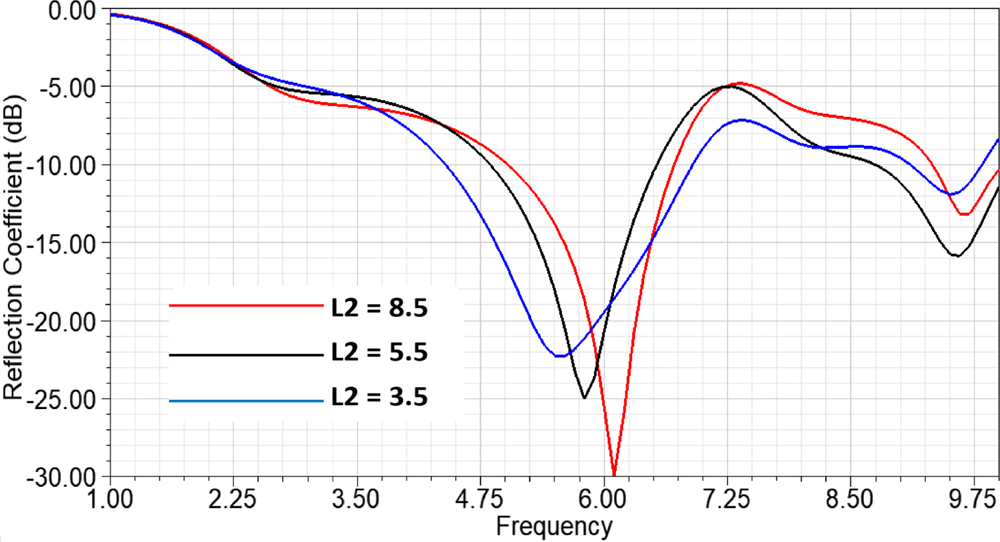
Figure 8: Parametric analysis w.r.t. L2.
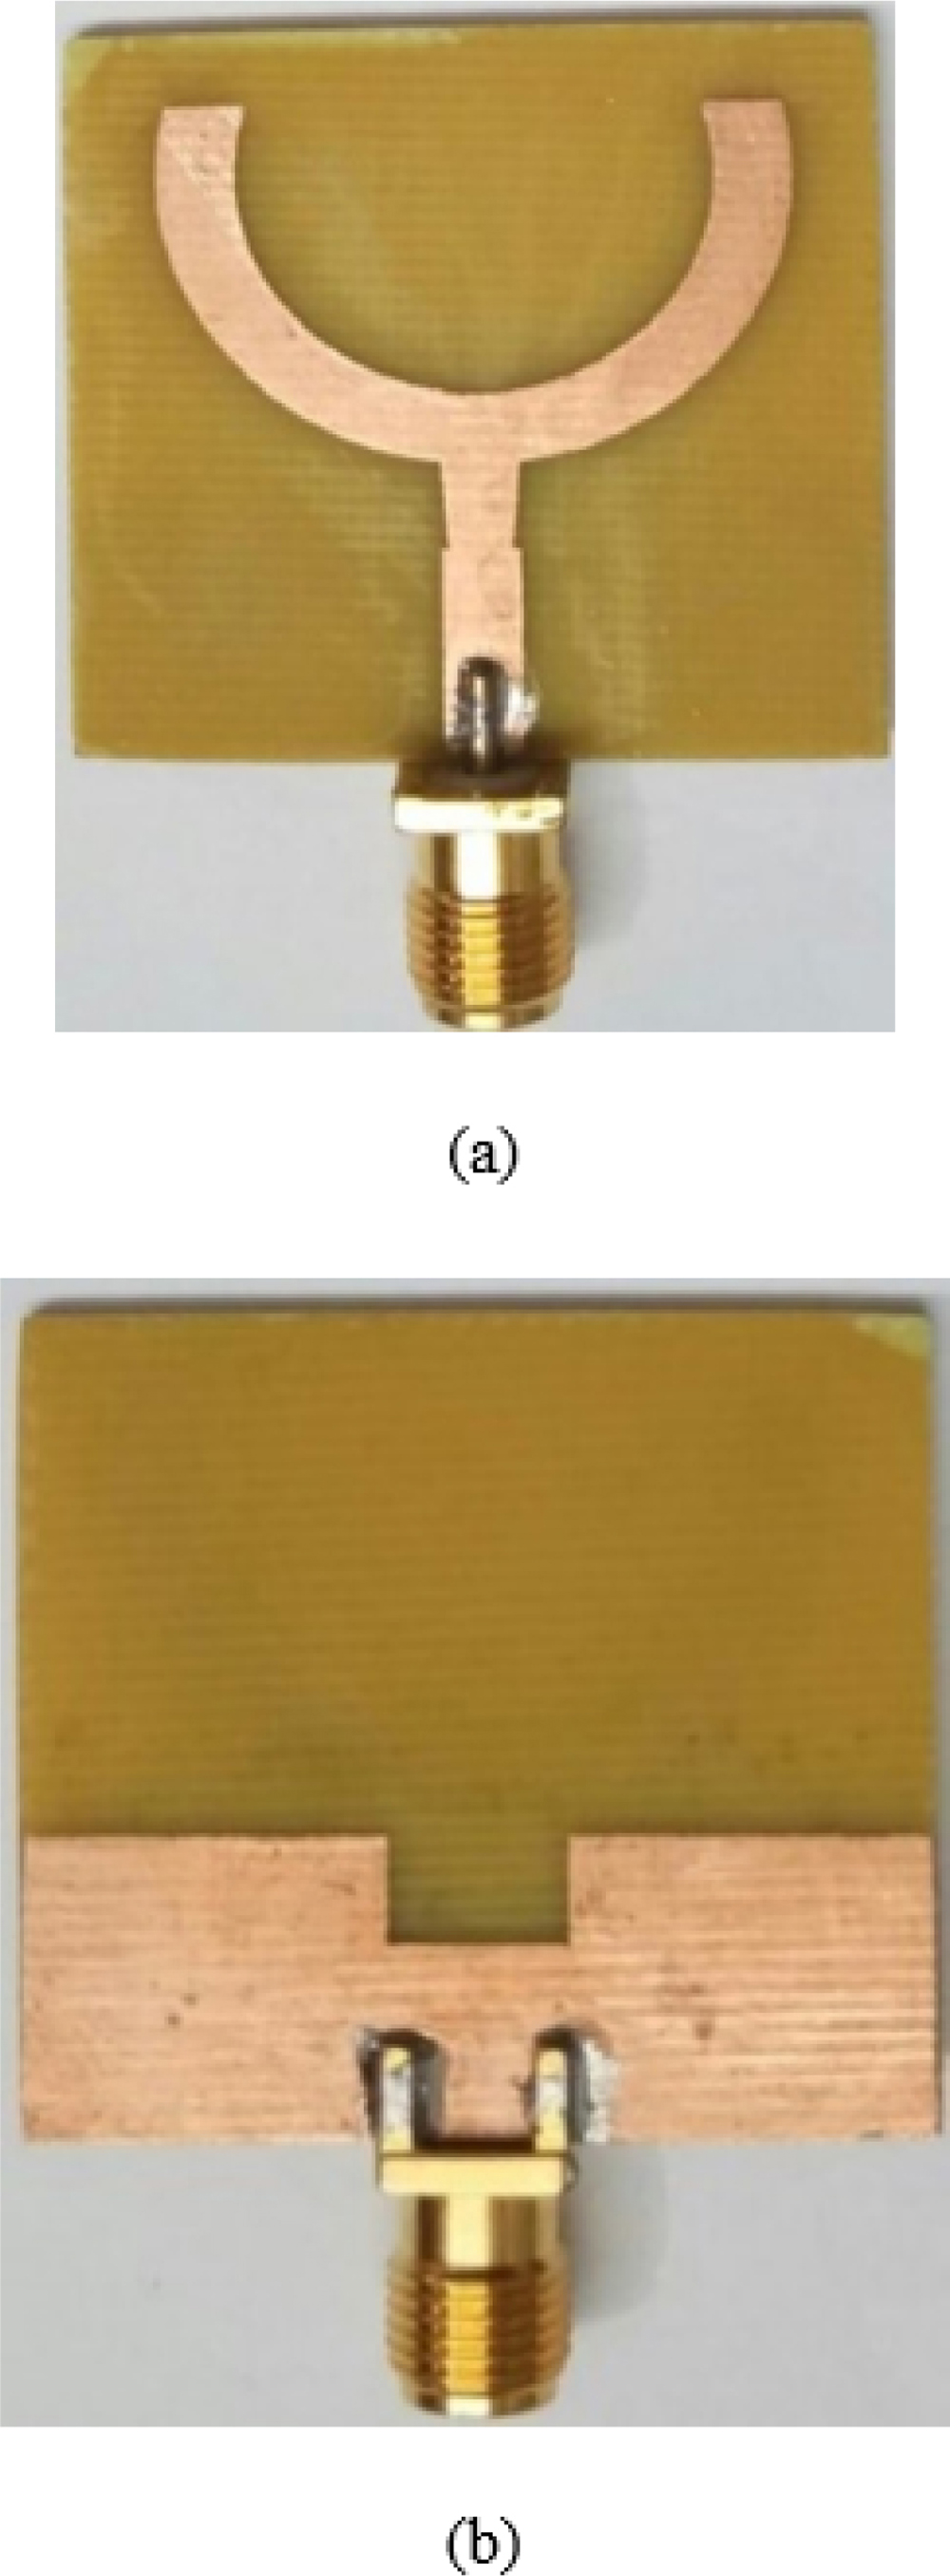
Figure 9: Fabricated Prototype of the proposed antenna (a) Top view. (b) Bottom view.

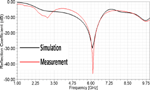
Figure 10: Simulated and measured S11 parameters of the proposed antenna.
3 RESULTS AND DISCUSSION
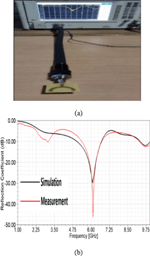
The proposed antenna is manufactured and tested to evaluate the performance of the optimized antenna. The prototype of the fabricated antenna is given in Fig. 9. The reflection coefficient and radiation patterns of the proposed antenna are measured using the Vector Network Analyzer (VNA) N5225A. Figure 10 shows the simulated and measured S-parameters of the proposed antenna, showing the antenna resonating at 6.1 GHz. The simulated results are found to be in good agreement with the measured results. The slight variation between the results is due to the fabrication tolerances at the feed location.
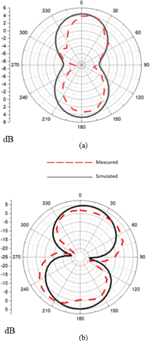
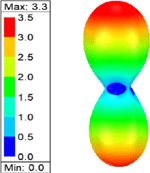
Figure 11 illustrates the simulated and measured E-plane and H-plane radiation patterns at 6.1 GHz, respectively. From the resulting radiation patterns, it can be observed that the antenna is oriented towards 90 degrees on the E-plane, as shown in Fig. 11 (a), and that the radiation is almost omnidirectional on the H-plane, as shown in Fig. 11 (b). The three-dimensional radiation pattern created by the antenna is seen in Fig. 12. The antenna has strong directional qualities at 6.1 GHz with a realized gain of 3.3 dBi, which is good enough to attribute to employing this antenna for monitoring the concentration of glucose in the finger phantoms.
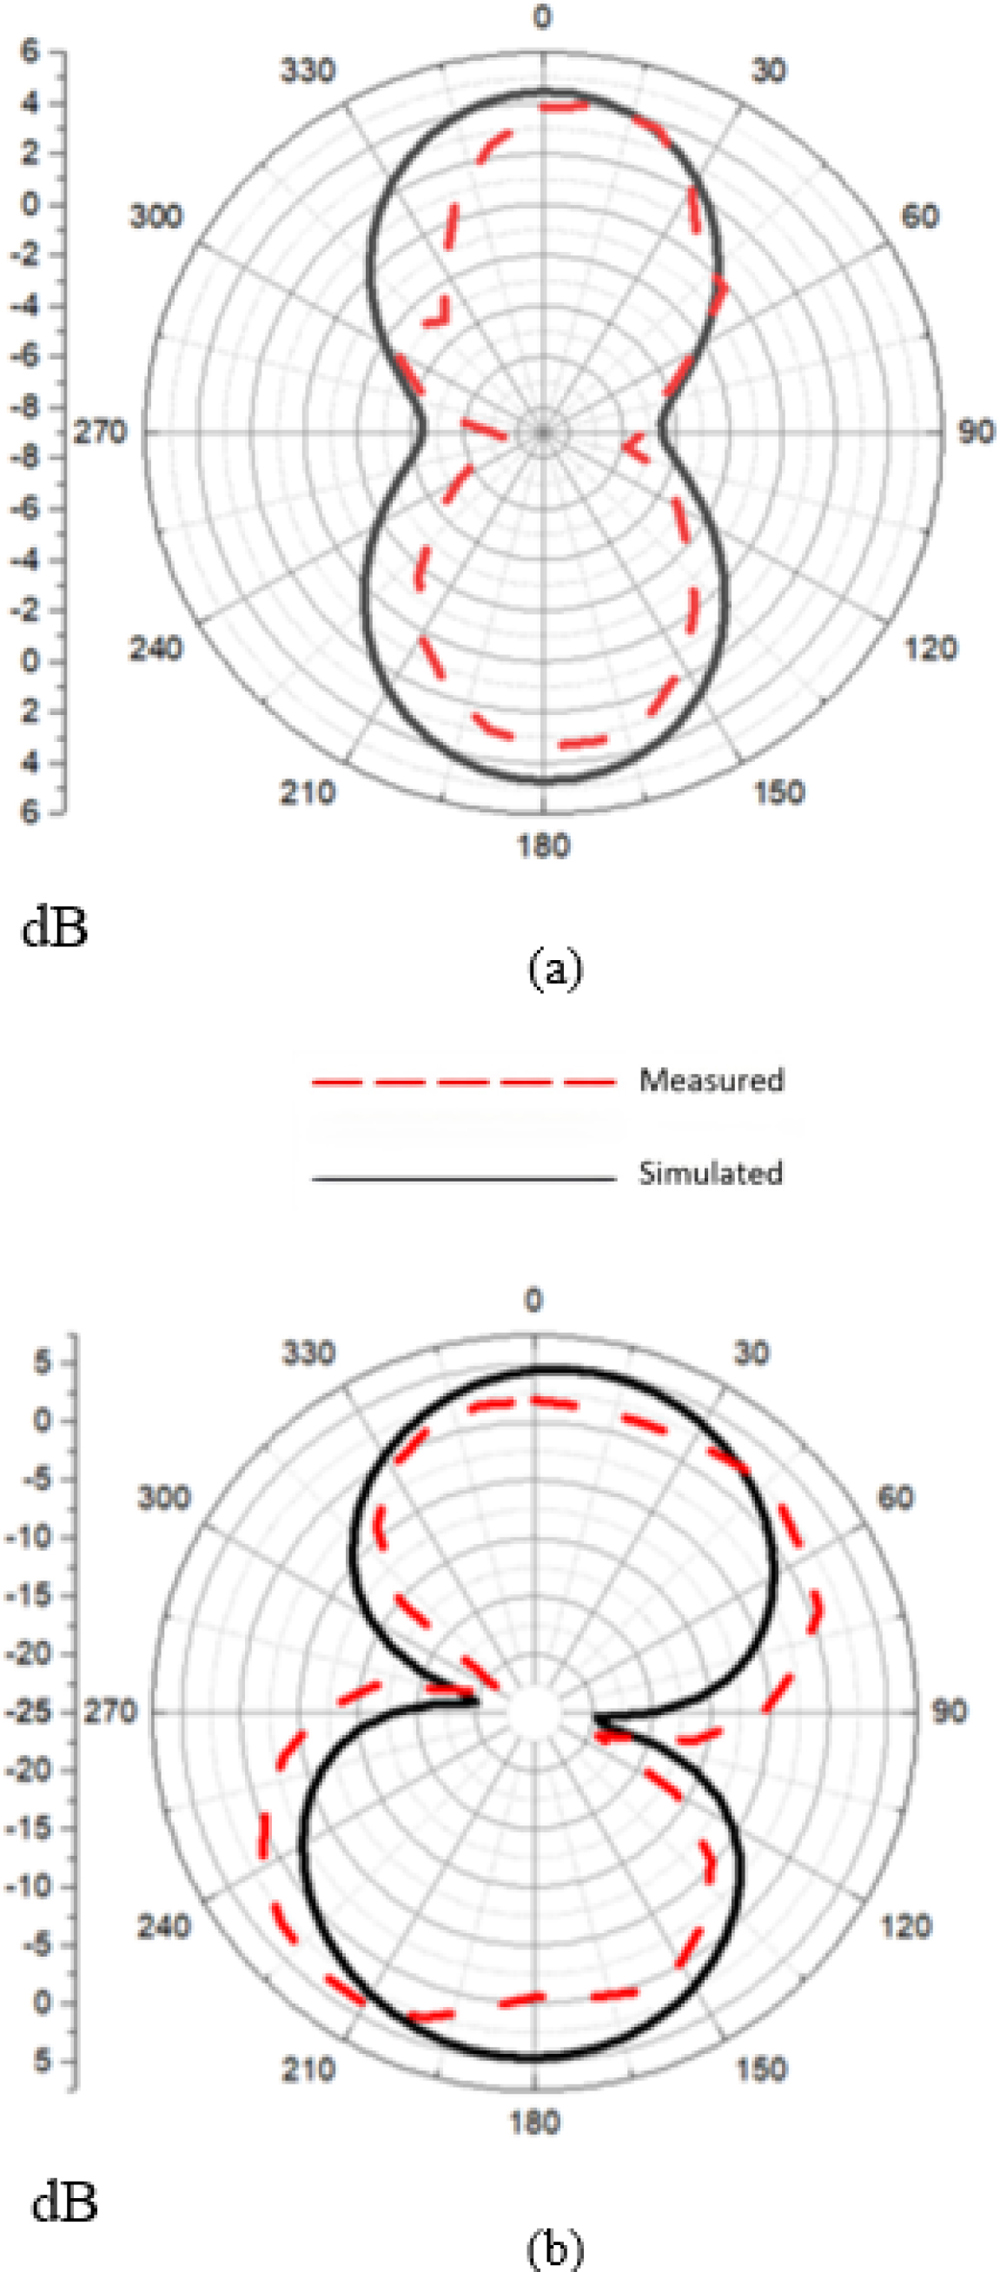
Figure 11: Simulated and measured radiation patterns on (a) E-plane and (b) H-plane. At 6.1 GHz.
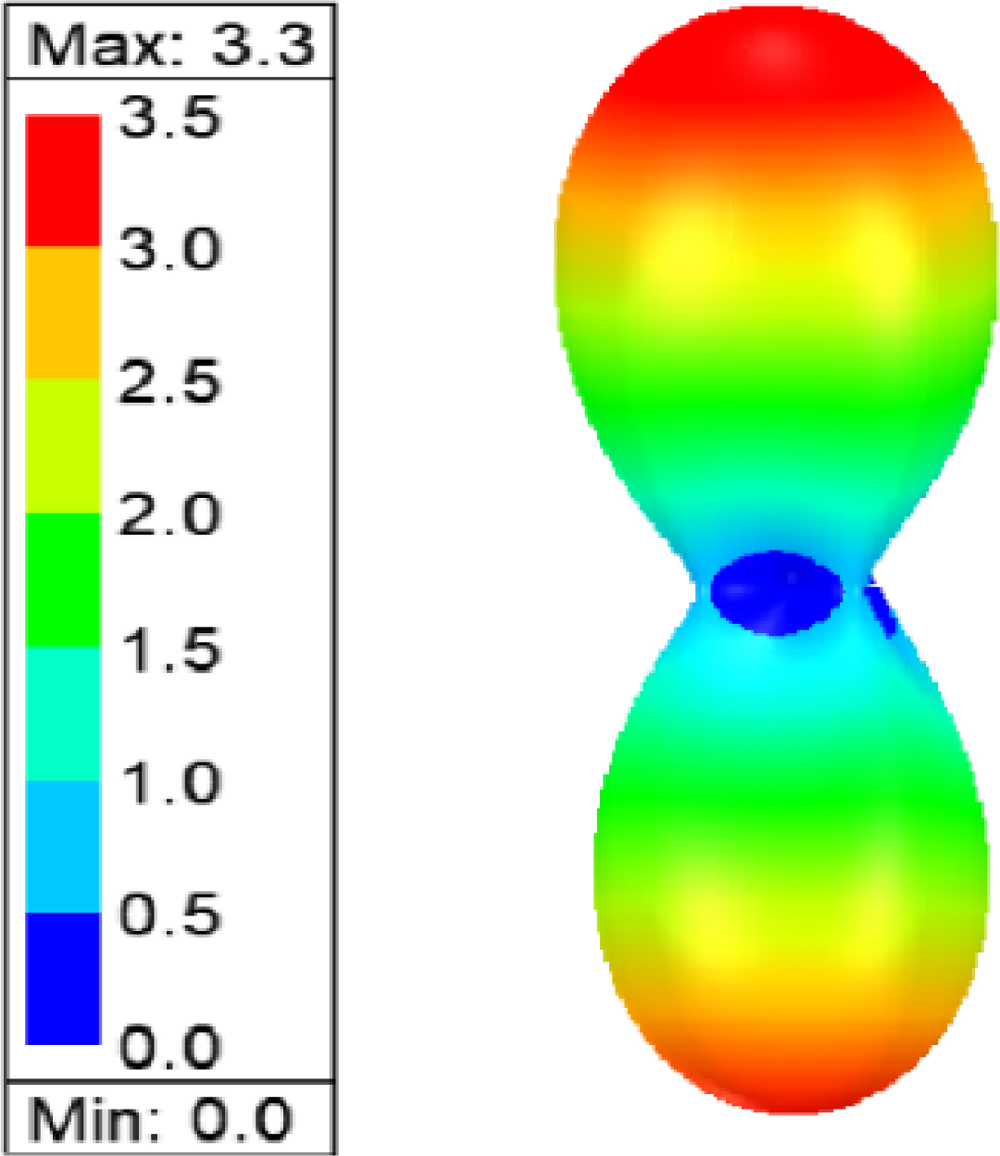
Figure 12: 3D radiation pattern at 6.1 GHz with maximum realized gain 3.3 dBi.
3.1 Modeling of finger phantom & evaluation of glucose concentration
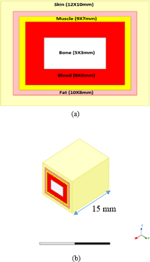
In particular, the current research effort is focused on the development of an antenna that is capable of monitoring glucose concentration fluctuations in blood from the fingertips. To do this, a finger phantom model is created in an HFSS environment to mimic the real human finger as given in Fig. 13. For the simulation of various layers of the finger such as skin, fat, muscle, blood, and bone, dielectric materials with variable dielectric constants and conductivities are utilized. The central layer to consider is the finger’s bone region, which is seen in white color in Fig. 13. The blood in the finger is shown as a red color next to the bone. The muscle is next to blood and is represented by a yellow color. Following muscle is the fat layer, which is represented by a pink color, and the last layer is the skin, which is represented by a light yellow color. The thicknesses of the different layers of the finger phantom are shown in Fig. 13 as well as their dielectric constants, which are listed in Table 2 [31–38].

Figure 13: Finger phantom model. (a) Top view. (b) Isometric view.
Table 2: Dielectric constant, conductivity, loss tangent, and thickness of Finger Phantom at 6.1 GHz
| Phantom Parameters | (S/m) | Loss Tangent | |
|---|---|---|---|
| Skin | 34.9 | 3.9 | 0.3336 |
| Fat | 4.9 | 0.3 | 0.1871 |
| Muscle | 48.1 | 0.3 | 0.3263 |
| Blood | 52 | 6.9 | 0.3933 |
| Bone | 9.54 | 1.2 | 0.3788 |
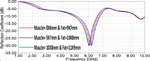
As shown in Fig. 14, the resonant frequencies and reflection coefficients of the phantom placed at the top of the radiation element are simulated for various thicknesses of muscle and fat, and the results are compared with the resonant frequencies and reflection coefficients of a real human finger placed at the top of the radiation element, as seen in Fig. 18 (a), to determine the thickness that is closest to the real thicknesses of muscle and fat for the human finger. The selected thickness is the one reported in [31–38] and given in Fig. 13 (a). Moreover, these selections are validated by placing a real human finger at the top of the antenna. The obtained results with the given dimensions of the phantom showed to a far extent that this phantom resembles the real humanfinger.
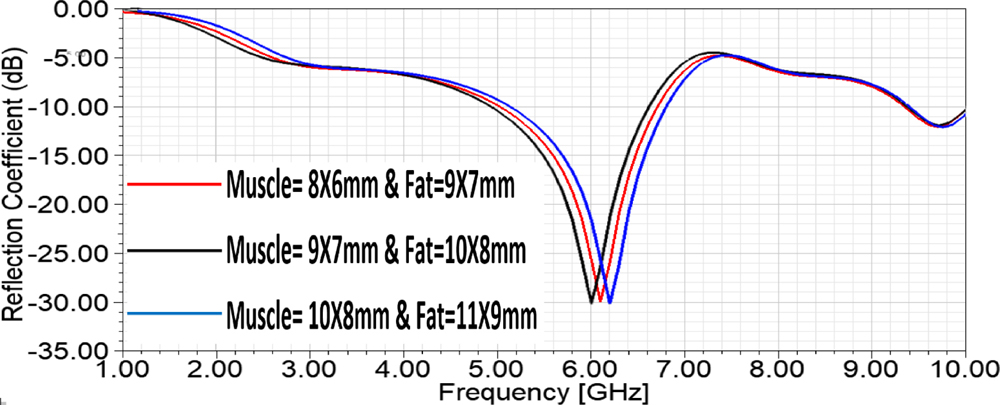
Figure 14: The resonant frequencies and reflection coefficients for different thicknesses of muscle and fat.
For the most part, a phantom finger is placed at various positions on the antenna, such as the top of the radiating element and the middle of the radiating element, as shown in Figs. 8 and 19, with their reflection coefficients, respectively.
The frequency shifts of the finger phantom, which is placed on top of the radiating element, are used to detect changes in glucose concentration. When the finger phantom is placed on the radiating element, a similar shift in the magnitude of the reflection coefficient is shown to have occurred. Placing the finger phantom at the top of the radiating element is the most effective method of obtaining glucose concentration in this configuration, as this case gives a good amount of frequency shift. Table 3 shows the different frequency shifts obtained for various finger phantom positions on the antenna.
Table 3: The resonant frequencies and reflection coefficients for different places of finger phantoms
| Position of the Phantom | Resonant Frequency (GHz) | S11 (dB) |
|---|---|---|
| Without phantom | 6.1 | -30 |
| Phantom at the top of the radiating element. | 6.1 | -30 |
| Phantom at the center of the radiating element. | 6.3 | -31 |
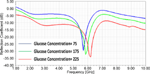
The phantom is placed above the top of the radiating element by adjusting the glucose concentration from 0 to 500 mg/dL throughout a range of time. As the glucose content in the finger phantom increases, the resonant frequency increases, as seen in Fig. 15. Antenna resonance occurs at 5.71 GHz when the glucose level is 75 mg/dL and the S11 is -29.9 dB. There is a resonance at 5.97 GHz for an amount of 175 mg/dL glucose concentration with a -32.5 dB reflection coefficient value, and there is another resonance at 6.18 GHz for 225 mg/dL glucose concentration with a -34.6 dB reflection coefficient value. The antenna has a distinct frequency shift in response to variations in glucose concentrations, making it an excellent candidate for determining glucose concentrations in the bloodstream. Table 4 describes the relationship between the dielectric constant and glucose levels. Figure 16 shows the relationship between the dielectric constant and glucose levels at 5.5, 6.0, and 6.5 GHz. As seen from this figure, the dielectric constant decreases as the glucose concentration increases. Moreover, as the frequency increases, the dielectric constant decreases.
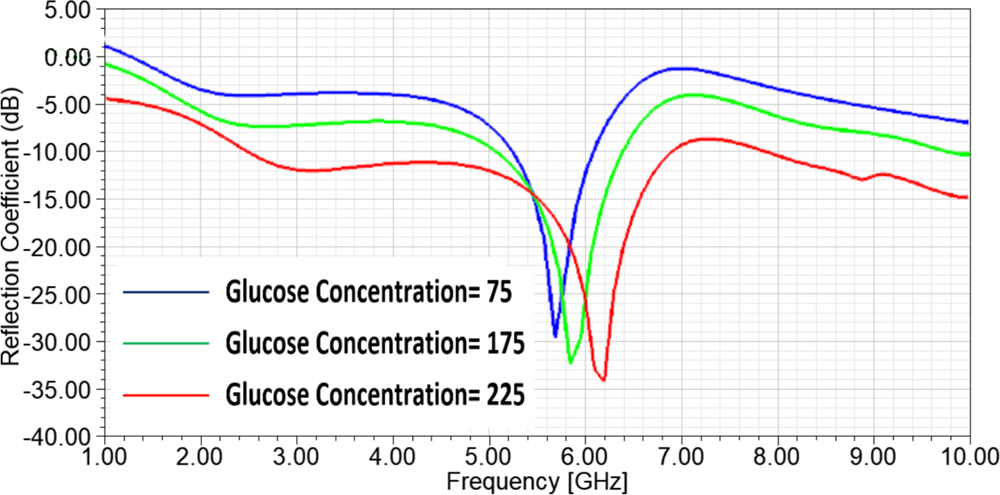
Figure 15: illustrates the variations of S11-Parameters versus the frequency at different glucose concentrations mg/dl when the finger phantom model is placed on the top of the radiating element.
Table 4: Dielectric Constant values for different Glucose concentrations
| Glucose Concentration (mg/dL) | |
|---|---|
| 0 | 64.5 |
| 125 | 64.25 |
| 250 | 64 |
| 375 | 63.75 |
| 500 | 63.5 |
| 625 | 63.25 |
| 750 | 63 |
| 875 | 62.75 |
| 1000 | 62.5 |

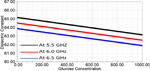
Figure 16: Dielectric Constant values for different Glucose concentrations at 5.5, 6, and 6.5 GHz.
At 5.5, 6.0, and 6 GHz, it is evident from Fig. 16 that the dielectric constant drops by a consistent amount while the glucose concentration rises. This demonstrates that the proposed antenna sensor is an excellent option for measuring glucose levels in the blood.
3.2 Measurement of reflection coefficient for various real finger and phantom model positions
The main idea of the presented work is to design and develop an antenna sensor that can measure the glucose concentration in blood samples from diabetic patients. The sensor works on the principle of frequency shift variations w.r.t the variations of glucose in patients’ blood samples. This change in glucose concentration is modeled using various dielectric constants of different finger layers like skin, fat, muscle, blood, and bone as given in Table 2. Also, the variations of the dielectric constant w.r.t glucose concentration are given in Table 4 and Fig. 16. The proposed antenna sensor is unique and can be used for any diabetic patient having different levels of glucose changes. These glucose changes are mapped to the resonant frequency shifts, and the sugar levels in the patient can be easily estimated.
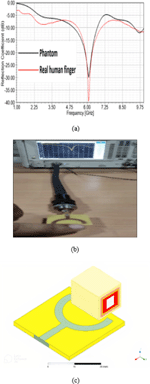
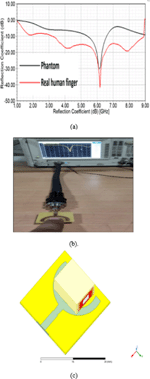
To validate the performance of the proposed antenna for measuring glucose concentration, the finger of a normal, healthy individual is inserted in various positions around the antenna, and frequency changes are measured. It should be mentioned that the purpose of this experiment is to demonstrate the frequency shift and the reflection coefficients when a real finger is placed at different positions of the radiating element of the antenna. Similarly, we put the designed phantom model in the same positions to figure out how this phantom model resembles the real human finger. The reflection coefficient and the resonant frequency for both the real finger and the phantom model are shown in Figs. 18 and 19.
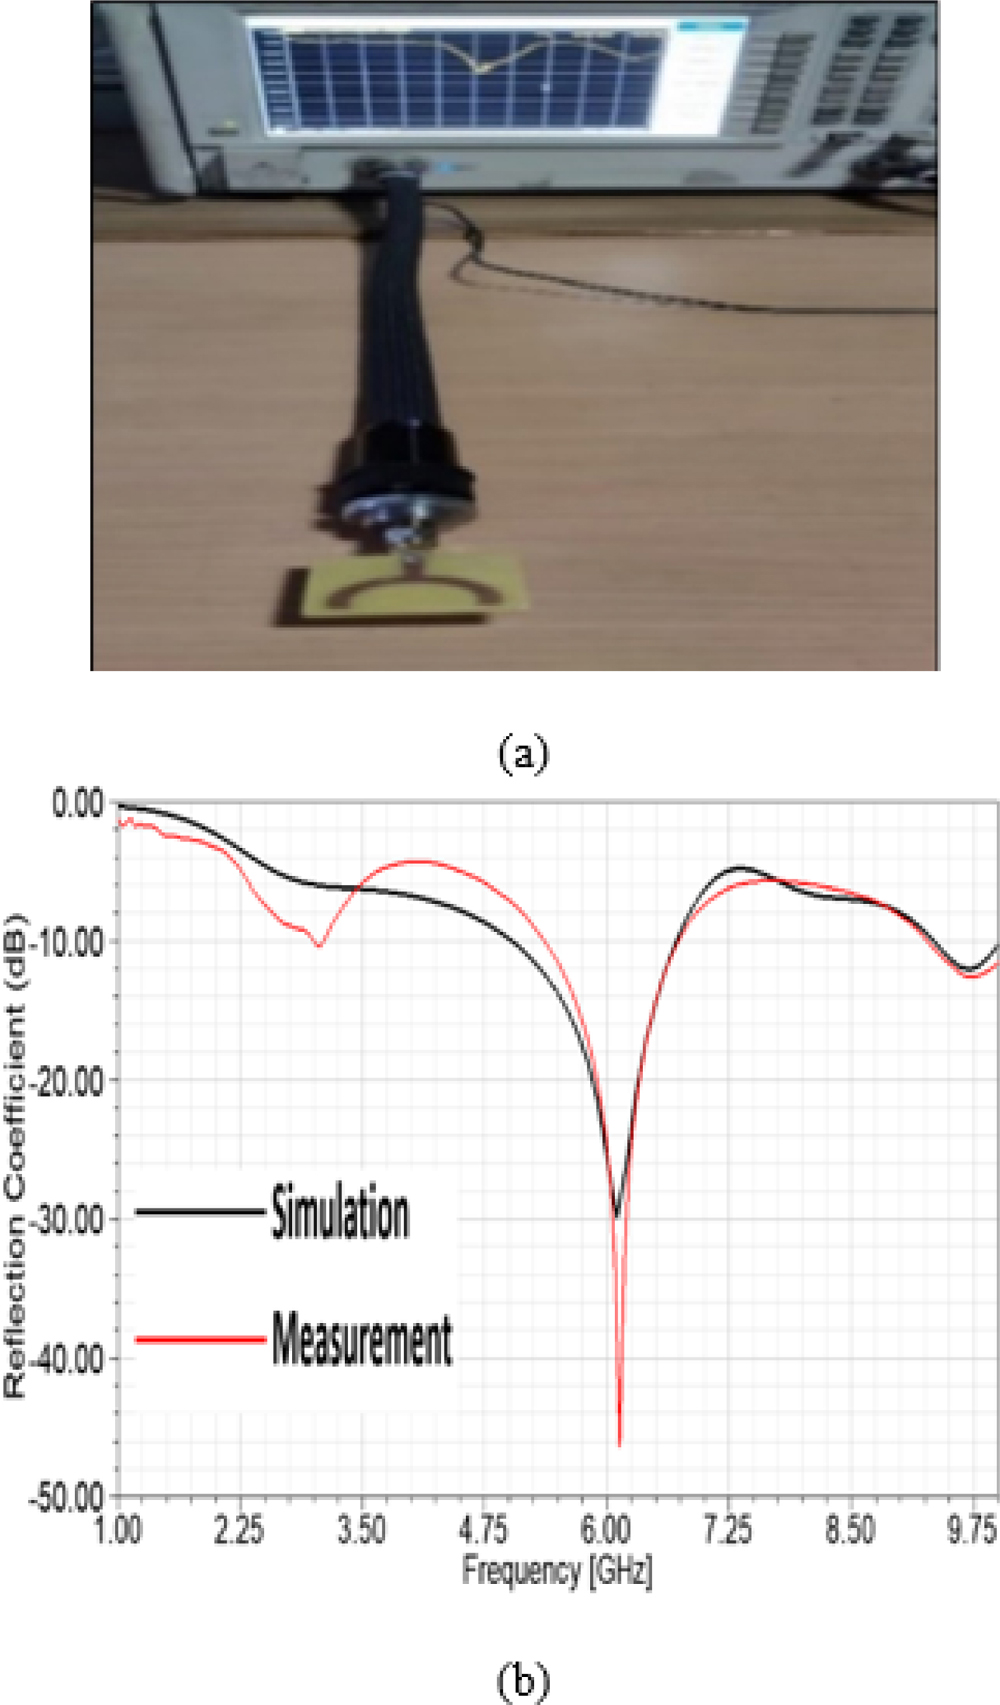
Figure 17: (a) Measured and simulated reflection coefficient for the fabricated antenna with no finger or phantom around the antenna. (b) Setup and the reflection coefficient.
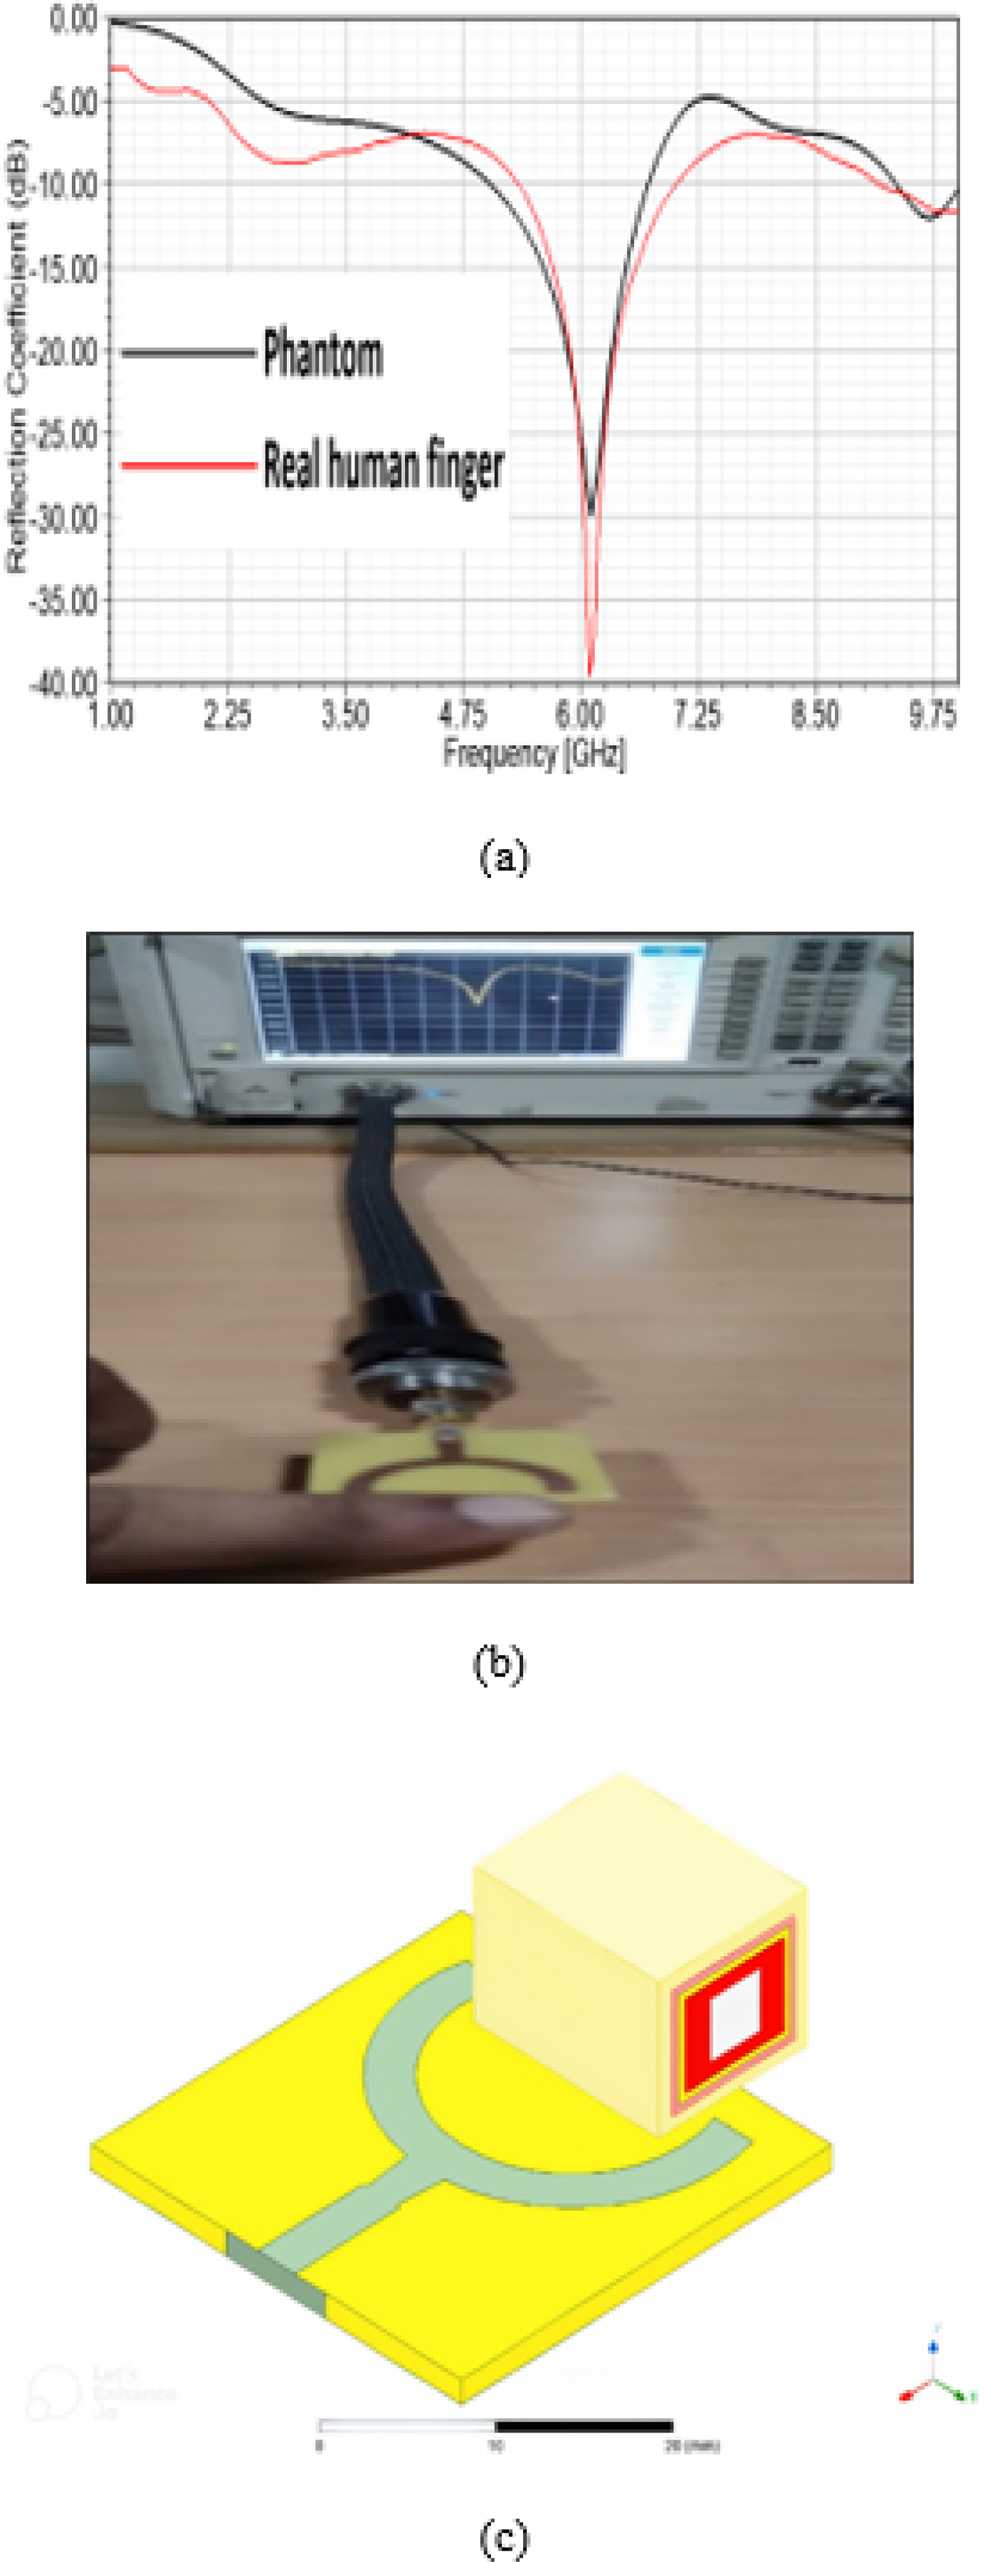
Figure 18: (a) Measurement and simulation of the reflection coefficient by placing the finger and the phantom on top of radiating element as in (b and c).
Table 5: Summary of resonant frequencies obtained for different Glucose Concentrations
| Glucose Concentration (mg/dL) | Resonant Frequency (GHz) | Bandwidth (GHz) |
Frequency Shift (MHz) | Sensitivity (MHz/(mg/dL)) | S (dB) |
| 0 | 5.50 | 1.6966 | —- | – | 29.8574 |
| 75 | 5.71 | 1.6954 | 210 | 2.8 | 29.9353 |
| 125 | 5.84 | 1.6950 | 130 | 1.04 | 31.9547 |
| 175 | 5.97 | 1.6949 | 130 | 0.74 | 32.5241 |
| 225 | 6.18 | 1.6944 | 210 | 0.93 | 34.6241 |
| 275 | 6.28 | 1.6940 | 100 | 0.36 | 34.9246 |
| 325 | 6.37 | 16936 | 90 | 0.28 | 35.0783 |
| 375 | 6.45 | 1.6932 | 80 | 0.21 | 35.5462 |
| 425 | 6.51 | 1.6931 | 60 | 0.14 | 35.6481 |
| 475 | 6.57 | 1.6927 | 60 | 0.13 | 35.7201 |
| 500 | 6.62 | 1.6922 | 50 | 0.1 | 35.9675 |

Figure 19: (a) Measurement and simulation of the reflection coefficient by placing the real human finger and the phantom on the center of radiating element as in(b and c).
Starting with Fig. 17, where there is no real finger or phantom placed near the antenna, the measured return loss is -46 dB and the resonant frequency is 6.1 GHz. When the finger is placed on top of the radiating element, the resonance frequency is moved to 6.15 GHz and the reflection coefficient is -39.1 dB for the finger (red line) and -30 dB for the designed phantom (black line), as seen in Fig. 18 (a)-(c). Putting the finger at the center of the radiating element, the resonance frequency is 6.3 GHz and the reflection coefficient is -42 dB for the real finger and -31 dB for the phantom model, as shown in Figs. 19 (a)-(c). These results reflect how close the results obtained by the proposed phantom model are to those obtained by the human real finger. After performing many simulations, it was found that the best place to put the phantom model was at the top of the radiating part of the antenna. With this in mind, we varied the glucose concentration from 0 to 500 mg/dL and measured the frequency shift, and the results are listed in Table 5. From these results, it is observed that the frequency shift can be utilized to detect the glucose level in the blood. As seen from this table, when the glucose concentration is varied from 0 to 75 mg/dL, a frequency shift of 210 MHz is observed. When the concentration is varied from 75 mg/dL to 125 mg/dL, a frequency shift of 130 MHz, is observed. Similarly, the variation of glucose concentration from 125 to 175 mg/dL gives a frequency shift of 130 MHz, and so on. The frequency shift is dropped to 60 and 50 MHz when the concentration is varied from 425 to 475 mg/dL and from 475 to 500 mg/dL,respectively.
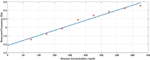
A linear curve fitting using the least squares criterion is applied to the glucose concentration from 75 to 425 mg/dL, and the results are plotted in Fig. 20. As noticed, the linear curve best fits the reading data in Table 5 over the glucose range of 75 to 425 mg/dL. The slope of the linear curve in Fig. 20 is equal to the average frequency shift resulting from the glucose concentration variation. This could be used as a measure of how sensitive the proposed sensor is to glucose concentration. The slope we obtained is about 2.4 MHz/(mg/dL), which is better than what is reported in [39], where the slope was 1.34 MHz/(mg/dl). In Table 6, a comparison of the sensitivity of our work with the work published in the literature is presented, as seen in the work of [39]. A CPW planar antenna is designed to work at a resonant frequency of 1.8 GHz and the glucose concentration is varying from 0 to 16000 mg/dL. However, the test is conducted at only 98 to 188 mg/dL to calculate the sensitivity of the given design. The corresponding frequency shift is only 31.2 MHz. Ref. [31] proposed a new dielectric resonator antenna for measuring glucose concentrations at a center frequency of 4.7 GHz, and the measuring sample of the glucose concentration varies from 0 mg/dL up to 16000 mg/dL. The frequency shift is 2.81 kHz, and the sensitivity is only 2 kHz per mg/dL. At a frequency of 5.41 GHz, a microfluidic biosensor is described in [40] to monitor glucose levels from 0 to 8000 mg/dL. The sensitivity obtained in this study is only 0.1 MHz per mg/dL. Ref. [41] describes a unique split ring resonator for monitoring glucose concentration. In this work, the frequency shift is 5 kHz, and the sensitivity is 3.287 kHz per mmol/L over the tested sample in the range of 4.4–7.6 mmol/L. The sensitivity is only 3.287 kHz per mmol/L. In [42] a novel split ring resonator for measuring glucose concentration is presented. The tested range was from 2.7 to 22.2 mmol/L. Now, if we compare all these results with our proposed antenna sensor, we find that the maximum frequency shift we obtained is 800 MHz and the sensitivity is 2.4 MHz/mg/dL. This makes the proposed antenna sensor outperforms the others in detecting the changes in glucose concentration levels.
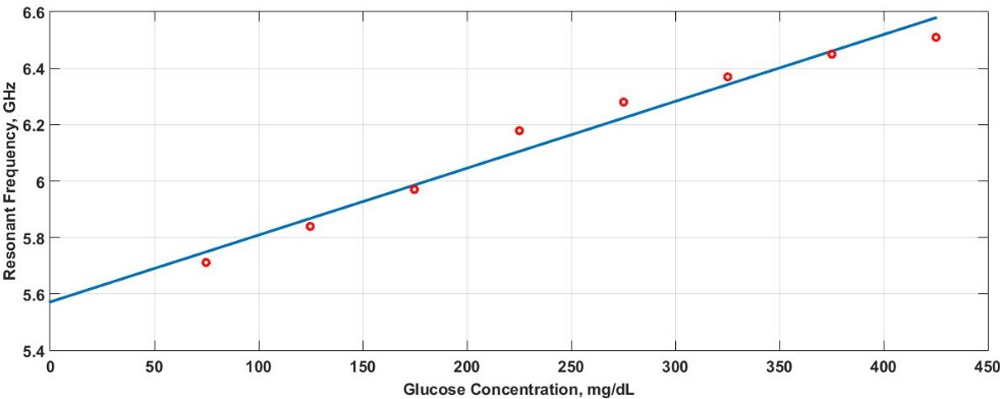
Figure 20: Resonance frequencies Vs. Blood glucose concentration (Red circles); Fitted curve obtained by Least-square method (Blue line).
Table 6: Performance comparison of proposed antenna with literature
| Reference | Technology | Operating Frequency (GHz) | FrequencyShift | Sensitivity | Measuring Sample |
| [39] | Non-InvasivePlanar resonator | 1.8 | 31.2 MHz | 1.34MHz/mg/dL(Testedsample 98 –188 mg/dL) | 0 – 16000 (mg/dL) |
| [31] | Non-invasive finger placed on Dielectric Resonator | 4.7 | 2.81 KHz | 0.002 MHz/mg/dL | 0 – 16000 (mg/dL) (glucose variation in blood sample) |
| [40] | Invasive method by extracting fluids | 5.41 | 62.5 KHz | 0.1MHz/mg/dL | 0-8000 (mg/dL) (glucose variation in microfluidic sample) |
| [41] | Non-invasive double split ring resonator | 1.4 | 5 KHz | 3.287 kHzper mmol/L | 4.4 – 7.6 mmol /L (glucose variation in microfluidic sample) |
| [42] | Split ring biosensor | 2-5 | - | 82MHz/mg/mL | Glucose concentration in blood from 2.7 to 22.2 mmol/L within the range from 2.85 to 3.95 GHz |
| This work | Microstrip antenna sensor | 6.1 | 800 MHz | 2.4MHz/mg/dL(Testedsample 75 –425 mg/dL) | Glucose concentration in blood from 0-500 mg/dL |
4 CONCLUSION
A planar microstrip patch antenna that operates at 6.1 GHz and exhibits a directional radiation pattern with a peak realized gain of 3.3 dBi is designed to measure the glucose concentration in the blood. A finger phantom model of five layers: skin, fat, muscle, blood, and bone, with different dielectric constants and thicknesses, is constructed using the EM simulation (HFSS) environment. The dielectric constant of the blood is as varied as the sugar in the blood. This phantom model is placed at various locations of the radiating element of the antenna, and the frequency shifts are measured as a result of the phantom position and the variations in the glucose concentration from 0 to 500 mg/dL. The simulated results show that the best frequency shifts are obtained when the finger phantom is placed at the top of the radiating element of the antenna. The experiment was conducted on a real human finger using the designed and fabricated antenna prototype, which also presents a good agreement with the simulation results of the proposed phantom model. This shows that the proposed phantom model resembles the real human finger to a great extent, and the proposed antenna sensor is a good choice for monitoring the glucose concentrations in the blood due to its compactness, good sensitivity, and affordable cost.
ACKNOWLEDGMENT
This work was funded by the Deanship of Scientific Research (DSR) at King Abdulaziz University, Jeddah under grant No. RG-98-135-42.
REFERENCES
[1] F. Maryam, “Diagnosis of neuropathy and risk factors for corneal nerve loss in type 1 and type 2 diabetes: a corneal confocal microscopy study,” Diabetes Care, vol. 44, no. 1, pp. 150-156, 2021.
[2] K. E. Hill, J. M. Gleadle, M. Pulvirenti, and D. A. McNaughton, “The social determinants of health for people with type 1 diabetes that progress to end-stage renal disease,” Health Expectations, vol. 18, no. 6, pp. 2513-2521, 2015.
[3] W. Villena Gonzales, A. Mobashsher, and A. Abbosh, “The progress of glucose monitoring—A review of invasive to minimally and non-invasive techniques, devices and sensors,” Sensors, vol. 19, no. 4, pp. 800, 2019.
[4] C. G. Juan, E. Bronchalo, B. Potelon, C. Quendo, E. Ávila-Navarro, and J. M. Sabater-Navarro, “Concentration measurement of microliter-volume water–glucose solutions using Q factor of microwave sensors,” IEEE Transactions on Instrumentation and Measurement, vol. 68, no. 7, pp. 2621-2634, 2019.
[5] M., Esraa, A. Ahmed, and A. Adel B, “A novel approach to non-invasive blood glucose sensing based on a defected ground structure,” 15th European Conference on Antennas and Propagation (EuCAP), pp. 1-5, Düsseldorf, Germany, March 2021.
[6] A. S. N. Shahidah and R. Alias, “A portable non-invasive blood glucose monitoring device with IoT,” Evolution in Electrical and Electronic Engineering, vol. 2, no. 1, pp. 36-44, 2021.
[7] S. George, “Non-invasive monitoring of glucose level changes utilizing a mm-wave radar system,” International Journal of Mobile Human Computer Interaction (IJMHCI), vol. 10, no. 3, pp. 10-29, 2018.
[8] A. N. A. Binti, B. Saad, and W.H. Manap, “The evolution of non-invasive blood glucose monitoring system for personal application,” Journal of Telecommunication, Electronic and Computer Engineering (JTEC), vol. 8, no. 1, pp. 59-65, 2016.
[9] J. Yadav, A. Rani, V. Singh, and B. M. Murari, “Prospects and limitations of non-invasive blood glucose monitoring using near-infrared spectroscopy,” Biomedical Signal Processing and Control, vol. 18, pp. 214-227, 2015.
[10] A. Paredes, V. García, I. Guzmán, J. Negrete, R. Valencia, and G. Silverio, “An IoT-based non-invasive glucose level monitoring system using raspberry pi,” Applied Sciences, vol. 9, pp. 3046, 2019.
[11] M. S. Mohamed, M. F. O. Hameed, N. F. F. Areed, M. M. El-Okr, and S. S. A. Obayya, “Analysis of highly sensitive photonic crystal biosensor for glucose monitoring,” American Computational Electromagnetics Society (ACES) Journal, vol. 31, no. 07, pp. 836-842. 2021.
[12] D. Vijay and S. Chorage, “Non-invasive determination of blood glucose level using narrowband microwave sensor,” Journal of Ambient Intelligence and Humanized Computing, pp. 1-16, 2021.
[13] L. Malena, O. Fiser, P. Stauffer, T. Drizdal, J. Vrba, and D. Vrba, “Feasibility evaluation of metamaterial microwave sensors for non-invasive blood glucose monitoring,” Sensors, pp. 21-20 2021.
[14] S. Kushal and S. Anand, “Demonstration of microstrip sensor for the feasibility study of non-invasive blood-glucose sensing,” MAPAN, vol. 36, no. 1, pp. 193-199, 2021.
[15] V. V. Deshmukh and R. B. Ghongade, “Measurement of dielectric properties of aqueous glucose using planar ring resonator,” IEEE International Conference on Microelectronics, Computing and Communications (MicroCom), pp. 1-5, 23-25, Durgapur, India, 2016.
[16] C. G. Helena, I. Gouzouasis, I. Sotiriou, and S. Saha, “Reflection and transmission measurements using 60 GHz patch antennas in the presence of animal tissue for non-invasive glucose sensing,” 2016 10th European Conference on Antennas and Propagation (EuCAP), pp. 10-15, Davos, Switzerland, 2016.
[17] L. W. Liu, A. Kandwal, Q. Cheng, H. Shi, I. Tobore, and Z. Nie, “Non-invasive blood glucose monitoring using a curved Goubau line,” Electronics, vol. 8, no. 6, pp. 662, 2019.
[18] T. Karacolak, E. C. Moreland, and E. Topsakal, “Cole–cole model for glucose-dependent dielectric properties of blood plasma for continuous glucose monitoring,” Microwave and Optical Technology Letters, vol. 55, no. 5 pp. 1160-1164, 2013.
[19] S. S. Gupta, T. H. Kwon, S. Hossain, and K. D. Kim, “Towards non-invasive blood glucose measurement using machine learning: An all-purpose PPG system design,” Biomedical Signal Processing and Control, vol. 68, 2021.
[20] F. Jiang, S. Li, Y. Yu, Q. S. Cheng, and S. Koziel, “Sensitivity optimization of antenna for non-invasive blood glucose monitoring,” International Applied Computational Electromagnetics Society (ACES) Symposium, pp. 1-2, 2017.
[21] J. Li, I. Tobore, Y. Liu, and A. Kandwal, “Non-invasive monitoring of three glucose ranges based on ECG by using DBSCAN-CNN,” IEEE Journal of Biomedical and Health Informatics, vol. 25, no. 9, pp. 3440-3350, 2021.
[22] I. M. Atzeni, S. C. van de Zande, J. Westra, J. Zwerver, A. J. Smit, and D. J. Mulder, “The AGE reader: A non-invasive method to assess long-term tissue damage,” Methods, vol. 203, pp. 533-541, 2022.
[23] A. Zainul and P. Agarwal, “Microwave sensing technique-based label-free and real-time planar glucose analyzer fabricated on FR4,” Sensors and Actuators A: Physical, vol. 279, pp. 132-139, 2018.
[24] M. Alam, S. Saha, P. Saha, F. N. Nur, and N. N. Moon, “D-care: A non-invasive glucose measuring technique for monitoring diabetes patients,” Proceedings of International Joint Conference on Computational Intelligence, Springer, Singapore, July 2019.
[25] E. Susana, K. Ramli, H. Murfi, and N. H. Apriantoro, “Non-invasive classification of blood glucose level for early detection diabetes based on photoplethysmography signal,” Information, vol. 13, no. 2, pp. 59, 2022.
[26] J. Vrba, D. Vrba, L. Díaz, and O. Fišer, “Phantoms for development of microwave sensors for noninvasive blood glucose monitoring,” International Journal of Antennas and Propagation, 2015.
[27] T. Yilmaz, T. Ozturk, and S. Joof, “A comparative study for development of microwave glucose sensors,” Proceedings of the 32nd URSI GASS, Montreal, QC, Canada, pp. 19-26, 2017.
[28] S. Kim, H. Melikyan, J. Kim, A. Babajanyan, and J. H. Lee, “Noninvasive in vitro measurement of pig-blood d-glucose by using a microwave cavity sensor.” Diabetes Research and Clinical Practice vol. 96, no. 3, pp. 379-384, 2012.
[29] J. Vrba, D. Vrba, L. Díaz, and O Fišer “Metamaterial sensor for microwave non-invasive blood glucose monitoring,” IFMBE Proceedings, vol. 68, pp. 789-792, 2019.
[30] A. N. Khan, Y. Cha, H. Giddens, and Y. Hao, “Recent advances in organ specific wireless bioelectronic devices: Perspective on biotelemetry and power transfer using antenna systems,” Engineering, vol. 11, pp. 27-41, 2022.
[31] M. N. Hasan, S. Tamanna, P. Singh, M. D. Nadeem, and M. Rudramuni, “Cylindrical dielectric resonator antenna sensor for non-invasive glucose sensing application,” 6th International Conference on Signal Processing and Integrated Networks (SPIN), pp. 961-964, 7-8, Noida, India, March 2019.
[32] D. Bamgboje, I. Christoulakis, I. Smanis, and G Chavan, “Continuous non-invasive glucose monitoring via contact lenses: current approaches and future perspectives,” Biosensors, vol. 11, no. 6, pp. 189, 2021.
[33] U. Hassan, M. H. Zulfiqar, M. M. Ur Rahman, and K. Riaz, “Low Cost and Flexible Sensor System for Non-Invasive Glucose In-Situ Measurement,” 17th International Bhurban Conference on Applied Sciences and Technology (IBCAST), pp. 187-190, 14-18, Islamabad, Pakistan, Jan. 2020.
[34] Y. Chen, F. Kaburcuk, R. Lumnitzer, A. Z. Elsherbeni, V. Demir, and A. Shamim, “Human Tissues Parameters and Resolution for Accurate Simulations of Wearable Antennas,” International Applied Computational Electromagnetics Society (ACES) Symposium, pp. 1-4, 1-5 Aug. 2021.
[35] “An Internet Resource for the Calculation of the Dielectric Properties of Body Tissues in the Frequency Range 10Hz-100GHz,” Italian National Research Council, Institute for Applied Physics. http://niremf.ifac.cnr.it/tissprop/
[36] F. Kaburcuk, A. Z. Elsherbeni, R. Lumnitzer, and A. Tanner, “Electromagnetic waves interaction with a human head model for frequencies up to 100 GHz,” American Computational Electromagnetics Society (ACES) Journal, vol. 35, no. 6, pp. 613-621, 2020.
[37] C. Palmer, “Advanced devices ease burden of glucose monitoring for diabetics,” Engineering, Elsevier, vol. 5, pp. 547-549, 2021.
[38] A. E. Omer, G. Shaker, S. Safavi-Naeini, G. Alquié, F. Deshours, H. Kokabi, and R. M. Shubair, “Non-invasive real-time monitoring of glucose level using novel microwave biosensor based on triple-pole CSRR,” IEEE Transactions on Biomedical Circuits and Systems, vol. 14, no. 6, pp. 1407-1420, 2020.
[39] A. Ayesha, T. Kalsoom, M. Ur-Rehman, N. Ramzan, S. Karim, and Q. H. Abbasi, “Design and study of a small implantable antenna design for blood glucose monitoring,” Applied Computational Electromagnetics Society (ACES) Journal, vol. 33, no. 10, pp. 1146-1151, 2018.
[40] M. C. Cebedio, L. A. Rabioglio, I. E. Gelosi, R. A. Ribas, A. J. Uriz, and J. C. Moreira, “Analysis and design of a microwave coplanar sensor for non-invasive blood glucose measurements,” IEEE Sensors Journal, vol. 20, no. 18, pp. 10572-10581, 2020.
[41] D. Mondal, N. K. Tiwari, and M. J. Akhtar, “Microwave assisted non-invasive microfluidic biosensor for monitoring glucose concentration,” IEEE Sensors, pp. 1-4, 2018.
[42] H. Choi, J. Naylon, S. Luzio, J. Beutler, J. Birchall, C. Martin, and A. Porch, “Design and in vitro interference test of microwave noninvasive blood glucose monitoring sensor,” IEEE Transactions on Microwave Theory and Techniques, vol. 63, no. 10, pp. 3016-3025, 2015.
[43] A. Kandwal, T. Igbe, J. Li, Y. Liu, S. Li, L. W. Y. Liu, and Z. Nie, “Highly sensitive closed loop enclosed split ring biosensor with high field confinement for aqueous and blood-glucose measurements,” Scientific Reports, vol. 10, no. 1 pp. 1-9, 2020.
BIOGRAPHIES

Ayman R. Megdad received his B.Sc. degree in Communication Engineering from Prince Sultan University, Saudi Arabia, Riyadh in 2016. He is presently an M.Sc. Student at King Abdul Aziz University, Saudi Arabia, Jeddah. His research interests include passive microwave/millimeter-wave circuit design, antenna design, wireless, and radar.

Rabah W. Aldhaheri received his Ph.D. degree from Michigan State University in 1988 in Electrical and Computer Engineering. He is currently a Full Professor in the Department of Electrical and Computer Engineering, at King Abdulaziz University (KAU), Jeddah, Saudi Arabia. He served as the Head of the Department of Electrical and Computer Engineering at KAU from May 2005 till May 2011. He is currently serving as the Founder and Director of the Microelectronics and RF Circuits Laboratory, FSS and Metamaterial Research Laboratory, and the Head of the Communication Systems and Networks Research Group. Aldhaheri held Visiting Research Scholar positions with Michigan State University from 1994- 1995, and Queensland University of Technology (QUT) in Brisbane, Australia in 2000. His research interests include digital signal processing with application to filter design, biometric recognition, microelectronics devices; and wireless communications, particularly, antenna design for UWB communication, medical imaging, RFID readers, and Frequency Selective Surfaces (FSS).

Nebras M. Sobahi (Member, IEEE) received the B.Sc. and M.Sc. degrees in electrical engineering from King Abdulaziz University, and the second M.Sc. and Ph.D. degrees in electrical engineering from Texas A&M University, USA. He is currently an Assistant Professor at the Department of Electrical and Computer Engineering, King Abdulaziz University, Saudi Arabia. His research interests include nano/microfabrication, MEMS, microfluidics, BioMEMS, and signal and imageprocessing.
ACES JOURNAL, Vol. 37, No. 11, 1118–1130
doi: 10.13052/2022.ACES.J.371102
© 2022 River Publishers