SDR-based Radar for Human Detection
Marcelo B. Perotoni1, Kenedy M. G. dos Santos2, Danilo B. Almeida2, and Daniel Jonathas2
1UFABC, Santo Andre, SP, 09210-580, Brazil
Marcelo.perotoni@ufabc.edu.br
2IFBA, Vitoria da Conquista, BA, 45078-900, Brazil
kenedymarconi@gmail.com
Submitted On: May 5, 2021; Accepted On: May 18, 2022
Abstract
Software-defined radios (SDRs) have been applied to several applications, taking advantage of their inherent versatility. It is reported a low-cost radar intended to detect human activity, at the frequency of 4.1 GHz, with an SDR on the receiving branch and a programmable RF synthesizer operating as a continuous-wave transmitter. Amplitude variations on the received signal indicate human activity, its operation is tested in indoor and outdoor scenarios. The interface to the SDR is performed using the open-source tool GNU Radio. It was possible to detect human movement at a maximum distance of 9 meters, in an open area. The system is versatile in terms of power and frequency, totally controlled by software in a transparent and straightforward way.
Index Terms: microwave systems, radar, software-defined radio.
1 INTRODUCTION
Detection of human targets has been of interest lately for several applications, such as senior people living alone, surveillance of law-offenders, and even enforcing social isolation during pandemic restrictions. Radars for these kinds of human targets have been thoroughly reviewed in [1]. Frequency modulated continuous-wave (FMCW) radar is one of the most used techniques, with the Doppler effect applied to the received wave containing the target position and velocity; for that goal, it needs synchronous detection. The low-frequency mixing product generated encodes the speed measured, heart rate, or respiratory function. Following this principle, using the frequency of 5.7 GHz, a system detects and locates the human presence using both interferometric and FMCW modes with National Instruments PXI boards [2]. Detection of vital signals (cardiac and respiratory) are extracted after further processing of the echo signal. Modules operating at millimeter-waves have been employed to report vital signals of children inside vehicles after a Deep-Learning framework is applied to the gathered data [3]. For indoor environment mapping, a 62 GHz FMCW radar was assembled and mounted on top of a moving robot [4], using two different chirp pulses transmitted; one for long-range and another for short-range, the latter reaching higher frequencies. Using commercial millimeter-wave 77-GHz evaluation boards (TI AWR1642), vital signals are acquired and analyzed, respiratory signals within 0.1 to 0.5 Hz and heart rate in the 0.8 to 2 Hz range [5], later processed with a wavelet-based algorithm. A home-built system operating as a 24-GHz FMCW radar was used to monitor different sleep patterns encoded in the heart rate and respiration parameters [6]. vector network-analyzers (VNAs), given their synchronous detection, contain the phase information of the detected signals. Two broadband horn antennas were connected to the VNA ports, one excited by the VNA (0 dBm output power) and the other set as the receiver. The received signal around 2.5 GHz was analyzed using the cyclostationary technique [7] so that cardiac and breathing signals are extracted. The same vital signal detection is analyzed at the lower frequency of 1 GHz, using custom-made circuits for RF reception, and an Agilent RF generator operating as a transmitter (TX); the data analysis was later performed under Matlab [8]. Detection of people and respective vital signals in through-wall, non-invasive scenarios can be performed using UWB (Ultra-Wide Band) waveforms in the microwave range [9] and even Infrared (IR) [10], requiring more complex hardware and data processing to separate the signals from the clutter. In the context of vital signals, [11] presents a comparison between an Infrared UWB and a 60 GHz FMCW for this task, with observed higher SNR (Signal-to-Noise Ratio) and larger accuracy in favor of the former.
In contrast to ordinary radar, which is based on the return echo of a transmitted electromagnetic wave, radiometer applications rely on the detection of natural emissions from the human body, so they are eminently passive, therefore eliminating the transmitter circuitry. A low-cost system based on commercial parts (LNB - Low-Noise Block Downconverter, parabolic antenna, and custom-designed low-frequency circuit) was reported [12]. It detects the temperature difference between the human body and surrounding walls, with the limitation of operation only in the near-field, due to the low-level amplitudes radiated by the body, on the 11 to 12 GHz frequency range. USRP (Universal Software Radio Peripheral) SDRs, in particular, given their available independent two-channel front-ends, offer an interesting alternative to passive radar detection, for instance, with the existing ambient WiFi signal used to detect hand movements [13]. One of the SDR RF inputs is considered as reference and the other as surveillance, each one connected to two antennas. Doppler frequency computed from both received signals mixed together enables hand-movement tracking.
This article describes a C-band (4.1 GHz) SDR-based radar which detects human presence, or life activity, based on a low-cost SDR for the receiving branch, with only one input channel. The transmitter is based on an independent I2C-controlled RF synthesizer. Its reception is non-synchronous, therefore the detection is based only on received amplitude fluctuations. Both SDR and software packages are open-source. The next sections delve into the hardware and software description, with results proving the real-world deployment in both indoor and outdoor environments.
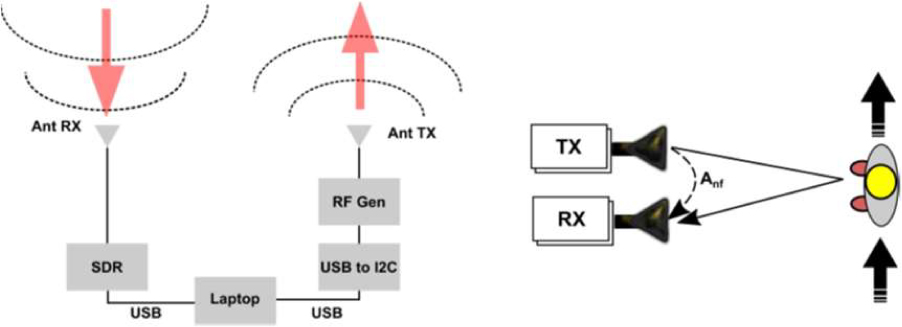
Figure 1: Block diagram of the detector (left) and (right) main components of the received signal.
2 HARDWARE
Figure 1 contains the block diagram of the proposed radar. Its core operates around a Hack RF One SDR. It has a single RF input, which can be set operating in half-duplex transmit or receive modes. It covers the range of 10 MHz to 6 GH with an instantaneous bandwidth of 8 MHz to 20 MHz. Its output delivers 8-bits IF (intermediate frequency) complex samples, divided into in-phase (I) and quadrature (Q) components. An internal 14-dB low-noise amplifier can be switched on and off by software. Radar range resolution, considering c as the speed of light, R the distance between the transmitter and receiver, and t the two-way travel time, is defined as:
| (1) |
Indoor distances Rin the range of 2 m results in a round-trip time of approximately 13 ns, a period too short to be used in the SDR platform for a switching (pulsed) RF signal. For that reason, a continuous-wave mode (CW) was used. Also, given the fact that two different circuits are used for the transmit and receive branches, there is no need for a circulator, usually a narrow-band and costly device. The SDR delivers IF (Intermediate Frequency) time-domain samples to the host-PC through a USB channel. A broadband planar antenna is connected to the SMA coaxial SDR input. On the TX branch, a programmable RF synthesizer was used (ADF4351). It is programmed by writing its registers through an I2C protocol. Conversion between I2C and USB protocols is performed by an Arduino Uno with an auxiliary board, which scales down the 5V Arduino output to the 3.3V ADF4351 digital level. The RF synthesizer operates with two SMA output pins (differential mode), for this case the TX antenna was single-ended connected to one of the outputs, and the other terminal was left open. Human activity detection does not need to inform the speed, unlike Doppler radars to reduce the cost and size of the hardware. The signal s picked up by the receiving antenna can be written in terms of different components:
| (2) |
Where is the transmitted angular frequency and n(t) represents the noise. A models the near-field coupling between the two antennas. Since both radiating elements are mechanically fixed the amplitude A is theoretically stable in time, the time-varying component depending only on the synthesizer jitter and phase noise.
The second term contains the summation of p terms that arise due to the target movement and the multipath, with each component modulated by a slow-varying amplitude A(t) which contains information about the movement and the interaction with the environment. A generic phase represents the time delay of each reflected component arriving at the receiver. The overall system, considered as a sensor, should have maximized its sensitivity s in terms of the ratio between both amplitude parameters:
| (3) |
Lower transmitted output levels are positive from the power consumption point of view, as well as electromagnetic interference problems that may arise with nearby systems but incurs in lower signal-to-noise ratios, so the output power to be chosen is a trade-off to be observed in the specific real-world application, depending on the environment and particular conditions. Legal constraints should be observed in accordance with local regulations (Brazil and the US reserve the chosen frequency range for satellite downlinks). Since the interest lies in human detection, proper care with non-ionizing safety levels should be taken [14].
The antennas were commercial planar units, a Log-Periodic (LPDA), nominal operation between 740 and 6000 MHz and Vivaldi (1.4 to 10.5 GHz), shown in Fig. 2 along with their measured return losses. At the used frequency of 4100 MHz, the return loss of both antennas was 14 dB. The LPDA was used as receiving, connected to the SDR whereas the Vivaldi as a transmitter.
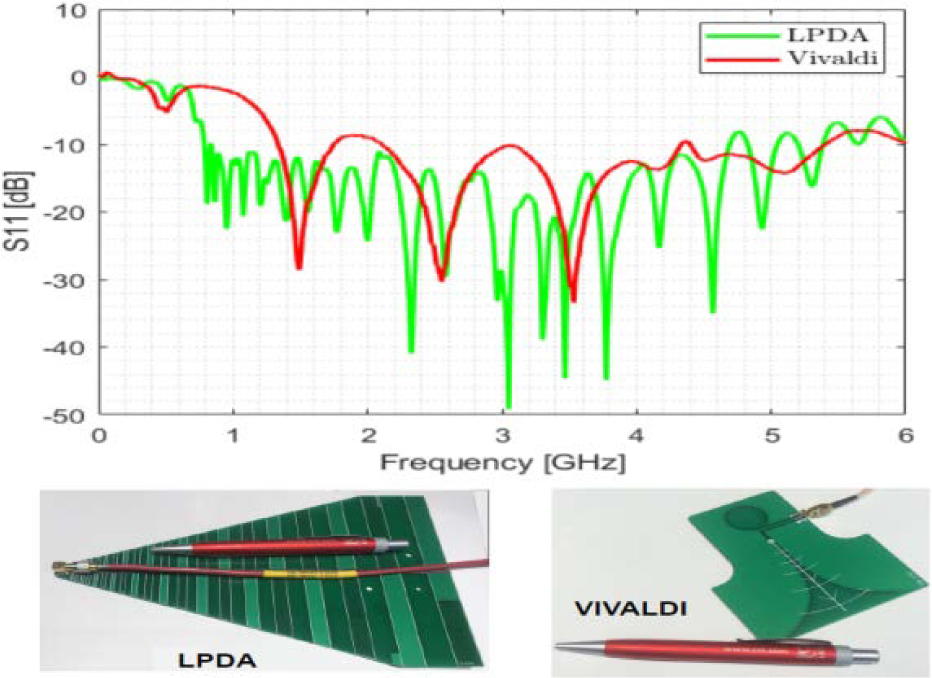
Figure 2: Measured return loss of the two antennas (top), Vivaldi (right bottom), and LDPA (left bottom).
The antennas are separated by a distance of 40 cm, equivalent to 5.46 at the used frequency, this distance was chosen due to mechanical constraints. Smaller distances increase the nearfield coupling and larger separations incur in secondary maxima due to their Array Factor, which may generate stronger fluctuations in the received signal.
3 SOFTWARE
One of the most used software suites for digital processing and interface to SDRs is GNU Radio [15], an open-source platform that is similar to paid alternatives like Labview [16] and Matlab/Simulink [17]. GNU Radio uses C++ for time-critical routines and is wrapped in Python, used for the interface and communication with the user. GNU Radio Companion offers the possibility to generate a visual block-oriented flowgraph representing the data flow and processing from the SDR input all the way to its final visualization. It can generate a Python script that can be run independently of GNU Radio. It has some drawbacks, due to the constant independent development by voluntary contributors:
• Scarce documentation, help file without much details on some of the existing blocks.
• Unpredictable problems when used in Windows OS distributions, though its operation runs almost flawlessly with Linux flavors. The main reasons are due to driver conflicts and Python versions.
• Its constant cooperative evolution has turned some blocks defunct (obsolete), such as the Valve and also the WX GUI, which was replaced by the current default QT GUI.
In spite of these issues, it provides a stable and free solution to work with SDR data. Tests are quickly deployed, and a large number of signal processing blocks are available, such as FFT, FIR, and IIR filters, data visualization, file export, etc. The user can take advantage of the reconfigurability feature of SDRs by connecting blocks following an intuitive data flow concept, sometimes performing complex functions in a transparent way to the user. Fig. 3 shows the used flowgraph, in the block diagram and in the GNU Radio. It contains an osmocom source block that interfaces the HackRF SDR, setting its main parameters such as LNA/IF/Baseband gains, central frequency and bandwidth.
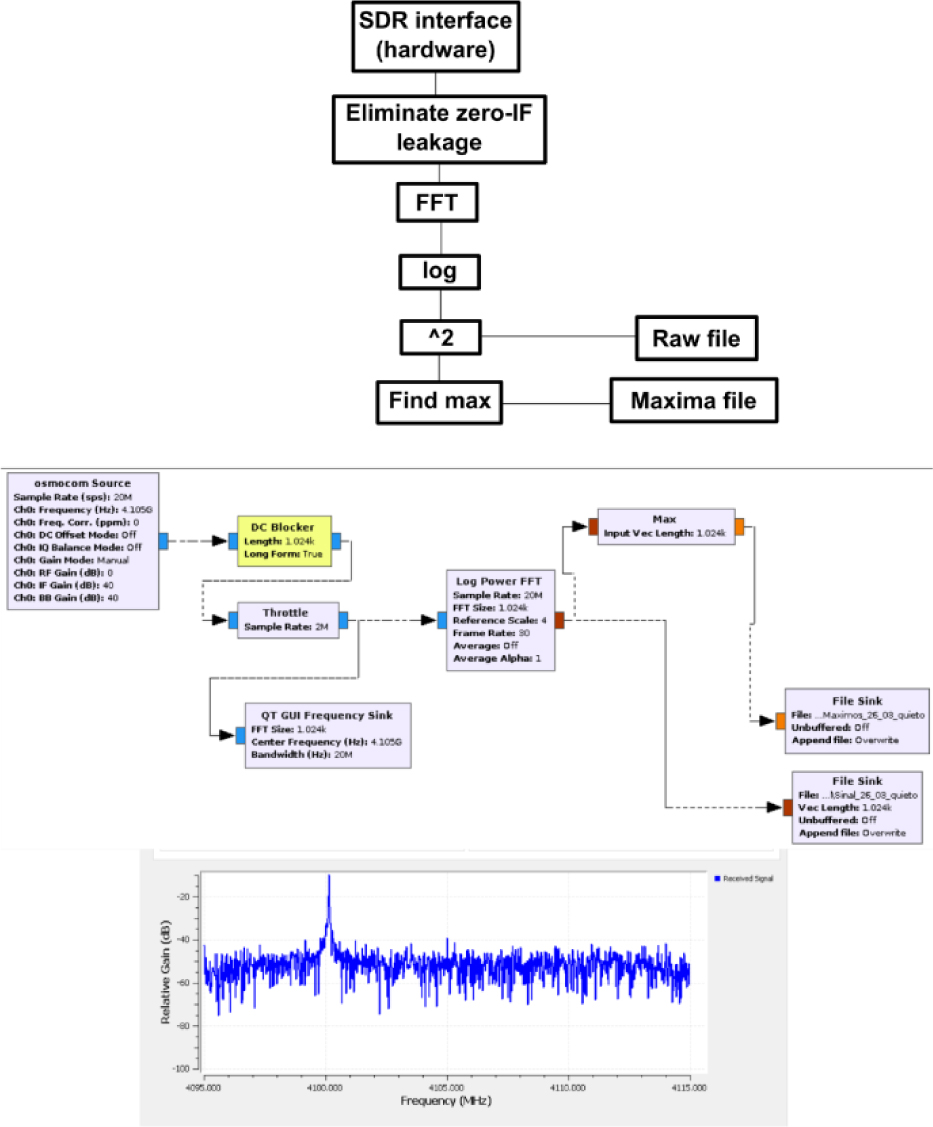
Figure 3: GNU Radio flowgraph (top), GNU Radio main blocks shown (center), and example of the receiving CW signal(bottom).
A DC block can be used to eliminate the zero-IF leak (which corresponds to the chosen central frequency), left bypassed in the final program for the sake of speed. The throttle block helps alleviate the processor overload, synchronizing the delivered samples, which otherwise flow among the blocks with its maximum allowed throughput, constrained only by the PC hardware. The stream undergoes an FFT operation and the maximum is found at every 1024 samples. The data is sent to two binary files, one containing the raw frequency domain values (real due to the log power FFT operation) and also their respective maxima, for comparison purposes. A Frequency sink block displays the instantaneous captured bandwidth in real-time, for visualization purposes and checking on the transmitted carrier. Bandpass filtering was also added to narrow down the frequency range across the transmitted CW carrier, but it resulted in a slower operation, with lost synchronization among the samples. For these matters, it was decided to keep the flowgraph as lean as possible and operate with binary files as output, to be later analyzed outside GNU Radio.
The created binary files are read out by means of Octave [18]/Matlab or Python commands, available for either complex or float values. In the present case, only float numbers are stored since the interest is in relative power.
4 RESULTS
The first set of measurements was performed indoors in an area of approximately 4x5 m2. Distances between the adult and radar varied from 0.5 to 4 m. Tests were performed with random movements and walking across the space using a normal gait. Figure 4 contains the plot for approximately 2 minutes. Units shown the power in dBr, relative dB used by GNU Radio, so conversion to dBm should require a calibration step against a known source. Since the interest lies in variation only, GNU Radio native dBr was kept throughout this evaluation. The maximum operation on the samples is shown against the raw signal, which contains 1024 more samples. The maxima vector is 2 kB whereas the raw signal is 1,300 kB. Output power was set to the minimum value, 4 dBm, and the SDR low-noise amplifier was switched off to avoid overloads. Oscillations seen in the still scenario vector are much less pronounced than in the samples during movement.
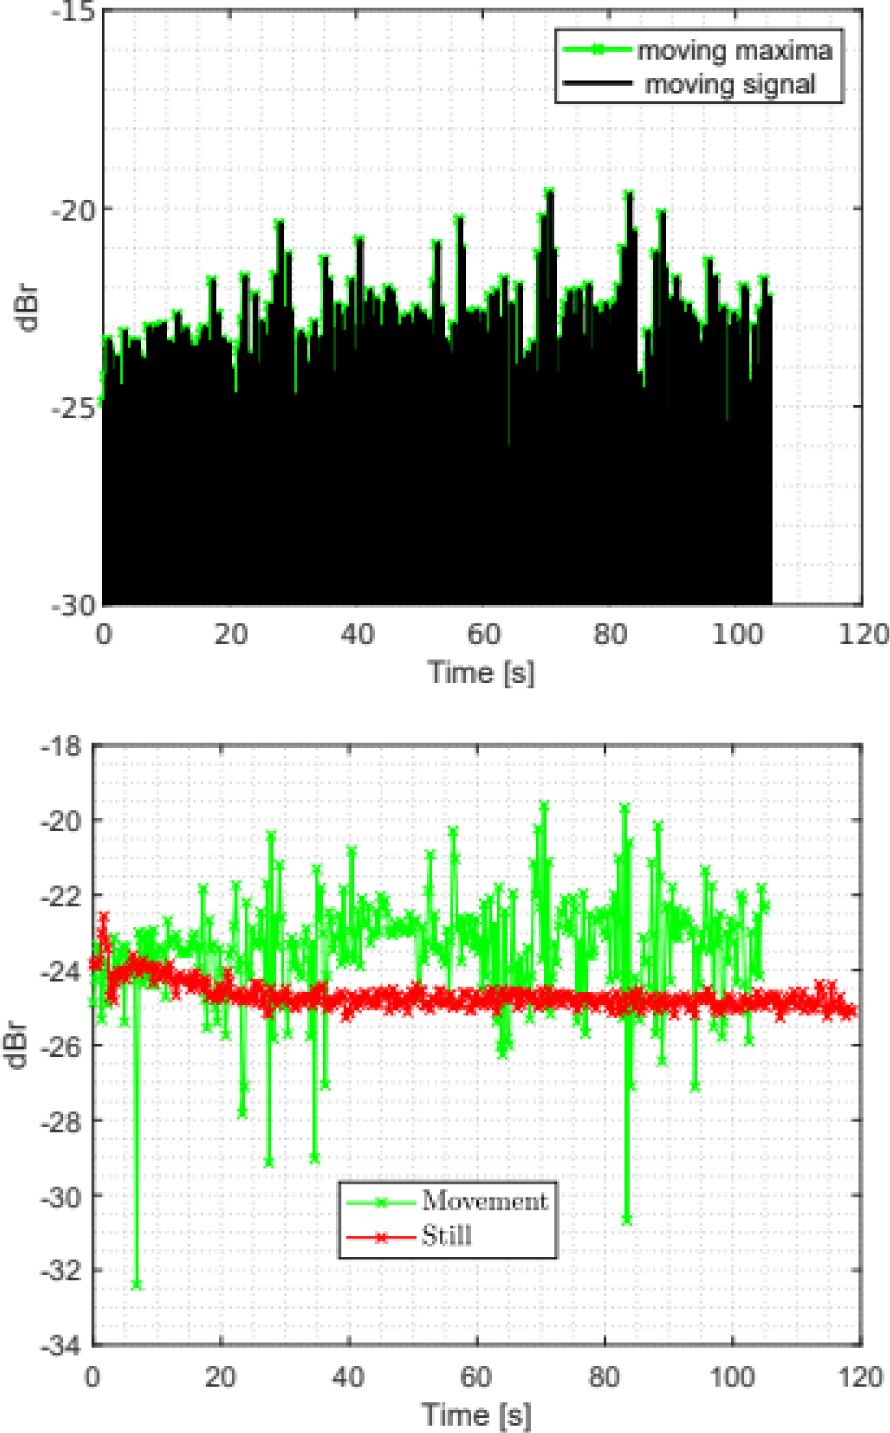
Figure 4: Indoor test. (Top) maxima and the raw signal for a moving target scenario; (bottom) comparison of both maxima vectors.
To evaluate the overall sensitivity, as well as outdoor operation, another set of tests was performed on a basketball court (Fig. 5), maintaining the same former power and gain settings. Ambient power spectra were recorded (20 MHz around the central frequency of 4,105 MHz) to see whether other emissions were present. The results are shown in Fig. 5. Unlike the chosen frequency of 4.1 GHz, at 4 G Hz broadband bursts were detected, which could eventually introduce errors in the measurement. It can be seen that movement cannot be visually detected from the waterfall plot, a further analysis is needed.
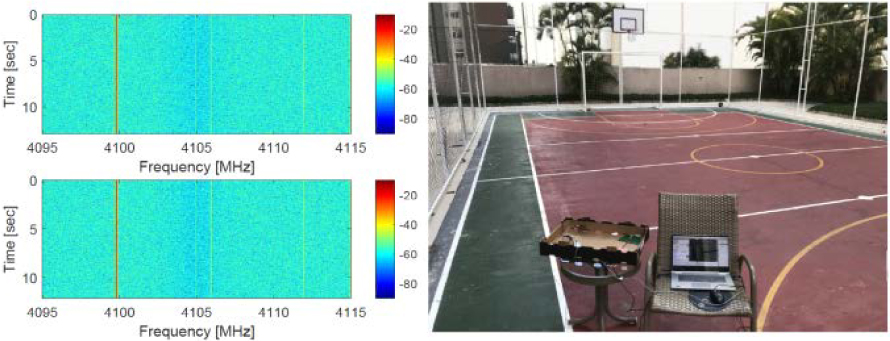
Figure 5: Outdoor range test site (right) and 12 secs waterfall depiction of spectrum monitoring for the moving (top left) and still (bottom left) cases.
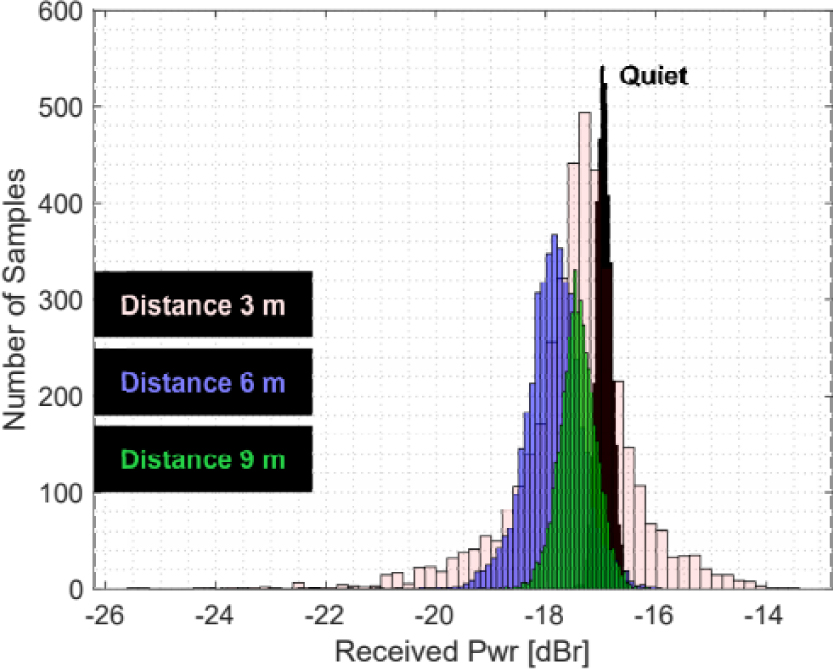
Figure 6: Histogram for the four different scenarios.
Table 1: Statistics for the different scenarios
| Scenario | Average [dBr] | Std. Dev. [dBr] |
|---|---|---|
| Still | 16.9 | 0.2 |
| 3 m | 17.5 | 1.1 |
| 6 m | 17.9 | 0.5 |
| 9 m | 17.4 | 0.4 |
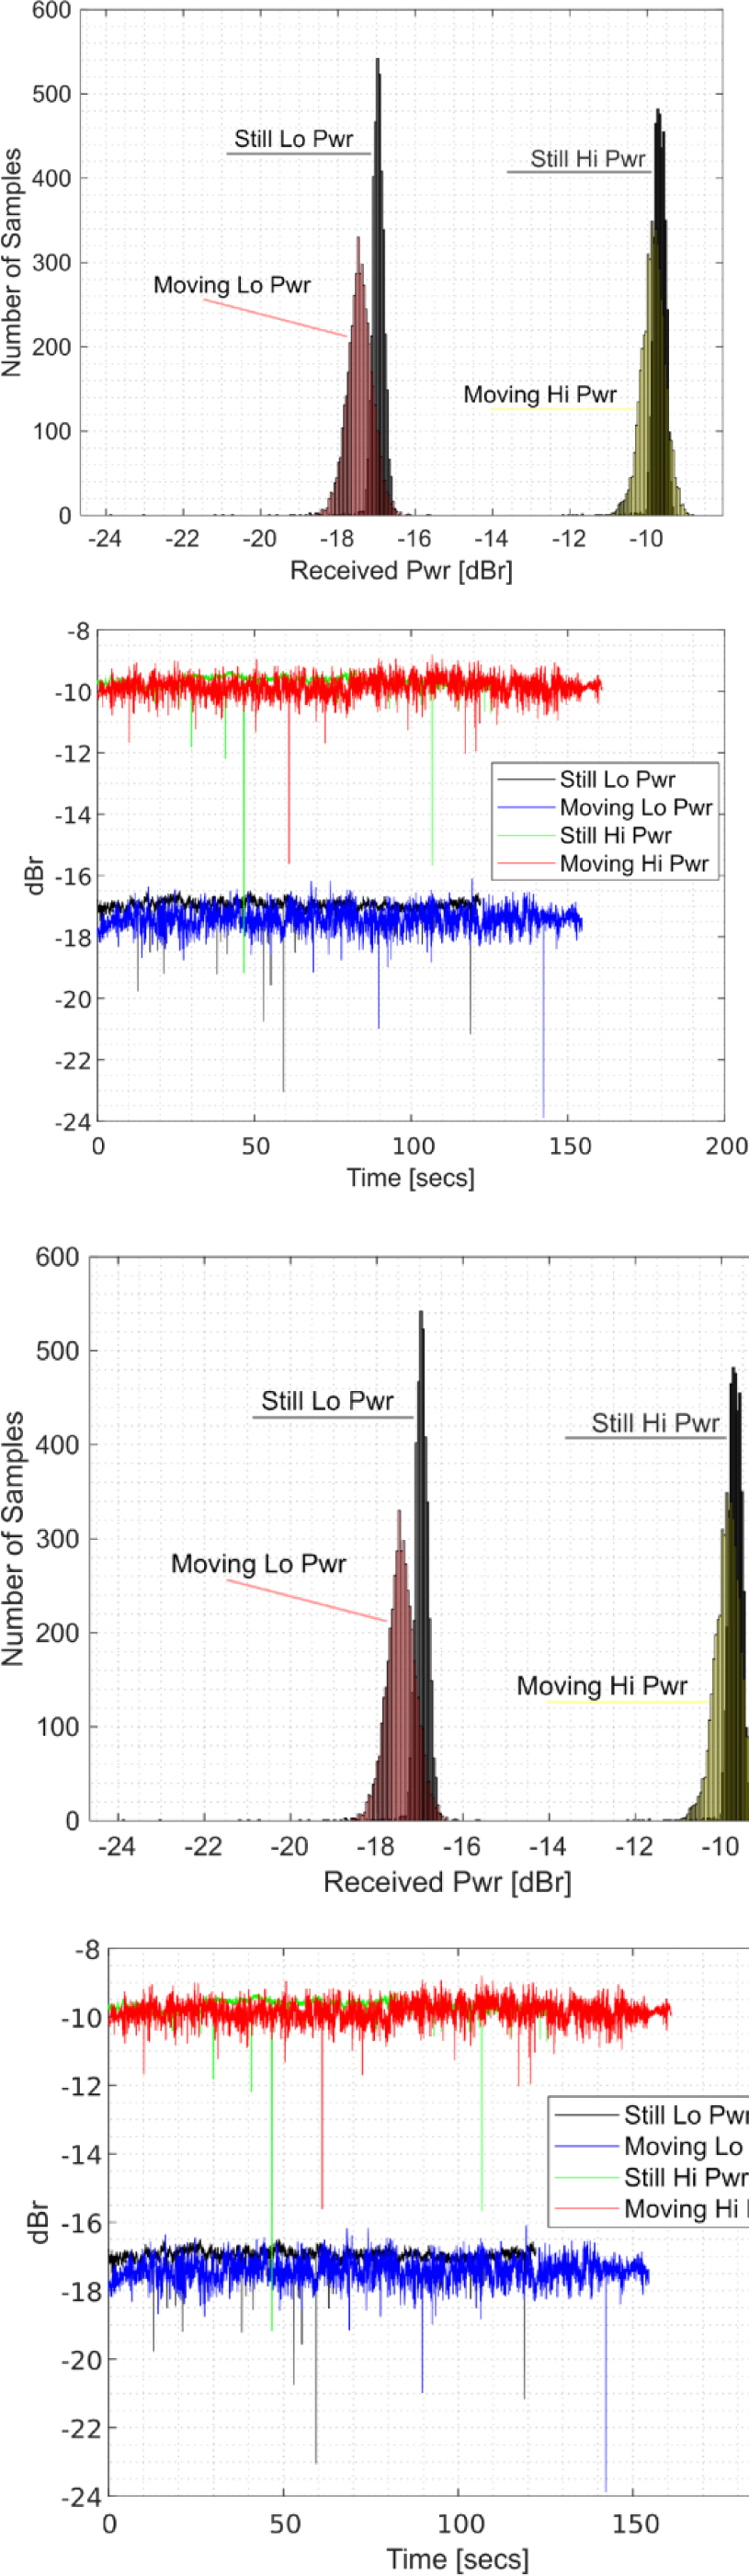
Figure 7: Time series of the maxima at 9 m, output powers of 5 dBm (“Hi Pwr”) and 4 dBm (“Lo Pwr”), bottom, and respective histogram, top.
Four measurements were performed, distances of 3, 6, and 9 m, compared with the reference (still) - results are shown in Fig. 6 - each containing approximately 120 seconds. It can be seen that even at 9 m, detection is still possible, visualized on the histogram by its larger variation around the average value. Statistics regarding the four time series are presented in Table1. Higher amplitude average power at 9 m than at 6 m can be ascribed to reflected energy by the ground, contributing in a constructive way to the receiving antenna.
A comparison was performed with the maximum and minimum synthesizer output powers (5 and 4 dBm), for the 9 m distance case. Results showing the maxima time series and the respective histogram are shown in Fig. 7. It can be seen that in spite of the lower output power the variance of the signal is larger, resulting in a higher sensitivity. Average and standard deviations are summarized in Table 2.
Table 2: Comparison of different output levels, 9 m distance
| Scenario | Average [dBr] | Std. Dev. [dBr] |
|---|---|---|
| Still 4 dBm | 16.9 | 0.2 |
| Still 5 dBm | 9.7 | 0.2 |
| 9 m, 4 dBm | 17.14 | 0.4 |
| 9 m, 5 dBm | 9.8 | 0.3 |
5 CONCLUSION
A low-cost radar applied to human detection, based on a software-defined radio, is presented. In addition to the SDR, other off-the-shelf RF components are two broadband planar antennas and an RF synthesizer. The detection is based on amplitude variations picked up by the receiver, compared to the baseline case where there is no movement (still). The present solution adapts to hardware restraints of the HackRF One SDR, which has only one RF input, therefore unable to provide Doppler or passive approaches unless extra hardware is added. The system was tested in real-world environments, both indoor and outdoor, whose sensitivity was evaluated against different statistics regarding human presence and still patterns. Further classification based on the specific deployed environment should operate using, for instance, machine learning, to compare existing time series and decide upon the presence or not of human activity. As a contribution, this article presents an alternative to other human activity detection, with advantages coming from the software-defined hardware, where different frequencies and power levels can be modified on-the-fly. It does not employ sophisticated RF elements such as circulators and external mixers. GNU Radio functionalities enable further useful possibilities, such as remote monitoring, using TCP/IP channels connecting both client and server, and also Python integration.
REFERENCES
[1] J. A. Nanzer “A review of microwave wireless techniques for human presence detection and classification,” IEEE Trans. Microw. Theory Techn., vol. 65, pp. 1780-1794, 2017.
[2] G. Wang, C. Gu, T. Inoue, and C. Li, “A hybrid FMCW-interferometry radar for indoor precise positioning and versatile Life activity monitoring,” IEEE Trans. Microw. Theory Techn., vol. 62, pp. 2812-2822, 2014.
[3] S. Yoo, S. Ahmed, S. Kang, D. Hwang, J. Lee, J. Son, and S. H. Cho, “Radar recorded child vital sign public dataset and deep learning-based age group classification framework for vehicular application,” Sensors, vol. 21 pp. 1-16, 2021.
[4] S. Lee, S. Y. Kwon, B. J. Kim, H. S. Lim, and J. E. Lee, “Dual-mode radar sensor for indoor environment mapping,” Sensors, vol. 21, no. 2469, 2021.
[5] Y. Wang, W. Wang, M. Zhou, A. Ren, and Z. Tian, “Remote monitoring of human vital signs based on 77-GHz mm-wave FMCW radar,” Sensors, vol. 20, no. 2999, 2020.
[6] E. Turppa, J. M. Kortelainen, O. Antropov, and K. T. Vital, “Sign monitoring using FMCW radar in various sleeping scenarios,” Sensors, vol. 20, no. 6505, 2020.
[7] F. Sekak, K. Zerhouni, F. Elbahhar, M. Haddad, C. Loyez, and K. Haddadi, “Cyclostationary-based vital signs detection using microwave radar at 2.5 GHz.,” Sensors, vol. 20, no. 3396, 2020.
[8] H. Zhao, H. Hong, L. Sun, Y. Li, C. Li, and X. Zhu, “Noncontact physiological dynamics detection using low-power Digital-IF Doppler radar,” IEEE Trans. Instrum. Meas, vol. 66, no. 1780-1788, 2017.
[9] R. Ashikur, I. Yuta, and L. Victor, “UAV radar system for vital sign monitoring,” Applied Computational Electromagnetics Society (ACES) Journal, 208-211, 2018,
[10] D. Yang, Z. Zhu, J. Zhang, and B. Liang, “The overview of human localization and vital sign signal measurement using handheld IR-UWB through-wall radar,” Sensors, vol. 21, no. 402, 2021.
[11] D. Wang, S. Yoo, and S. H. Cho, “Experimental comparison of IR-UWB radar and FMCW radar for vital signs,” Sensors, vol. 20, no. 6695, 2020.
[12] L. Amaduzzi and M. Tinti, “Low-cost components radiometer implementation for human microwave electromagnetic field emissions detection,” PIERS Letters, vol. 23, no. 9-18, 2011.
[13] B. Tan, K. Woodbrigde, and K. Chetty, “A real-time high resolution passive wifi Doppler-radar and its applications,” in Proc. 2014 International Radar Conf., pp. 13-17, 2014.
[14] A. C. Green, D. Coggon, R. de Séze, P. A. Gowland, C. Marino, A. P. Peralta, P. G. Söderberg, R. Stam, M. C. Ziskin, E. van Rongen, M. Feychting, M. Asmuss, R. Croft, G. D’Inzeo, A. Hirata, S. Miller, G. Oftedal, T. Okuno, M. Röösli, Z. Sienkiewicz, and S. Watanabe, “Icnirp statement on diagnostic devices using non-ionizing radiation: Existing regulations and potential health risks,” Health Phys., vol. 112, no. 305-321, 2017.
[15] Gnu Radio Project. Gnu radio. URL https://www.gnuradio.org.
[16] National Instruments. Labview. URL https://www.ni.com/pt-br/shop/labview.html.
[17] Mathworks. Matlab. URL https://www.mathworks.com.
[18] Octave Forge. Octave. URL https://octave.sourceforge.io/.
BIOGRAPHIES

Marcelo B. Perotoni Electrical Engineer (UFRGS, Porto Alegre, Brazil) received an Ms.C. and Ph.D. in Electrical Engineering from USP(Sao Paulo, Brazil). He is currently a professor at UFABC.

Kenedy M. G. Santos has a B.Sc. in Electrical Engineering (PUC MG), an M.Sc. in Electrical Engineering UFMG, and a PhD. in Electrical Engineering UFBA. Currently, he is a professor at IFBA. He has experience in EMC

Danilo B. Almeida has a B.Sc. in Electrical Engineering (2005) –UNIP – SP. He is a specialist in occupational safety and energy efficiency. Currently, he is a professor at the IFBA.

Daniel Jonathas Electrical Engineering Student from IFBA. IEEE member and the Vice President of the IEEE MTT-S IFBA VDC Chapter.
ACES JOURNAL, Vol. 37, No. 7, 826–832.
doi: 10.13052/2022.ACES.J.370710
© 2022 River Publishers