Analyze the Crosstalk of Multi-core Twisted Wires and the Effect of Non-matched Impedance Based on BSAS-BPNN Algorithm
Fubin Pang, Jianfei Ji, Jiafei Ding, Wu Zhang, Dong Xu, and Mengxia Zhou
1State Grid Jiangsu Electric Power Co., Ltd. Research Institute, Nanjing 211103, China
pangfubin2006@163.com, 15105175122@163.com
2School of Electrical & Automation Engineering, Nanjing Normal University, Nanjing 210046, China
2269533002@qq.com, m13571872250@163.com, xd2636864610@outlook.com
*Corresponding author: 61239@njnu.edu.cn
Submitted On: April 15, 2022; Accepted On: November 7, 2022
ABSTRACT
In this paper, a multi-core twisted wire model with random non-uniform twists is established. The random combination of complete and non-complete pitch sections is used to accurately simulate the randomness of actual multi-core twisted wires. On the basis of the model, the cross section of the cascaded MTL is obtained, and a neural network algorithm is used to describe the complex relationship between the arbitrary position of the multi-core twisted wires and the unit length parameters. The unit length parameters at any position are obtained by cross section rotational transformation and random transposition transformation between conductors. Finally, the crosstalk in electromagnetic compatibility performance is calculated, and different termination impedances are analyzed. The results show that the crosstalk of multi-core twisted wires is susceptible to the effects of twisting and termination impedance at high frequencies, and the reliability of the proposed method is verified by comparison with full-wave simulation.
Index Terms: BSAS, chain parameters, crosstalk, electromagnetic compatibility (EMC), multi-core twisted wire, non-uniform twisting, neural network algorithm.
I. INTRODUCTION
Multi-core twisted wires, which often transmit high-speed data between different electronic devices, have the characteristics of low loss, low cost, and small coupling [1–3]. They are widely used in many electrical and electronic systems and other industrial equipment, but they are susceptible to unintentional and intentional electromagnetic interference, where crosstalk becomes important noise in multi-core twisted wires [4, 5], which may lead to electromagnetic compatibility (EMC) problems.
The traditional modeling method is the transmission line model (TLM). In 1980, Taylor and Spadacini et al. initially studied the field-to-line coupling model of twisted wire pair (TWP) placed in the reference plane [6–8] and free space [9]. In [10], the crosstalk between multi-core twisted wires with equal and unequal twist rate was compared, and [11] proposed a multiconductor TLM for analyzing crosstalk of shielded random twisted pair bundles. In addition to crosstalk, [12] studied the influence of non-uniform twist-pitch on the radiated susceptibility of a TWP, and [13] studied the random response of non-uniform multi-strand twisted pairs (MTB-TWP) excited by random plane waves.
In addition to the difference in the model and EMC response of the multi-core twisted wire, there are also differences in the solution method. Based on the TLM method proposed in [5], a closed-form analytical approximation of plane wave coupling is proposed. For non-uniform multiconductor transmission lines, [14, 15] proposed a method for predicting the response of a single TWP and TWP bundles when there is a ground plane illuminated by a plane wave electromagnetic field. In addition, researchers have focused on its statistical characteristics. In [16], a Monte Carlo algorithm was introduced to statistically represent the randomness of manually assembled cables. Furthermore, the random midpoint displacement algorithm [17, 18] and the random displacement spline interpolation method [12] are used to model the randomness of cables. Reference [19] uses cubic Hermite interpolation polynomial to ensure the continuity of the wire. Reference [13] uses the polynomial chaotic random Galerkin method (PC-SGM) to respond under random plane waves.
In this paper, a cross-sectional model of uniform twisted wire is established, and based on this, a cross-sectional model of non-uniform twisted wire is obtained by a neural network method and matrix transposition. The relationship between the unit length parameter matrix at different positions and the degree of twisting and cross section are successfully described mathematically. Using the chain parameter model, near-end crosstalk (NEXT) and far-end crosstalk (FEXT) are given, and numerical experiment results verify the effectiveness of the method. Through a numerical calculation, the terminal crosstalk response of the line can be obtained.
This paper is organized as follows. In Section II, the geometric model and circuit model of multi-core twisted wires with uniform twist and non-uniform twist are established. In Section III, the PUL parameter at any position is obtained through the neural network algorithm and matrix transposition. Secondly, the crosstalk is calculated based on the chain parameter theory of the cascade method. The comparison verification by the numerical simulation technology of the method of moment (MOM) is given in Section IV, and the results of crosstalk and different terminal loads are analyzed. In Section V, conclusions are given.
II. MULTI-CORE TWISTED WIRE MODEL
A. Geometric model
In the ideal case, the four core twisted wire is uniformly twisted and has a uniform fixed pitch p, as shown in Fig. 1. However, in common engineering practice, multi-core twisted wires will have random non-uniform twists due to artificial and environmental influences. It is a model under the common combination of different complete pitch segments (a certain cable length l is an integral multiple of the corresponding pitch p) and different incomplete pitch segments (a certain cable length l is a non-integral multiple of the corresponding pitch p at that location). This non-uniform twisting model is shown in Fig. 2, which is essentially a non-uniform transmission line.
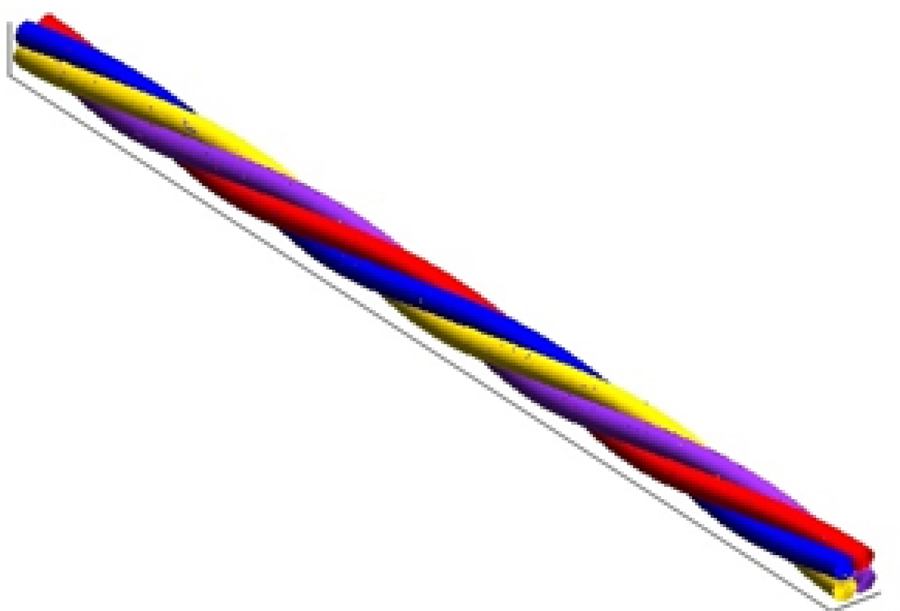
Figure 1: Uniform twisting model.
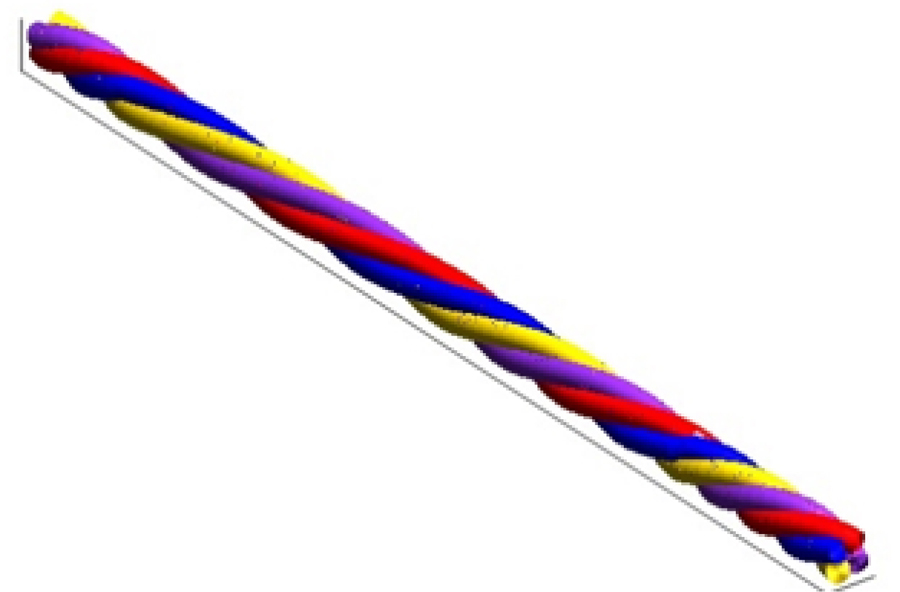
Figure 2: Non-uniform twisting model.
The conductor is cylindrical conductor with insulation layer, the radius of conductor is r, the height of the center of twist is h, and the length of multi-core twisted wire is L. The wires are twisted along the z-axis. Taking a four core conductor as an example, the central point position of the four conductors is , under the same abscissa z, it can be expressed as follows:
| (1) |
where are the unit vectors of the xyz axis respectively. is the rotation angle of the section at each position z.
Fig. 3 shows the transposition of the wires corresponding to the twisting of the four core twisted wire in a pitch p. It can be seen that the cross-sectional rotation angle relative to the initial position and the position z satisfy the functional relationship:
| (2) |
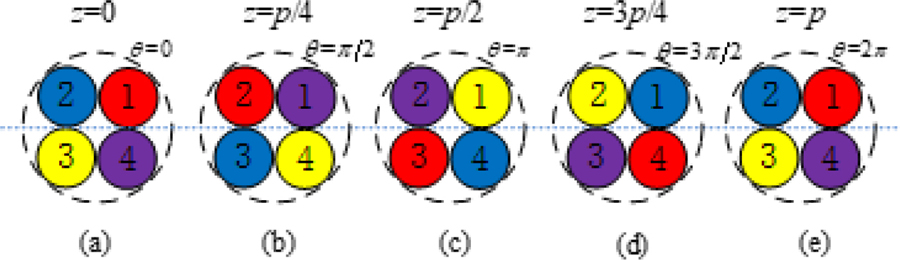
Figure 3: Sections and rotation angles corresponding to different z values.
Considering the establishment process of the non-uniform model, the cross section and rotation angle of each z value are obtained by changing the pitch length and the transmission line length under the corresponding pitch type. Take L as the set of z values in a certain section of the twisted wire, p is the pitch length of the complete and uniform twist at that place, and l is the length of the corresponding section along the axial direction (may be an incomplete twist). Then the rotation angle of the section in each section of L is:
| (3) |
The case of i = 1 corresponds to the case of uniform twisting, and the number of pitch types of general non-uniform twisting is greater than or equal to 2.
B. Circuit model
The large electromagnetic noise interference caused by multi-core twisted wire is mainly expressed by the crosstalk of the line to the line. Figure 4 shows the terminal conditions at both ends of the multi-core twisted wire model and the equivalent circuit per unit length of the multi-core twisted wire.
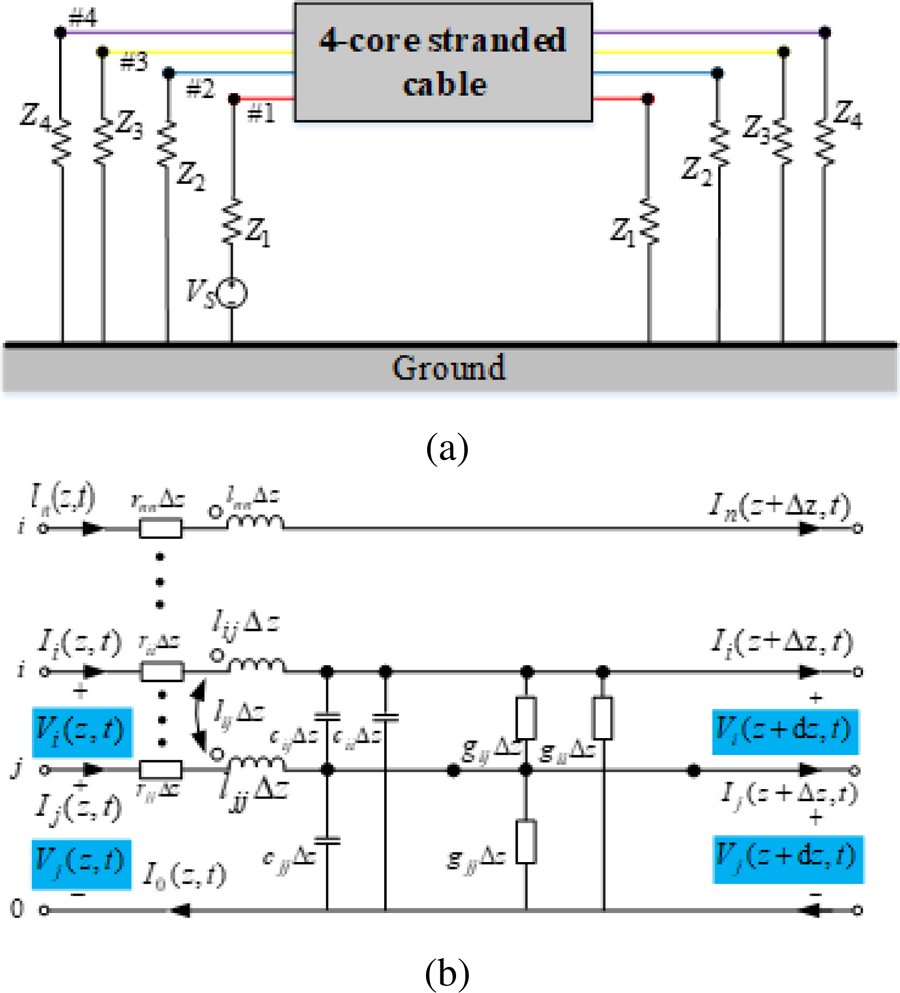
Figure 4: Terminal conditions and equivalent circuit: (a) Termination impedance and power supply. (b) The equivalent circuit per unit length of the multi-core twisted wire.
The voltage and current of the transmission line satisfy the following equation:
| (4) |
where V(z) and I(z) represent the voltage and current vectors at different positions. Z(z) and Y(z) represent the corresponding impedance and admittance at different positions, which can be expressed as:
| (5) |
where R(z), L(z), C(z), G(z) respectively represent the resistance, inductance, capacitance, and conductance matrix of the corresponding cross section at different positions, namely the per unit length (PUL) parameter matrix. They are all symmetric matrices of order nn. is the angular frequency of the signal source.
For the convenience of modeling and the unity of description, the four parameter matrices are represented by X. In the model of four core twisted wire with uniform twist, because the rotation of twisted wire is uniform, the parameter matrix X of uniform cross section model in 090, 90180, 180270, 270360 is the same, but the position is different, so long as the corresponding transformation is carried out:
| (6) |
where , P is the rotation matrix, in the model of this paper:
| (7) |
In the ideal conductor, in some cases, if the harness of the transmission line has strong conductivity and good insulation performance, it can be regarded as a lossless ideal conductor, that is, R(z) = G(z) = 0. The corresponding line to line coupling equations for multiconductor transmission lines degenerate into:
| (8) |
III. SOLUTION OF PUL PARAMETERS AND CROSSTALK RESULTS
A. Acquisition of PUL parameters
Since the RLCG parameter matrices at different positions are different, but due to the geometric characteristics of the multi-core stranded wire, only the RLCG parameters of 090 are needed to obtain.
However, different positions z correspond to different parameter matrices, and it is difficult to obtain a parameter matrix of any angle in the traditional way. Any certain rotation angle of the cross section has its unique corresponding parameter matrix, and there is a nonlinear mapping relationship between the rotation angle and the parameter matrix. The transformations of the four parameter matrices are all the same. For simple description, the PUL parameter matrix can be expressed as:
| (9) |
where x represents the specific resistance value r, inductance value l, capacitance value c and conductance value gcorresponding to different parameter matrices. There is a complicated mathematical relationship between it and the angle. Therefore, a neural network optimized by the BSAS method can be used to describe this complex mapping relationship. The network topology is shown in Fig. 5.
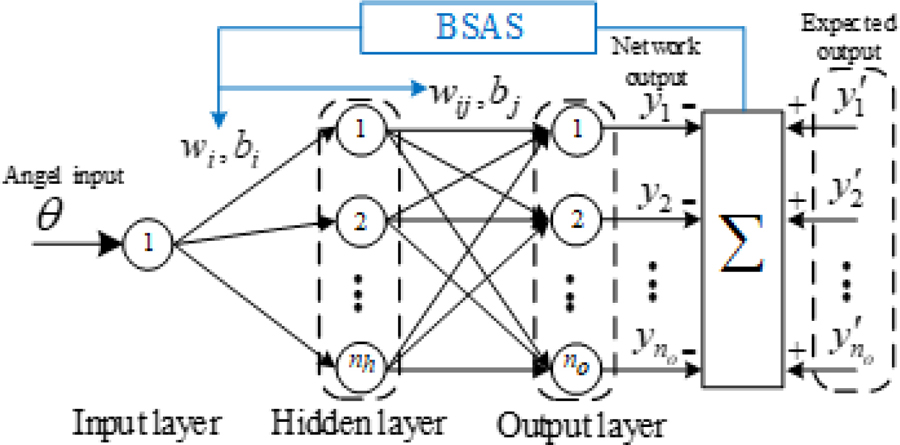
Figure 5: BSAS-BP neural network topology.
The network is that the number of input layers is 1, that is, the input is the cross-sectional rotation angle , the number of hidden layers is n, and the number of output layers is n, that is, the output is a column vector composed of the upper triangular elements of the parameter matrix in Equation (4):
| (10) |
The weights and thresholds are optimized using the BSAS optimization algorithm. The specific steps are as follows:
(1) Determine the optimized objective function
The output value of the network is:
| (11) |
Arrange all the weights and thresholds to indicate the position of the longhorn beetle in the high-dimensional space:
| (12) |
For N groups of data, the mean square deviation between the network output value and the actualvalue is:
| (13) |
where is the actual given parameter matrix data value, f(w) is the optimized objective function.
(2) Initialize the beetle position vector w and the optimal value of the objective function f
| (14) |
where w represents the initial position of the longhorn beetle in the high-dimensional data space. k represents the dimension of the weight vector, and rands represents a row vector that obeys a uniform distribution.
(3) Randomly generate the search direction and location of M groups of longhorn beetles:
| (15) |
where represents the nth direction in the tth iteration process, t = 0,1,2,….,n = 1,2,…,M.
(4) Obtain the optimal objective function value
Calculate the position of left and right whiskers of longicorn beetles:
| (16) |
where d is the distance between the left and right whiskers of longicorn beetles, and the sensory intensity of left and right whiskers of longicorn beetles is calculated:
| (17) |
(5) Update longicorn position:
| (18) |
| (19) |
where is the longhorn beetle step size, the general initial step size is , sign is the sign function, and the output result is plus or minus 1.
(6) Update the step length and the distance between left and right whiskers of longicorn beetles:
| (20) |
For the new one , the position of longicorn in each search direction can be obtained and the next iteration can be carried out. Until the iteration reaches the maximum iteration or the minimum error value is satisfied, the iteration is stopped to obtain the global minimum of the average error.
The PUL parameter matrix of any rotation angle can be predicted by the network trained by the pre-extracted data. Considering the symmetry of TWP cross section and periodicity of rotation angle, the angle of training network only needs to be 090.
Considering the situation of non-uniform twisting, random transposition between wires will occur, as shown in Fig. 6.

Figure 6: Random transposition occurs.
First consider that only two conductors are transposed, that is, the ith conductor and the jth conductor are interchanged. The unit PUL parameter matrix X’ after transposition can be expressed as:
| (21) |
The transformation matrix T can be used to represent the transformation of the PUL parameter matrix before and after transposition:
| (22) |
where the transformation matrix is:
| (23) |
When multiple wires are randomly transposed in the wiring harness, the corresponding parameter matrix can be expressed as:
| (24) |
where T is the kth transposition, that is, the matrix corresponding to the transposition between certain two conductors, and satisfies 1 k n-1, and n is the number of the cores.
B. Solving crosstalk with chain parameters
As discussed in the previous section, different positions z and the rotation angle of the cross section can be transformed into each other. In the uniformly twisted multi-core twisted wire model, the PUL within 090 can be obtained through BSAS-BPNN. The PUL within 90180,180270,270360 can be obtained by transforming the rotation matrix P. In the non-uniform twisted multi-core twisted wire model, the PUL within 090 can still be obtained by BSAS-BPNN, but the random transposition of the conductor caused by the non-uniform twist can be obtained by the transposition matrix T transformation.
Considering the terminal impedance and power supply in Fig. 4, the transmission line equation can be converted to:
| (25) |
The original equation can be reduced to:
| (26) |
where r is a diagonal matrix of , and .
Considering Equation (4), the relationship between voltage and current is characterized by port. As shown in Fig. 7, it is the chain parameter port based on the cascade idea.
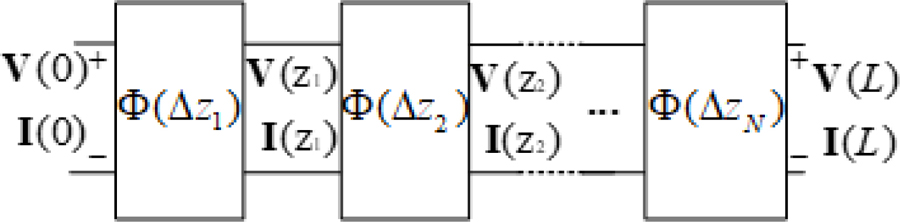
Figure 7: Transmission line chain parameter model.
Therefore, the voltage and current across each port satisfy:
| (27) |
As shown in Fig. 7, get different chain parameter matrix:
| (28) |
where , , , are the chain parameter subarrays, they are:
| (29) |
Combining the BSAS-BPNN algorithm to obtain the PUL at any position z, all the chain parameters can be obtained by using Equation (29).
The chain parameters of the transmission line are:
| (30) |
where N is the divided length of the transmission line, then the voltage and current between the near-end (z = 0) and the far-end (z = L) of the transmission line are:
| (31) |
The terminal constraints are:
| (32) |
where V = [V;0;0;0] is the near-end termination voltage source, and Z is the near-end termination impedance. V = [0;0;0;0] is the far-end termination voltage source, and Z is the far-end termination impedance.
Solve for near-end crosstalk (NEXT) and far-end crosstalk (FEXT) as:
| (33) |
IV. NUMERICAL EXPERIMENT VERIFICATION AND ANALYSIS
A. Validation of the proposed method
The wire used in this article is a copper core wire, the outer insulating material is PVC, and its thickness is 0.655 mm. In the transmission line, the conductor radius r = 0.335 mm, the ground height h = 15 mm, the transmission line length L = 1 m, which is divided into N = 2000 sections. A small number of PUL parameter matrices are obtained through the finite element method for network training.
In a uniform stranded wire, the method in this paper is used to apply a voltage source to the No. 1 conductor, with the frequency of the power supply range from 0.1 MHz to 1 GHz. The crosstalk results of the Nos. 2, 3 and 4 conductors are calculated and compared with the one based on MOM. As shown in Figs. 8, 9 and 10, it can be seen that there is a high degree of agreement. The effect in the low frequency band (f100 MHz) is better than that in the high frequency band (f500 MHz), and the trend of change the peak and the valleys of the graph are very similar, which can prove the reliability of the method in this paper.

Figure 8: Crosstalk of No. 2 conductor in uniform stranded wire (a) NEXT, and (b) FEXT.

Figure 9: Crosstalk of No. 3 conductor in uniform stranded wire (a) NEXT, and (b) FEXT.
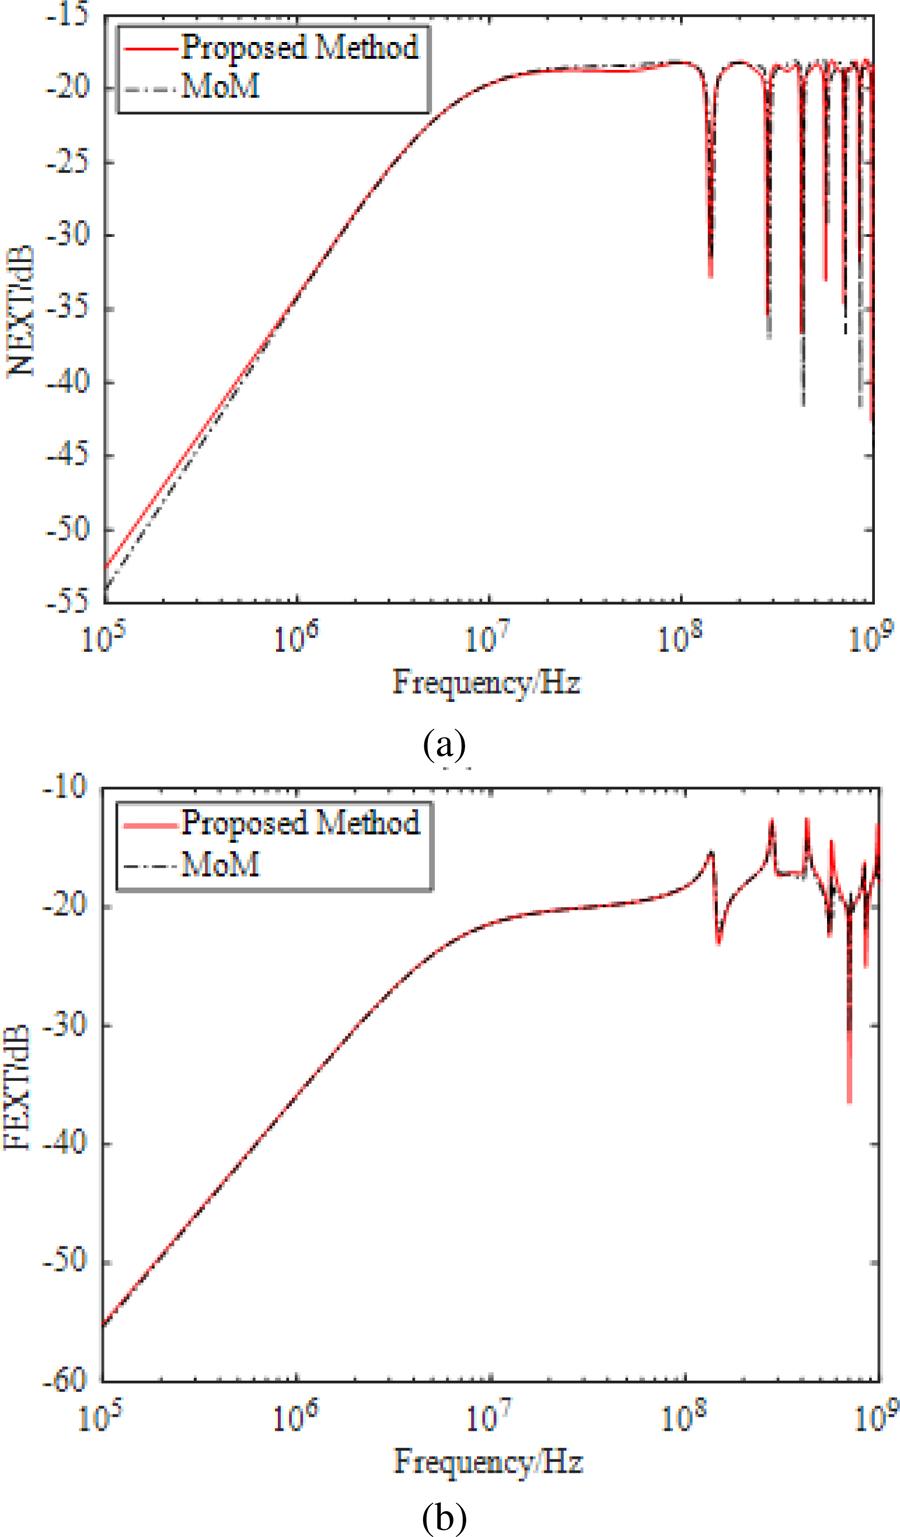
Figure 10: Crosstalk of No. 4 conductor in uniform stranded wire (a) NEXT, and (b) FEXT.
It can be seen that the NEXT and FEXT of No. 2 conductor and No. 4 conductor are very close. This is because the power is applied to No. 1 conductor and the disturbed conductor No. 2 and No. 4 are symmetrically distributed with each other, so the crosstalk magnitudes are so close. In addition, the NEXT of the three conductors has a large change in the high frequency range, while the FEXT has a small change in the high frequency range. This may be because the NEXT is closer to the power supply and is affected more.
Table 1: Average error of NEXT (dB)
| Conductor | 0.0001-0.1GHz | 0.1-0.5GHz | 0.5-1GHz |
|---|---|---|---|
| No. 2 | 0.21 | 1.11 | 1.82 |
| No. 3 | 0.30 | 1.51 | 2.12 |
| No. 4 | 0.21 | 1.25 | 2.01 |
Tables 1 and 2 are the average error of NEXT and FEXT between the proposed method and MOM. The average error of both is less than 1 dB in 0.1100 MHz, 2 dB in 0.10.5 GHz, and 3 dB in 0.51 GHz. Compared with NEXT, the average error of FEXT has a smaller difference. Therefore, from the average error point of view, the method in this paper is more accurate in the low frequency and mid–high frequency range. This result further proves that the crosstalk of the uniformly twisted multi-core stranded wire in this paper has a relatively accurate predictive ability.
Table 2: Average error of FEXT (dB)
| Conductor | 0.0001-0.1GHz | 0.1-0.5GHz | 0.5-1GHz |
|---|---|---|---|
| No. 2 | 0.03 | 0.34 | 0.73 |
| No. 3 | 0.10 | 0.34 | 0.50 |
| No. 4 | 0.03 | 0.31 | 0.81 |
B. Crosstalk of non-uniform model
The crosstalk results of non-uniform twisting are shown in Fig. 11. Figures 11 (a) and (b) are NEXT and FEXT, respectively. It calculates 600 sets of models, corresponding to 1800 NEXT and FEXT curves each, which more accurately describes the range of non-uniform twisted wire crosstalk. The green dashed line represents the upper envelope value and lower envelope value of the crosstalk, which represent the crosstalk amplitude boundary under the “worst case”.
It can be seen that both NEXT and FEXT are very close in the low frequency, while NEXT fluctuates larger in the high frequency, and FEXT fluctuates less. The frequency points of the peak and the valleys are very consistent, but NEXT has more valley frequency points, and FEXT has less valley frequency points.
The maximum value of the upper and lower envelope width of NEXT is 60.534 dB, which is much higher than the maximum value of FEXT’s upper and lower envelope width (22.983 dB), and the corresponding frequency of the maximum width is in the high frequency range. Within 0.1 MHz–100 MHz, the average width of the upper and lower envelopes of the NEXT is 1.322 dB greater than the average width of the upper and lower envelopes of the FEXT (0.428 dB). It can be seen that NEXT is easily affected by high frequency signals, which has limited impact on FEXT. Additionally, NEXT is easily affected by the twisting of multi-core twisted wires, while the change of twisting has low influence on FEXT. As the complexity of twisting increases, the curves of NEXT and FEXT will gradually become similar.
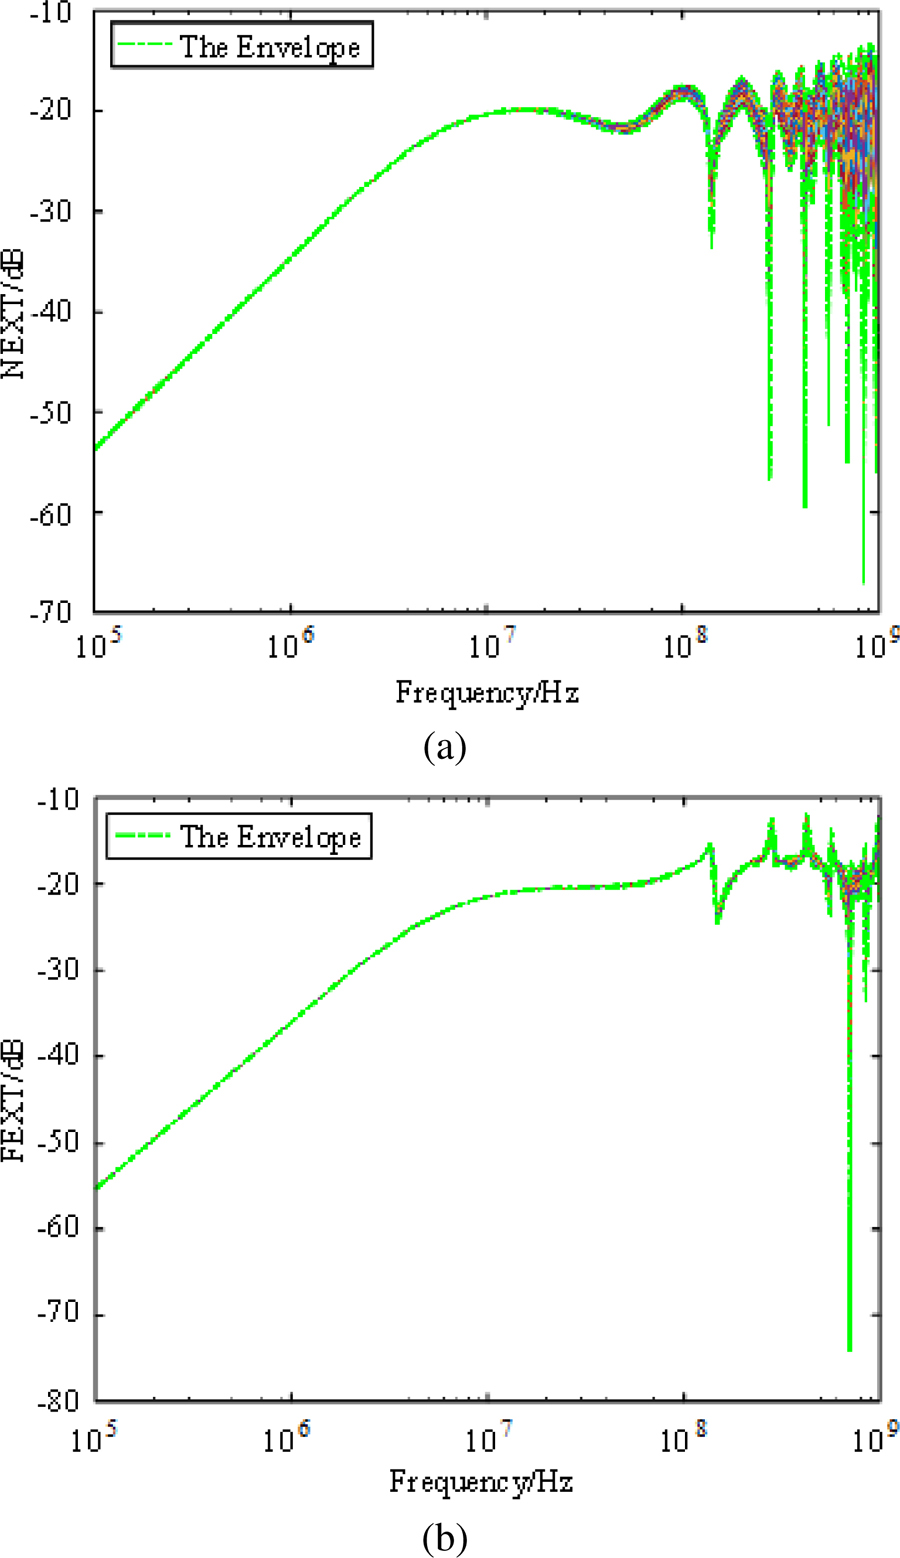
Figure 11: Crosstalk of non-uniform twisted wires (a) NEXT, and (b) FEXT.
C. The crosstalk of terminating different impedances
The crosstalk of terminating different impedances is shown in Fig. 12. Figures 12 (a) and (b) are the NEXT and FEXT curves of terminal matching impedance 50ohm, non-matching resistance 1000 ohm and 3000 ohm. It can be seen that in the low frequency range, both the sizes of NEXT and FEXT are increasing with the increase of load impedance. In the vicinity of 100 MHz, its size decreases as the load impedance increases. In the high frequency range, its changes are more complicated but the trend of changes will basically not change. The maximum amplitude of NEXT has not changed significantly. No matter how the load impedance changes, its value is stable on the same horizontal line, while the maximum value of FEXT decreases as the load impedance increases.
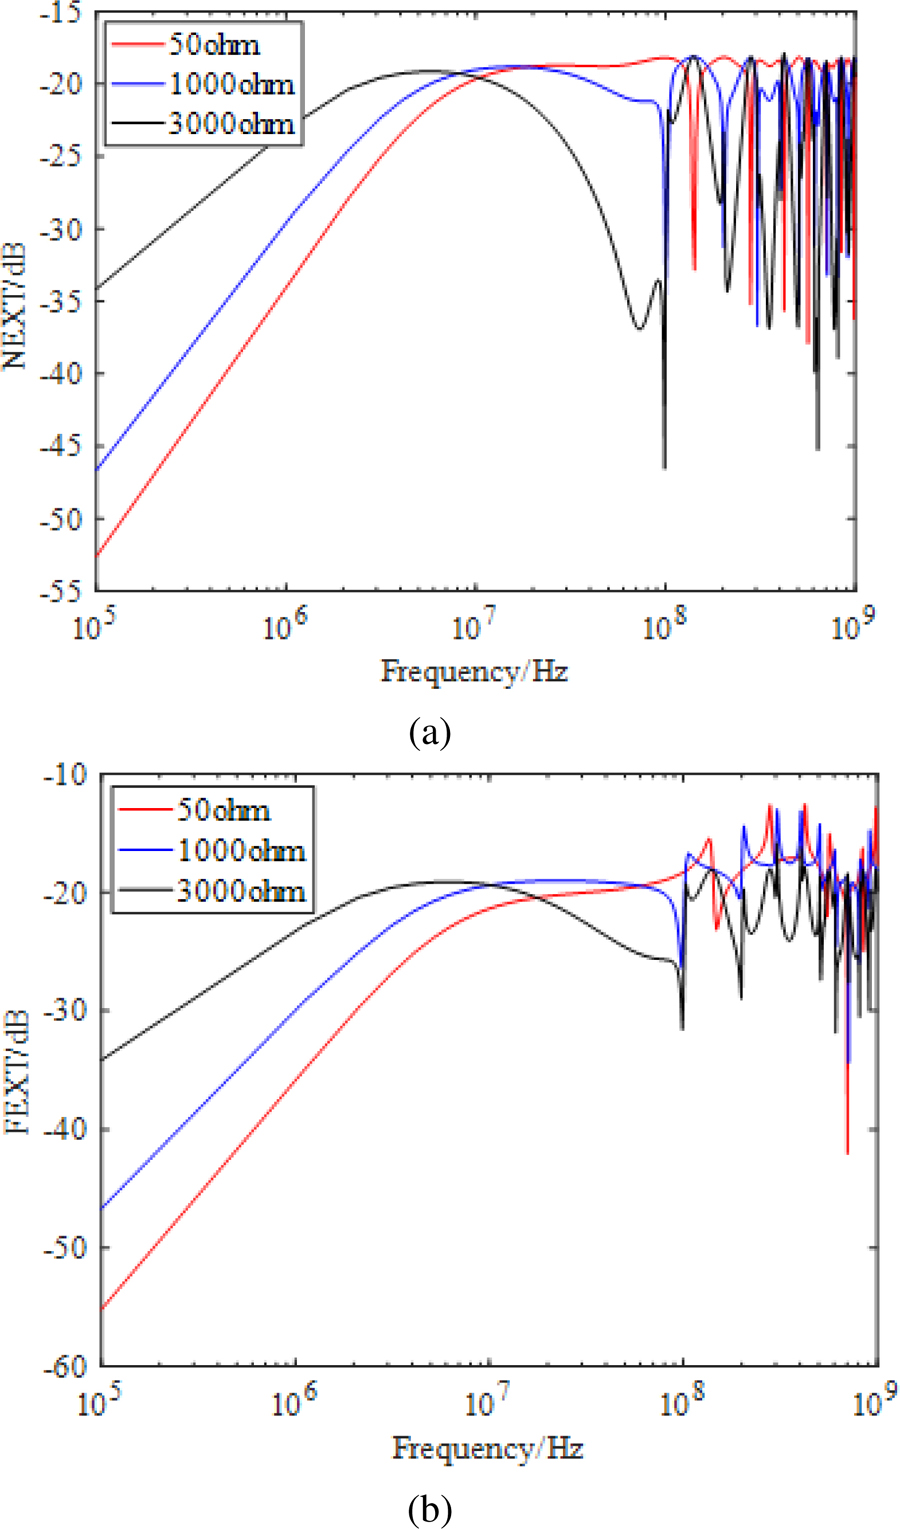
Figure 12: The crosstalk of terminating different impedances (a) NEXT, and (b) FEXT.
The crosstalk of terminating arbitrary impedance is shown in Fig. 13. Figures 13 (a) and (b) are NEXT and FEXT. A total of 600 sets of terminal loads have been calculated, from 50 ohm to 5000 ohm, corresponding to 1800 NEXT and FEXT curves each, which more accurately describes the impact of different terminal impedances on crosstalk.
It can be seen that NEXT and FEXT curves have opposite trends with impedance on both sides of 106 Hz. And it will cause the original resonance frequency point (108 Hz) of the 50 ohm matching impedance to move forward to 108 Hz after the termination impedance changes. In addition, at certain frequency points, as the termination impedance changes, the peaks and valleys of the original crosstalk curve will be interchanged. However, with the increase and change of the termination impedance, some common resonance frequency points are more clearly displayed, which will have a guiding role for subsequent EMC applications.
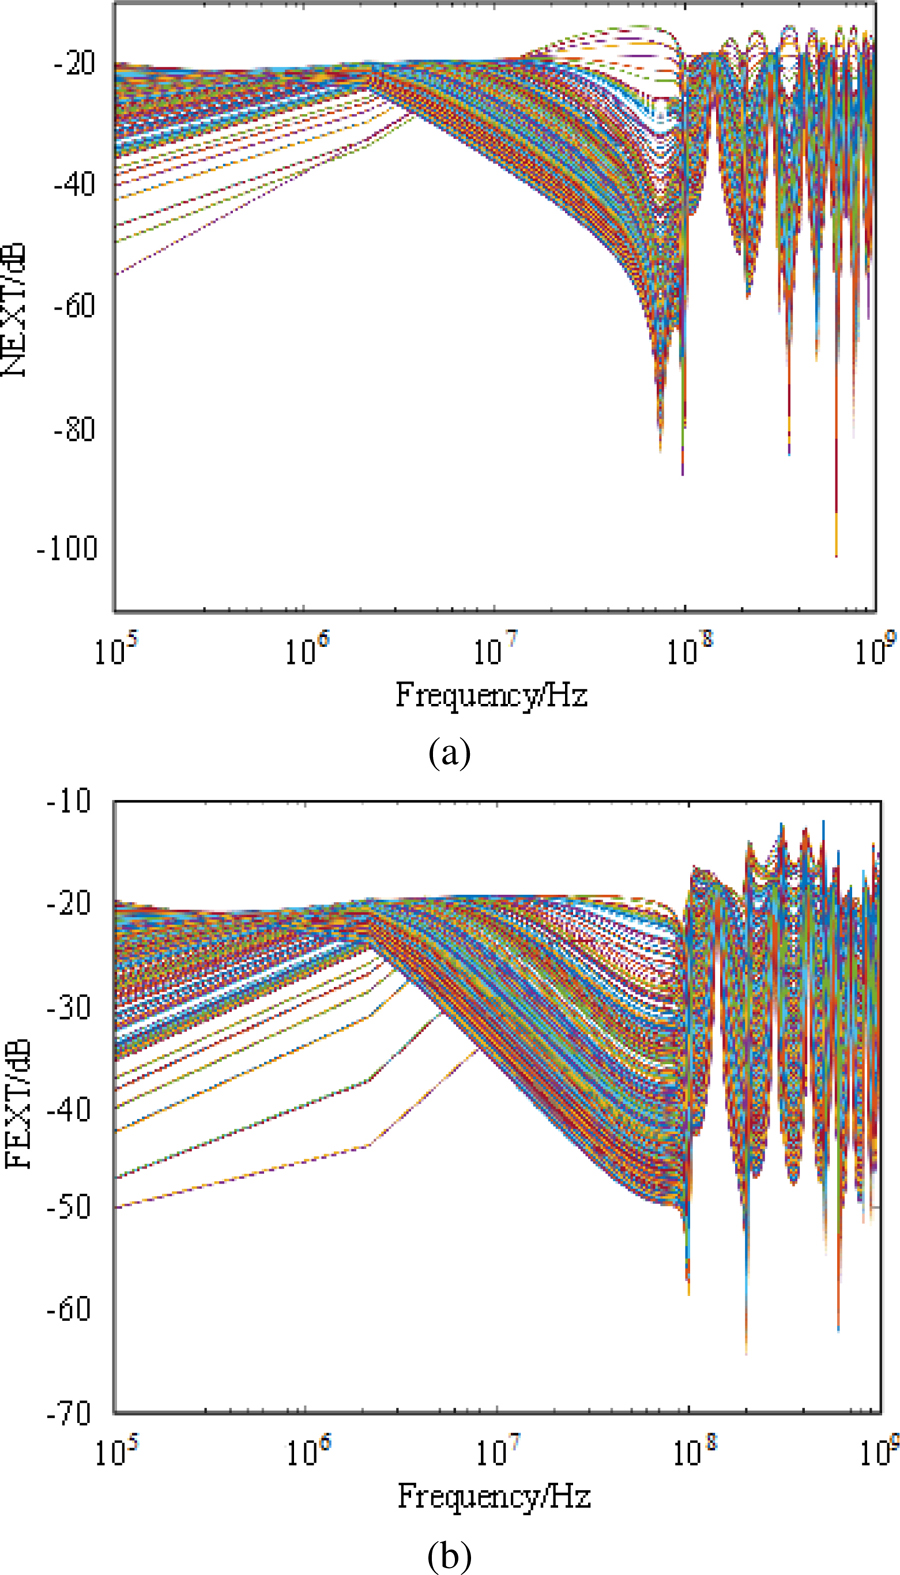
Figure 13: The crosstalk of terminating arbitrary impedance (a) NEXT, and (b) FEXT.
V. CONCLUSION
In this article, a model of multi-core stranded wire is proposed. This model includes both uniform twisting and non-uniform twisting, which overcomes the randomness problem in the multi-core stranded wire model.
In addition, the PUL parameter matrix within the rotation angle of the cross section is obtained through a neural network algorithm. The PUL parameter matrix under arbitrary position and non-uniform twisting is extracted. The crosstalk is solved by the chain parameter method with the cascade thought. When compared with the reference method based on MOM, it is shown that the method proposed in this paper has high reliability.
In the crosstalk results, NEXT is easily affected by high frequency signals, and NEXT and FEXT are less affected in the low frequency range. And as the complexity of twisting increases, the curves of NEXT and FEXT will gradually become similar. In the termination of different load impedances, the curves of NEXT and FEXT at about 106 Hz have opposite trends with impedance, which will cause the initial resonance frequency point to shift. With the increase and change of the termination impedance, a more obvious common resonance frequency point can be obtained. These influencing factors and results will have important reference significance in subsequent research and engineering applications.
ACKNOWLEDGMENT
This paper is supported by Science and Technology Project of State Grid Jiangsu Electric Power Co., Ltd. (J2022121).
REFERENCES
[1] C. Jullien, P. Besnier, M. Dunand, and I. Junqua, “Advanced modeling of crosstalk between an unshielded twisted pair cable and an unshielded wire above a ground plane,” IEEE Trans. Electromagn. Compat., vol. 55, no. 1, pp. 183-194, Feb. 2013.
[2] C. D. Taylor and J. P. Castillo, “On the response of a terminated twisted-wire cable excited by a plane-wave electromagnetic field,” IEEE Trans. Electromagn. Compat., vol. 22, no. 1, pp. 16-19, Feb. 1980.
[3] F. Grassi and S. A. Pignari, “Immunity to conducted noise of data transmission along dc power lines involving twisted-wire pairs above ground,” IEEE Trans. Electromagn. Compat., vol. 55, no. 1, pp. 195-207, Feb. 2013.
[4] A. Shoory, M. Rubinstein, A. Rubinstein, C. Romero, N. Mora, and F. Rachidi, “Application of the cascaded transmission line theory of Paul and McKnight to the evaluation of NEXT and FEXT in twisted wire pair bundles,” IEEE Trans. Electromagn. Compat., vo1.55, no. A, pp.648-656, Aug. 2013.
[5] G. Spadacini, F. Grassi, F. Marliani, and S. A. Pignari, “Transmission-line model for field-to-wire coupling in bundles of twisted-wire pairs above ground,” IEEE Trans. Electromagn. Compat., vol. 56, no. 6, pp. 1682-1690, Dec. 2014.
[6] R. Stolle, “Electromagnetic coupling of twisted pair cables,” IEEE J. Sel. Areas Comm., vol. 20, no. 5, pp. 883-892, Jun. 2002.
[7] G. Spadacini and S. A. Pignari, “Numerical assessment of radiated susceptibility of twisted-wire pairs with random nonuniform twisting,” IEEE Trans. Electromagn. Compat., vol. 55, no. 5, pp. 956-964, Oct. 2013.
[8] S. A. Pignari and G. Spadacini, “Plane-wave coupling to a twisted-wire pair above ground,” IEEE Trans. Electromagn. Compat., vol. 53, no. 2, pp. 508-523, May 2011.
[9] G. Spadacini and S. A. Pignari, “Radiated susceptibility of a twisted-wire pair illuminated by a random plane-wave spectrum,” IEICE Trans. Commun., vol. E93-B, no. 7, pp. 1781-1787, Jul. 2010.
[10] J. H. G. J. L. Rotgerink and J. Verpoorte, “Low-frequency closed-form expressions for crosstalk between twisted wire pairs,” 2016 ESA Workshop Aeros. EMC, pp. 1-6, 2016.
[11] X. Song, J. Wang, and B. Li, “Crosstalk model for shielded bundles of random twisted-wire pairs,” IEEE Asia-Pac. Int. Symp. Electromagn. Compat., Shenzhen, China, 2016.
[12] A. Tatematsu, F. Rachidi, and M. Rubinstein, “A technique for calculating voltages induced on twisted-wire pairs using the FDTD method,” IEEE Trans. Electromagn. Compat., vol. 59, no. 1, pp. 301-304, Feb. 2017.
[13] O. Gassab, S. Bouguerra, and L. Zhou, “Stochastic analysis of multitwisted cables with random parameters excited by random plane-wave fields,” IEEE Trans on Electromagn Compat., vol. 62, no. 5, pp. 2084-2095, Oct. 2020.
[14] Y. Yan, L. Meng, X. Liu, T. Jiang, J. Chen, and G. Zhang, “An FDTD method for the transient terminal response of twisted-wire pairs illuminated by an external electromagnetic field,” IEEE Trans. Electromagn. Compat., vol. 60, no. 2, pp. 435-443, Apr. 2018.
[15] S. Chabane, P. Besnier, and M. Klingler, “A modified enhanced transmission line theory applied to multiconductor transmission lines,” IEEE Trans. Electromagn. Compat., vol. 59, no. 2, pp. 518-528, Apr. 2017.
[16] S. Shiran, B. Reiser, and H. Cory, “A probabilistic model for the evaluation of coupling between transmission lines,” IEEE Trans. Electromagn. Compat., vol. 35, no. 3, pp. 387-393, Aug. 1993.
[17] D. Weiner and G. Capraro, “A statistical approach to EMI theory and experiment, part 2,” presented at the 1987 Zurich Symp. Electromagn. Compat., Zurich, Switzerland, 1987.
[18] S. Salio, F. Canavero, D. Lecointe, and W. Tabbara, “Crosstalk prediction on wire bundles by Kriging approach,” Proc. IEEE Int. Symp. Electromagn. Compat., vol. 1, pp. 197-202, Aug. 2000.
[19] S. Sun, G. Liu, J. L. Drewniak, and D. J. Pommerenke, “Hand-assembled cable bundle modeling for crosstalk and common-mode radiation prediction,” IEEE Trans. Electromagn. Compat., vol. 49, no. 3, pp. 708-718, Aug. 2007.
BIOGRAPHIES

Fubin Pang (1987), male, senior engineer, mainly engaged in electromagnetic environment simulation of power systems, relay protection of power system, electronic transformer test technology, etc.

Jianfei Ji received his Ph.D. degree in Engineering from Harbin Engineering University, entered the postdoctoral workstation of electrical engineering discipline of Jiangsu Electric Power Company and Southeast University in December 2012, and joined the State Grid Jiangsu Electric Power Co., Ltd. Research Institute in 2015.

Jiafei Ding graduated from Nanjing Normal University with a bachelor’s degree in 2019 and is currently studying for a master’s degree at Nanjing Normal University. His main research interests are signal integrity and electromagnetic compatibility of power systems.

Wu Zhang received the B.S degree in Electrical Engineering and Automation from Xi’an University of Technology, Xi’an, China, in 2020. He is currently working toward the master’s degree at Nanjing Normal University. His main research interests include multiconductor transmission lines and EMC.

Dong Xu received his bachelor’s degree in Engineering from the School of Electrical Engineering and Automation, Jiangsu University of Science and Technology in 2020. He is currently pursuing a master’s degree in electrical engineering at Nanjing Normal University. He is mainly engaged in EMC.

Mengxia Zhou obtained a PhD in Physics and Electronics and an M.S. in Electrical Engineering from Nanjing Normal University in 2021 and 2018. His main research interests include electromagnetic compatibility, electromagnetic environment effects and high frequency device modeling.
ACES JOURNAL, Vol. 38, No. 2, 80–90
doi: 10.13052/2023.ACES.J.380202
© 2023 River Publishers