Improved Mid-field Phased Array Calibration Method Based on Complex Interpolated Signals
Junhao Zheng, Zhengpeng Wang, Binhui Liu, Huaqiang Gao, and Xiaoming Chen
1School of Information and Communications Engineering
Xi’an Jiaotong University, Xi’an 710049, China
1071218679@stu.xjtu.edu.cn, huaqiang.gao@xjtu.edu.cn, iaoming.chen@mail.xjtu.edu.cn
2Electronic Information Engineering
Beihang University, Beijing 100191, China
wangzp@buaa.edu.cn
3The 5th Electronic Research Institute
Ministry of Industry and Information Technology, Guangzhou 511370, China
liubinhui@ceprei.biz
4Key Laboratory of MIIT for Intelligent Products Testing and Reliability
Submitted On: December 14, 2023; Accepted On: January 9, 2024
ABSTRACT
In this brief paper, an improved method of separate amplitude and phase interpolations is presented for the mid-field phased array calibration system. Since the amplitude is relatively continuous and the phase suffers from phase wrapping, the proposed method uses linear and phase-unwrapping natural neighbor interpolation methods to reconstruct the amplitude and phase matrices, respectively. When compared with the existing work, the proposed method is more accurate under the cost-effective over-the-air testing environment.
Index Terms: Complex signal, natural neighbor interpolation method, over-the-air test, phase wrapping, phased array calibration.
I. INTRODUCTION
Phased array systems can effectively control the excitation of array elements, meeting the requirements of specific communication systems for signal transmission and interference suppression [1]. However, the element branch will have characteristic variation causing the excitation signal loaded on the array element to deviate from expected values. Therefore, it is vital to calibrate the branches to improve the radiation performance of the phased array [2–4].
The array calibration is by default conducted with one element activated at a time (i.e. on-off mode). Since the coupling effect between array elements cannot be ignored, array calibration with all elements activated (i.e. all-on mode) would be adopted for good accuracy in this case [5, 6]. The all-on calibration methods can be classified as amplitude-only and complex measurements. In the amplitude-only measurement, the typical rotating element electric field vector (REV) method used phase variation to record the composite power of the array, and derived the relative amplitude and phase information from power changes [7]. The improved REV method in [8] characterized the array power response through a high-order Fourier series to identify the amplitude and phase errors of the elements, which was proved to have good practicability. However, the REV method for each element was time consuming, requiring a greater number of signal measurements than the complex calibration method.
For the complex calibration method, [9] used a transmission matrix to obtain the excitation coefficient under near-field measurement, which required good positioning accuracy and knowledge of the array configuration. However, [10] realized array calibration using a recursive matrix under far-field conditions, where the number of probe measurements is required to be equal to or greater than the number of elements in the array. Then, [11] enhanced testing efficiency by the matrix interpolation method and reduced the number of probe measurements. However, the phase interpolation was realized by the complex data interpolation, which could lead to phase wrapping between the adjacent points.
In this work, an improved interpolation and matrix reconstruction method is developed under the mid-field measurement (i.e., near-field w.r.t. the whole array yet far-field w.r.t. the array element). The number of probe moving positions under the all-on mode can be half the number of the array elements. Meanwhile, the branch matrix to be calibrated is obtained through the transmission matrix. The amplitude and phase of the branches are interpolated by linear interpolation and phase-unwrapping natural neighbor interpolation methods, respectively. Note that the proposed solution in this work is essentially an improvement of the method presented in [11].
II. THEORY
This section firstly presents the on-off mode used as the standard benchmark. Then the proposed all-on mode method is introduced and compared with the method in [11].
A. On-off mode
A phased array calibration system is shown in Fig. 1. The probe moves to multiple positions to gather sufficient samples and the signal model can be expressed as follows:
| (1) |
where is the S-parameter matrix measured by the probe using a vector network analyzer (VNA), is the weighted excitation signal matrix, and is the transmission matrix. If the numbers of weighted signals, probe positions and antenna elements are , and , then , and are , and matrices, respectively. The transmission matrix can be further expanded as:
| (2) |
where is a RF branch response matrix, is a array element radiation pattern matrix indicating the pattern of the n-th array element for the m-th probe position, is a free-space transfer function matrix, is a probe pattern matrix representing the pattern of the m-th probe position on the n-th array element and is the Hadamard product.
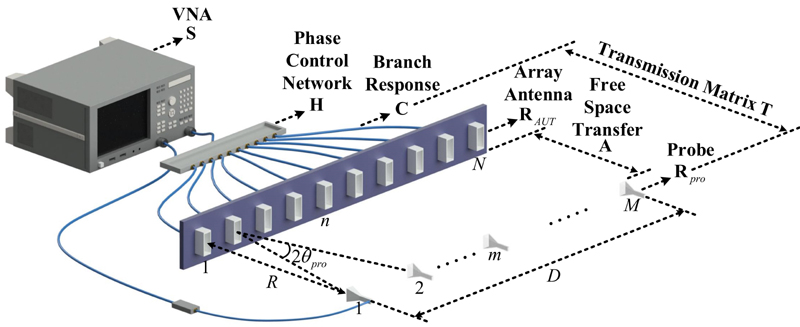
Figure 1: Configuration of the phased array calibration.
Since the matrix and are combined to form the signal branch matrix to be calibrated, the matrix element of can be written as:
| (3) |
where and are the row and column of the element in , and are the amplitude and phase of the RF branch response , and is the complex value of the array element in .
The calibration of the on-off mode applied to equations (1)-(3) can be seen as a standard benchmark to verify the effectiveness and accuracy of the proposed interpolation method under the all-on mode. The on-off mode is executed by enabling the n-th path and disabling the other signal branches. The probe vertically aligns to the face center of each array element forming a S-parameter matrix . Therefore, the excitation matrix turns to identity matrix , and the signal branch matrix to be calibrated can be derived as:
| (4) |
where represents entry-wise division of two matrices. The diagonal elements of the reconstructed matrix are the signal branches to be calibrated for the array elements (noted as a vector ), and the influence of the nonuniformity can be reduced by compensating the amplitude and phase deviation in .
B. All-on mode
After getting the comparison result under the on-off mode, we then introduce the proposed method using the all-on mode and interpolation method to calibrate the phased array.
In order to reduce the time cost, the number of probe moving positions should be smaller than the number of array elements, which is . The minimum probe number should cover the aperture of the phased array.
The probe scanning configuration is shown in Fig. 1, where the maximum probe moving distance is , the measurement range between the probe and array is , and the probe positions are evenly distributed in the range of . Thus, the angle sampling interval can be calculated as:
| (5) |
In order to better reconstruct and interpolate the small number of samples, an appropriate value of M is crucial. In this case, should be smaller than the half-power beamwidth (HPBW) of the array element. If is smaller than, the power received by the probe drops significantly, which incurs great errors in the reconstruction of the signal branch matrix . Consequently, is selected as the angle sampling interval to guarantee that the amplitude of the receiving power is large enough to reduce the signal branch error, and the minimum number of probe positions can be obtained as:
| (6) |
where represents the rounding up operator. It is obvious that the probe position number is proportional to , and inversely proportional to and . Then we set as a Hadamard matrix of order , ignoring the first columns (which can be seen as virtual elements), and the all-on mode excitation matrix can be obtained [11]. After using the Moore-Penrose pseudoinverse matrix of , the signal branch matrix to be calibrated can be expressed as:
| (7) |
where is a matrix. Next, should be interpolated to form a matrix to calibrate the signal branches.
The amplitude matrix of can be interpolated by the linear interpolation method to get the matrix , because the amplitude variation is relatively flat. However, since the phase matrix of suffers from a phase wrapping between adjacent points, the phase period should be added or subtracted to get the correct interpolation result, which can be understood as follows. If the phases of the two adjacent points are and , then the direct interpolation will yield , which is not correct. Thus, the latter phase should add to be , and the interpolated phase can be correctly obtained as .
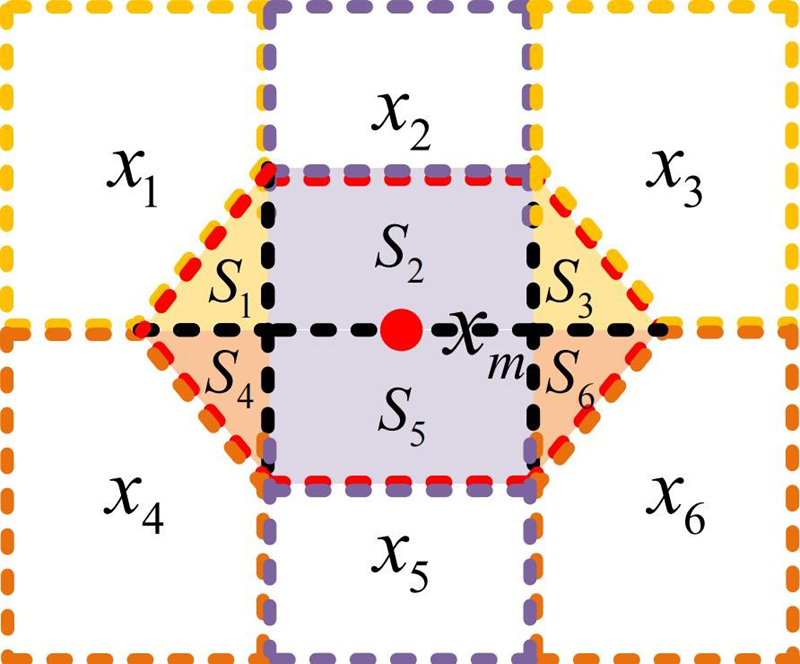
Figure 2: Phase-unwrapping natural neighbor interpolation method.
Then, the phase unwrapping is interpolated by the natural neighbor interpolation method, as shown in Fig. 2. The original data are marked as , the interpolated data is . The Voronoi cell before and after interpolating is calculated, where the cells of before the interpolation have common areas () with the hexagon Voronoi cell of , and the phase value of is calculated as:
| (8) |
where is the number of the adjacent cells of . Then, the desired interpolated phase matrix is obtained.
Subsequently, the diagonal elements are extracted from and to form the complex signal branches to be calibrated, noted as vector . Moreover, in order to make comparison with the proposed method, the calibration method in [11] is used here, whose interpolation results are obtained as . The basic mechanism of [11] also uses the interpolation method to reduce the initial sampling number, but the main difference between [11] and this work is that the reconstructed amplitude and phase matrix in [11] both used the linear interpolation method, which may lead to phase-wrapping errors for the interpolated complex results. Therefore, the proposed method can overcome the phase interpolation error and obtain more accurate signal branches. Finally, comparisons of , and can reveal the effectiveness of the proposed calibration method.
III. MEASUREMENT AND ANALYSIS
The proposed method is verified in the environment of Fig. 3. A column (with single vertical polarized waveguide antennas) of the planar array is selected as the AUT (antenna under test). The range is 1.124 m, the testing frequency is 2.6 GHz, and the probe is a WR284 waveguide antenna whose H-plane HPBW is . The distance is 1.0 m, which is the far-field range for the array element with dimension cm yet still in the near-field of the AUT array. The probe position , calculated by equation (6), should be larger than 5, and is chosen to probe the 14 array elements. The excitation matrix is set to be a Hadamard matrix of order .
Then, the reconstructed and are obtained by the proposed method, whose diagonal elements are extracted to form . The , used as a standard bench, is obtained by setting as identity matrix and as 14 to form . The calibrated results in [11] are acquired as a vector . The amplitudes and phases of , and are plotted in Figs. 4 (a) and (b) in red, green and blue circles,respectively.
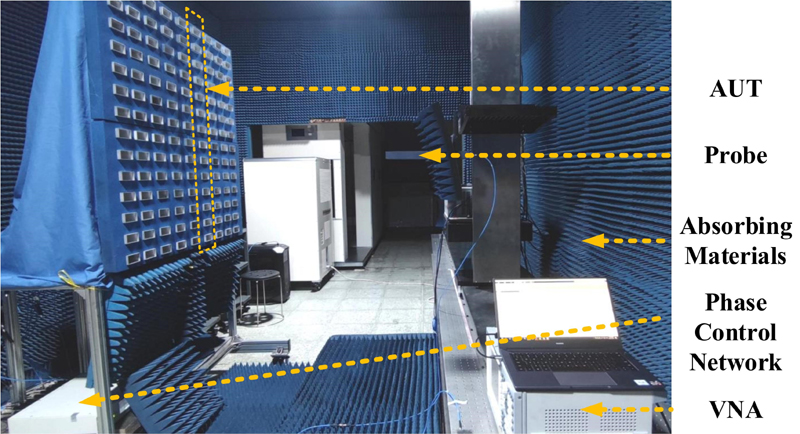
Figure 3: Measurement environment.
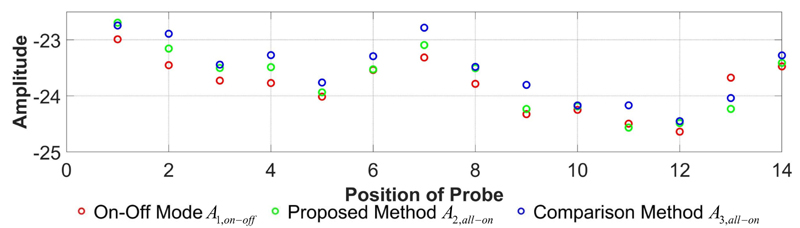
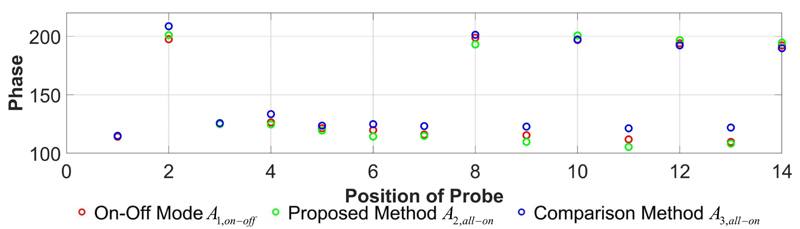
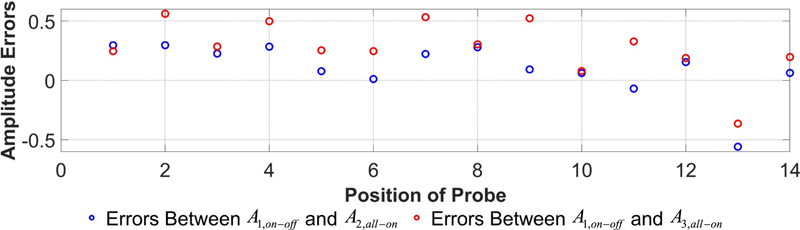
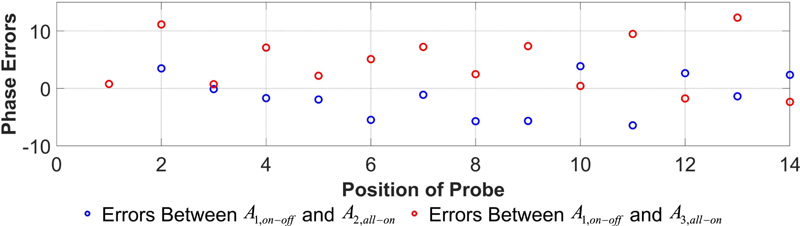
Figure 4: Comparisons of (a) amplitude, (b) phase, (c) amplitude errors, and (d) phase errors for the extracted elementary signal branches of , and .
Table 1: Performance comparison
| Characteristics | Calibration Type | Dynamic Range | Mean Value |
| [11] Method | Amplitude/ Phase |
0.92 dB | 0.33 dB |
| Proposed Method | Amplitude/ Phase |
0.85 dB | 0.19 dB |
Finally, the amplitude/phase errors between and , and those between and , are shown in Figs. 4 (c) and (d), respectively. To better illustrate the performance comparison between the proposed method and the method of [11], the dynamic ranges and mean values of the amplitude/phase errors are listed in Table 1. It can be seen that the dynamic ranges and mean values for the errors of the proposed method is smaller than that of the method in [11]. The differences between the two methods of the amplitude/phase errors for the dynamic ranges and mean values are calculated as 0.07 dB/ and 0.14 dB/, respectively, implying the superiority of the proposed method.
Thus, we can see from the results shown above that the element branches can be more accurately calibrated by the proposed interpolation method, and the separate interpolation method is more effective for complex signals with significant phase variation and phase wrapping influence.
IV. CONCLUSION
In this work, an improved interpolation method with a small number of probe positions (e.g. the half number of the array elements) is proposed for the phased array calibration. The proposed method used linear interpolation method and phase-unwrapping natural neighbor interpolation method to reconstruct the amplitude and phase matrices under the all-on mode, respectively. The proposed method has been proved to be more accurate than [11]. An error reduction of 0.07 dB/ is achieved for the dynamic range, and a reduction of 0.14 dB/ is achieved for the mean values.
ACKNOWLEDGMENT
This work was supported by Key Laboratory of MIIT for Intelligent Products Testing and Reliability 2023 Key Laboratory Open Project Fund (No. CEPREI2023-03) and CEPREI special fund (Grant 24Z10).
REFERENCES
[1] R. C. Hansen, Phased Array Antennas, 2 ed. Hoboken, NJ: Wiley, 2009.
[2] R. L. Haupt, “Active electronically scanned array technology,” in Timed Arrays: Wideband and Time Varying Antenna Arrays, Hoboken, NJ: Wiley, 2015.
[3] T. A. Milligan, “Phased arrays,” in Modern Antenna Design, 2nd ed. Hoboken, NJ: Wiley, 2005.
[4] R. Mailloux, Phased Array Antenna Handbook, 3rd ed. Norwood, MA: Artech House, 2017.
[5] X. Chen, S. Zhang, and Q. Li, “A review of mutual coupling in MIMO systems,” IEEE Access, vol. 6, pp. 24706-24719, 2018.
[6] H. Gao, W. Wang, Y. Wu, Y. Liu, G. F. Pedersen, and W. Fan, “Experimental comparison of on-off and all-on calibration modes for beam-steering performance of mm-wave phased array antenna-in-package,” IEEE Trans. Instrum. Means., vol. 70, pp. 1-9, 2021.
[7] S. Mano and T. Katagi, “A method for measuring amplitude and phase of each radiating element of a phased array antenna,” Electron. Commun. Jpn., vol. 65-B, no. 5, pp. 58-64, Jan. 1982.
[8] T. Takahashi, Y. Konishi, and I. Chiba, “A novel amplitude-only measurement method to determine element fields in phased arrays,” IEEE Trans. Antennas Propag., vol. 60, no. 7, pp. 3222-3230, July 2012.
[9] O. M. Bucci, M. D. Migliore, G. Panariello, and P. Sgambato, “Accurate diagnosis of conformal arrays from near-field data using the matrix method,” IEEE Trans. Antennas Propag., vol. 53, no. 3, pp. 1114-1120, Mar. 2005.
[10] R. Long, J. Ouyang, F. Yang, W. Han, and L. Zhou, “Multi-element phased array calibration method by solving linear equations,” IEEE Trans. Antennas Propag., vol. 65, no. 6, pp. 2931-2939, June 2017.
[11] Y. Zhang, Z. Wang, F. Zhang, X. Chen, J. Miao, and W. Fan, “Phased array calibration based on measured complex signals in a compact multiprobe setup,” IEEE Antennas Wireless Propag. Lett., vol. 21, no. 4, pp. 833-837, Apr. 2022.
BIOGRAPHIES

Junhao Zheng received the B.Sc. degree in electronic information science and technology from Shandong University, Weihai, China, in 2017, the M.Sc. degree in signal and information processing from Northwestern Polytechnical University, Xi’an, China, in 2020, and the Ph.D. degree in electronic science and technology from Xi’an Jiaotong University, Xi’an, China, in 2024. His current research interests include antenna measurement in an anechoic chamber and reverberation chamber and over-the-air (OTA) testing.

Zhengpeng Wang (Member, IEEE) was born in Shandong, China, in 1981. He received the B.Sc. degree in electronic science and technology from Shandong University, Jinan, China, in 2004, and the M.Sc. and Ph.D. degrees in electromagnetic field and microwave technology from Beihang University, Beijing, China, in 2007 and 2012, respectively. He was a Visiting Researcher with the Antenna and Applied Electromagnetic Laboratory, University of Birmingham, Birmingham, UK, from 2009 to 2010. From 2013 to 2015, he was a Research Fellow with the University of Kent, Canterbury, UK, and the University of Science and Technology Beijing, Beijing, China. He is currently an Associate Professor with Beihang University. His current research interests include over-the-air (OTA) tests, reconfigurable antennas, compact antenna test range feed antennas, and antenna measurement.

Binhui Liu received Ph.D. degree in Materials Physics and Chemistry from Sun Yat-Sen University, Guangzhou, China, in 2016. He worked as the technical director wireless communication laboratory in the Fifth Electronic Research Institute, Ministry of Industry and Information Technology, from 2016 till now. His research areas include wireless communication test technology for electronic products and vehicle communication network test technology.

Huaqiang Gao (Member, IEEE) received the B.E. degree in electronic and information engineering from Harbin University of Science and Technology, Harbin, China, in 2016, the B.A. degree in business English from Heilongjiang University, Harbin, in 2016, and the Ph.D. degree in electronic science and technology from Beijing University of Posts and Telecommunications (BUPT), Beijing, China, in 2022. Since 2019, he has been a Visiting Ph.D. Student and a Post-Doctoral Fellow with the Antennas, Propagation and Millimeter-Wave Systems Section, Aalborg University, Aalborg, Denmark. He is currently an Assistant Professor with the School of Information and Communications Engineering, Xi’an Jiaotong University, Xi’an, China. His research interests include over-the-air testing (OTA) of wireless devices, antenna measurement, and phased array calibration.

Xiaoming Chen (Senior Member, IEEE) received the B.Sc. degree in electrical engineering from Northwestern Polytechnical University, Xi’an, China, in 2006, and the M.Sc. and Ph.D. degrees in electrical engineering from the Chalmers University of Technology, Gothenburg, Sweden, in 2007 and 2012, respectively. From 2013 to 2014, he was a Post-Doctoral Researcher with the Chalmers University of Technology. From 2014 to 2017, he was with Qamcom Research and Technology AB, Gothenburg. Since 2017, he has been a Professor with Xi’an Jiaotong University, Xi’an. His research interests include MIMO antennas, over-the-air testing, reverberation chambers, and antenna measurements. He has published more than 200 journal articles on these topics. Prof. Chen received the IEEE Outstanding Associate Editor Awards six times from 2018 to 2023, and the International Union of Radio Science (URSI) Young Scientist Award 2017 and 2018. He was the General Chair of the IEEE International Conference on Electronic Information and Communication Technology (ICEICT) 2021. He currently serves as a Track Editor for IEEE Antennas and Wireless Propagation Lettersand an Associate Editor for IEEE Transactions on Antennas and Propagation.
ACES JOURNAL, Vol. 39, No. 10, 855–860
doi: 10.13052/2024.ACES.J.391002
© 2024 River Publishers