Correlations of Salivary and Blood Glucose Level Detection using Flexible Sensor Technique
Yusnita Rahayu, Fildza Arifa, Mudrik Alaydrus, Anhar, Teguh Praludi, Huriatul Masdar, and Syah Alam
1Department of Electrical Engineering
Faculty of Engineering, Universitas Riau, Pekanbaru 28290, Indonesia
yusnita.rahayu@lecturer.unri.ac.id, fildza@graduate.utm.my, anhar@lecturer.unri.ac.id
2Department of Electrical Engineering
Faculty of Engineering, Universitas Mercu Buana, Jakarta 11650, Indonesia
mudrikalaydrus@mercubuana.ac.id
3National Research and Innovation Agency
Indonesia
teguhpraludi@gmail.com
4Medical Faculty
Universitas Riau, Pekanbaru 28133, Indonesia
huriatul.masdar@gmail.com
5Department of Electrical Engineering
Universitas Trisakti, Jakarta Barat 11440, Indonesia
syah.alam@trisakti.ac.id
Submitted On: December 23, 2023; Accepted On: September 8, 2024
ABSTRACT
Indonesia had a total of 19.47 million individuals diagnosed with diabetes in 2021, the fifth position globally, as reported by the International Diabetes Federation (IDF). Diabetes requires periodic medical examinations, yet many individuals are hesitant to utilize invasive medical devices. The ring slot circular resonator (RSCR) inspired this sensor’s design. Non-invasive glucose measurement was done with flexible 2.45 GHz sensors. The reflection coefficient (S11) simulation result is -20.76 dB at 2.458 GHz and 894.8 MHz bandwidth. Saliva samples obtained from 20 individuals were subjected to 20 separate tests. Before collecting saliva samples, the volunteers’ blood sugar levels were assessed. Research indicates that the appropriate frequency range for average blood sugar levels (less than 125 mg/dl) is 1.55 GHz to 2.16 GHz, while diabetes patients with blood glucose levels (BGL) above 125 mg/dl had frequencies above 2.3 GHz. Test results show a positive correlation between glucose level and testing frequency. In addition to blood samples, saliva samples can serve as alternate specimens for assessing an individual’s BGL.
Index Terms: Blood glucose, flexible sensor, non-invasive, ring slot circular resonator, salivary.
I. INTRODUCTION
Elevated blood sugar (glucose) leads to diabetes. The International Diabetes Federation (IDF) estimates that one in 10 people globally suffers from diabetes. The IDF estimate has grown by 16%, or 74 million people, since 2019. The projected populations are 643 million in 2030 and 784 million in 2045. A total of 19.47 million Indonesians is expected to have diabetes in 2021, according to IDF forecasts [1]. Diabetes is an increase in blood sugar due to decreased insulin secretion by pancreatic beta cells and/or impaired insulin function [2].
Diabetics need to monitor and control their blood glucose levels (BGL) to keep their levels within normal ranges. To monitor blood sugar levels, a finger prick is used to extract blood, which is then placed on a blood strip. Some diabetics fear blood, so they avoid regular checkups [3]. This work was driven by the desire to eliminate the use of invasive blood sugar testing. Thus, the requirement for a non-invasive blood sugar monitor arises.
The diagnostic criteria for diabetes mellitus, as outlined in the guidelines, involve the measurement of fluctuating venous plasma glucose [4]. The diagnostic criteria for diabetes include the following thresholds: a plasma glucose value of 200 mg/dl (11.1 mmol/l) on an occasional basis, a fasting plasma glucose level of 126 mg/dl (7.0 mmol/l) after a fasting period of 8-12 hours, and a 2-hour value in venous plasma during an oral glucose tolerance test (OGTT) of 200 mg/dl (11.1 mmol/l).
According to scientific literature, fasting plasma glucose concentrations below 6 mmol/L (100 mg/dL) are considered within the normal range. Fasting plasma glucose concentrations ranging from 6.1 to 6.9 mmol/L (100-125 mg/dL) indicate impaired fasting glucose. Furthermore, fasting plasma glucose concentrations equal to or exceeding 7.0 mmol/L (126 mg/dL) are diagnostic criteria for diabetes [5].
RF transmission, breath analysis, fluorescence, interstitial fluid chemistry, and ocular spectroscopy are the most widely used non-invasive techniques [6]. A saliva nano-biosensor with a polyvinylidene fluoride (PVDF) membrane was used by Zhang et al. to monitor glucose non-invasively [7]. In 2019, Wang et al. also investigated antennas using commercial beverages and sweat samples on polyethylene terephthalate (PET) substrates [8]. A six-element dipole arm antenna was constructed by Bakkali et al. [9] to monitor glucose. Deshmukh and Chorage created microstrip antenna configurations as microwave sensors in 2020, including spiral, narrowband, and ultrawideband antennas. They quantified return loss by observing the antenna test frequency response for a specific BGL [10]. A 50 mg/dl glucose solution was used by Firdausi et al. to build a proximity couple-based microstrip antenna that operates at 50-60 GHz [11].
This study involved conducting extensive research on saliva testing with volunteers to ascertain its viability as an alternate sample for detecting an individual’s blood sugar levels. The disparity in sugar levels in saliva between those with diabetes and those without diabetes is the reason behind this. The sensor is composed of a circular resonator with a ring slot, which is printed on a flexible PET substrate. It operates within the frequency range 2.4-2.48 GHz, with the center of the ring slot as the sensing hotspot. This could be a promising solution to detect a person’s saliva sugar levels that correlate with blood sugar levels with high accuracy.
II. MATERIALS AND METHODS
A. Flexible sensor design
This research involves the construction of a flexible sensor that utilizes a PET substrate and a Coplanar Waveguide (CPW) feed mechanism. The PET substrate has a relative dielectric constant of 3, a dielectric loss tangent of 0.001, and a thickness of 0.13 mm [12]. The conductive film on the PET substrate uses silver nano ink. The PET substrate is chosen due to its ease of processing in various forms, such as molding and cutting. This facilitates the manufacturing of sensors according to the desired design and expected quantity. PET has a relatively stable dielectric constant at various frequencies and temperatures [13, 14]. The dielectric stability of PET contributes to the long-term performance of the sensor by minimizing the impact of temperature changes. This stability improves the sensitivity of the glucose sensor. Additionally, PET provides effective electrical isolation, reducing interference between the sensor elements and the surrounding structure. Table 1 presents the dimensions of the sensor that has been proposed. Figure 1 illustrates the geometry of the sensor with the measurement scenario.
Table 1: Dimensions of sensor design
| Dimension | Parameters (mm) |
|---|---|
| L (Substrate length) | 35 |
| W (Substrate width) | 40 |
| h (Substrate thickness) | 0.135 |
| WF (Feedline width) | 5.8 |
| LF (Feedline length) | 12 |
| WG (Ground width) | 2.3 |
| LG (Ground length) | 16.9 |
| R1 | 20 |
| R2 | 17 |
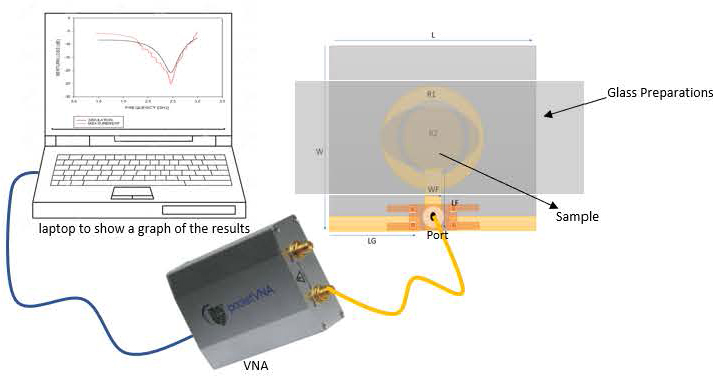
Figure 1: RSCR sensor and measurement scenario.
This sensor operates at a frequency of 2.45 GHz, in accordance with the Industrial Science and Medical (ISM) Band standard. It adheres to health standards and is specifically designed to detect glucose using non-invasive techniques.
The error value for measuring the sensor’s frequency is calculated using equation (1) as follows:
| (1) |
B. Research methods
This study involved 20 participants who had different blood sugar levels. The blood sugar levels were initially assessed using an intrusive medical tool called an easy-touch glucometer, which involved pricking the volunteer’s finger with a specialized needle to obtain a blood sample. The levels were categorized as low, normal, or high. A total of 20 tests were carried out on each volunteer using saliva samples for non-invasive sensor testing. To ensure accurate measurements, volunteers were instructed to fast for 8 hours before testing. After fasting for at least 8 hours, subjects were tested before eating for more reliable findings. This study was conducted in accordance with the principles of the Declaration of Helsinki, and all patients provided verbal informed consent prior to enrollment.

Figure 2: (a) Sensor measurement process for detecting glucose levels with saliva samples using a vector network analyzer and (b) process of injecting saliva sample on flexible sensor.
As in [15] the correlation between saliva glucose and blood glucose was found to be relatively high and stable before breakfast. In general, unstimulated parotid salivary glucose before breakfast presents an ideal saliva collection method to replace blood glucose used to detect diabetes mellitus, providing a reference for the prediction of diabetes mellitus. This study uses invasive medical devices to analyze saliva and blood test results.
Similar to previous research analysis, frequency was used to enable blood sugar sensor feasibility, with a particular focus on examining variations in testing frequency. Figure 2 shows the measurement procedure of the saliva glucose sensor. The testing technique utilizes needleless injection equipment, glass slides, sensors, a pocket Vector Network Analyzer (VNA), and a laptop.
The initial stage of examination involves placing an individual saliva specimen and positioning it close to the sensor on the slide. This is achieved by employing a needle-free injection of 1 mg/dl with a uniform sample volume for every measurement, positioning the sample directly on the object glass, which is situated above the sensor. In this work, the author employed a sensor equipped with a disposable glass preparation to ensure the safety of volunteers from potential biomolecular effects present in the saliva of participants. The glass preparation was used only once by each volunteer and subsequently discarded. After connecting the SMA connector and pocket VNA, the measurement signal can be directly checked on the laptop. The impact of saliva on a sensor with a PET substrate is mainly visible from the frequency shift caused by the spillage of saliva on the sensor.
III. RESULTS AND DISCUSSION
A. Sensor performance on saliva samples
Figure 3 shows the S-parameter of the flexible sensor, both measured and simulated. The CPW feeding line is connected to the sensor using a SMA connector. The simulation yielded an S11 value of -20.76 dB at a frequency of 2.458 GHz, with a bandwidth of 894.8 MHz, as shown by the black curve in Fig. 3. By contrast, the prototype sensor’s measurement yielded a red curve with an S11 value of -25.14 dB at a frequency of 2.462 GHz and 1200 MHz bandwidth. The measurements were conducted solely on the sensor, without any samples being used.
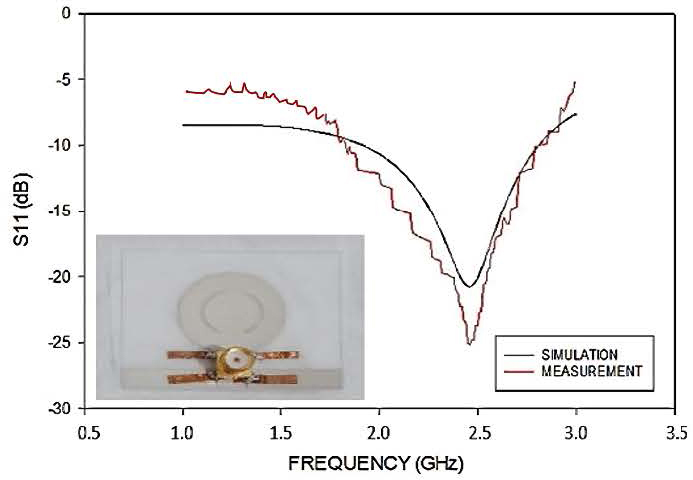
Figure 3: Measured and simulated S-parameters of the proposed flexible sensor.
According to the results of the conducted comparisons, there are discrepancies between the simulation results and the sensor measurements, which result in variations in the working frequency, S11, and bandwidth of the sensors. The frequency shift may result from a large reflection when measuring the sensors and loss from the connector port and the measuring apparatus. The error value for both results is 0.16% as calculated using equation (1).
To analyze and measure the electric field (E-field) of the proposed resonator, we conducted an E-field simulation at the resonant frequency of 2.45 GHz. This simulation was done for the circular resonator both before and after the ring slot was added. Figure 4 (a) presents the E-field of the circular resonator without a ring slot added. Figure 4 (b) shows the circular resonator with a ring slot added. The results clearly demonstrate that the ring slot yields the highest E-field intensity in the central area. However, the E-field of a circular resonator without a ring slot is located near the edge of the patch. Consequently, the region with the strongest E-field, which includes the ring slot, can serve as a precise location for detecting hotspots and placing the saliva sample. It should be noted that saliva placement on the hot spot area greatly affected the frequency shift, sensitivity, and performance of the sensor. The maximum E-field was observed at 13 kV/m.
Table 2 lists the experimental results using saliva samples from 20 volunteers. Studies have shown that the frequency range for blood sugar levels below 125 mg/dl is between 1.5 GHz and 2.16 GHz. Diabetic frequency occurs when blood sugar levels exceed 125 mg/dl and goes beyond 2.3 GHz. This demonstrates that the frequency of high blood sugar levels rises.
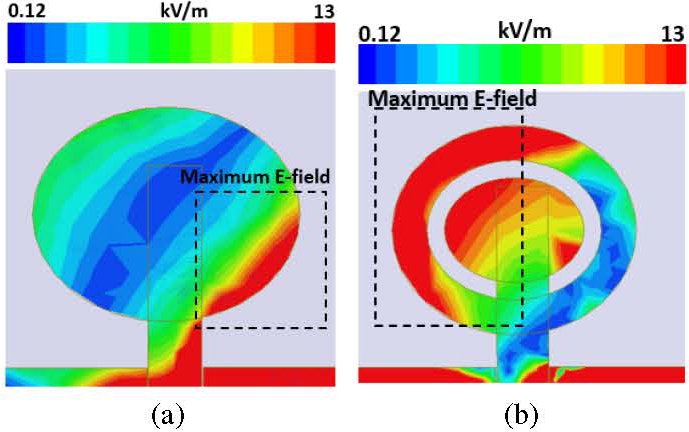
Figure 4: (a) E-field of the circular resonator and (b) E-field of the circular resonator with a ring slot added.
Table 2: Experiments using saliva samples on the RSCR sensor
| No. | BGL (mg/dl) |
Frequency (GHz) | S11 (dB) | Bandwidth (MHz) |
| 1 | 74 | 1.5588 | -19.98 | 84.05 |
| 2 | 78 | 1.6801 | -27.35 | 111.6 |
| 3 | 82 | 1.8316 | -22.39 | 75.4 |
| 4 | 83 | 1.8582 | -25.42 | 65.1 |
| 5 | 87 | 1.9274 | -19.82 | 64.9 |
| 6 | 88 | 1.9338 | -20.00 | 83.75 |
| 7 | 89 | 1.9903 | -19.56 | 66.1 |
| 8 | 90 | 2.0209 | -26.14 | 73.8 |
| 9 | 91 | 2.0314 | -19.71 | 54 |
| 10 | 92 | 2.0812 | -36.33 | 82.6 |
| 11 | 102 | 2.1109 | -26.54 | 68.8 |
| 12 | 105 | 2.1505 | -25.99 | 80.85 |
| 13 | 112 | 2.1615 | -24.62 | 87.7 |
| 14 | 145 | 2.3387 | -21.46 | 51.55 |
| 15 | 200 | 2.6022 | -18.01 | 52.65 |
| 16 | 202 | 2.6071 | -19.45 | 52 |
| 17 | 202 | 2.6075 | -19.34 | 87.8 |
| 18 | 215 | 2.6196 | -28.03 | 50.7 |
| 19 | 216 | 2.6318 | -27.66 | 53.2 |
| 20 | 230 | 2.7596 | -20.57 | 52.95 |
Fluctuations in BGLs can alter the permittivity of saliva, which is a bodily sample similar to blood. Consequently, the sensor exhibits high sensitivity to changes in permittivity. This is supported by Turgul’s research [16], which demonstrates that the frequency shift is more pronounced when liquid samples containing high concentrations of glucose are used. In addition, Jha’s research [17] demonstrated that higher concentrations of glucose led to an increase in frequency. Specifically, samples with 20% glucose levels had a frequency of 2.97 GHz, whereas samples with 30% glucose levels had a frequency of 3 GHz. This demonstrates that frequency moves towards higher values when the glucose level in a sample is high. This aligns with the research findings we acquired, as illustrated in Fig. 5.
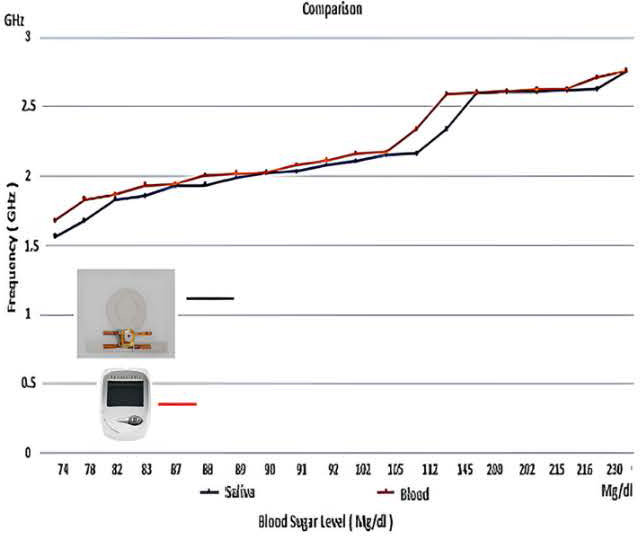
Figure 5: Saliva and blood samples correlation graph.
Figure 5 illustrates the relationship between sampling conducted using saliva and blood. Both samples underwent testing using the proposed RSCR sensor. The graph clearly demonstrates that both samples exhibit identical characteristics. The frequency of occurrence rises in direct correlation with the elevation of sugar levels. Furthermore, we conducted experiments utilizing various quantities of saliva through a needle without injection, as detailed in Table 3.
Table 3: Saliva experiments using different volumes of saliva
| No | mg/dl | 0.1 cc/ml | 0.2 cc/ml | 0.3 cc/ml | 0.4 cc/ml |
| 1 | 80 | 1.722 GHz | 1.716 GHz | 1.752 GHz | 1.754 GHz |
| 2 | 83 | 1.862 GHz | 1.878 GHz | 1.869 GHz | 1.859 GHz |
| 3 | 216 | 2.719 GHz | 2.7732 GHz | 2.7349 GHz | 2.756 GHz |
Table 4: Comparison of the results of previous studies
| Ref | Model | Resonance Frequency | Material Under Test | Sample Under Test | Measured Parameter |
| [7] | NA | NA | Flexible | Saliva | NA |
| [8] | NA | NA | Flexible | Sweat and sugary drinks | NA |
| [19] | NA | Flexible | Skin | S11 | |
| [20] | NA | Flexible | Sweat | S11 | |
| [21] | Multiple Complementary Split-Ring Resonator | 2.45 | Solid | Liquids | S21 |
| [17] | NA | 1-18 | Solid | Glucose liquid | S21 |
| [22] | Planar U-Shaped Resonator | 0.2875 | Solid | Ethanol | S11 |
| [16] | NA | Solid | Liquids | S11 | |
| [23] | NA | 2.45 | Flexible | Saliva | S11 |
| [24] | NA | 60 | Solid | Glucose liquid sample | S21 |
| [25] | NA | Solid | Glucose solution and blood samples | S21 | |
| [26] | NA | 7.5 | Flexible | Glucose solution | S21 |
| [27] | Cylindrical Biosensor | 2.4 | Flexible | Finger | S11 |
| [28] | Microstrip Ring Resonator | 0.0855 | Solid | Constration of glucose | S11 |
| This Work | Ring Slot Circular Resonator | 2.45 | Flexible | Saliva | S11 |
Table 3 presents the findings of experiments conducted on saliva samples with varying sample volumes. The experiments examined three different glucose levels: 80 mg/dl, 83 mg/dl, and 216 mg/dl. The results indicate that there was no notable variation in frequency when sample volumes ranged from 0.1 cc/ml to 0.4 cc/ml for these glucose levels. These findings show that a large volume of a sample does not have a significantinfluence.
Furthermore, as stated in [18], diabetics exhibited significantly elevated amounts of glucose in their saliva compared to the control group. A significant positive correlation was found between salivary glucose level (SGL) and BGL in diabetics as well as controls. SGL is directly influenced by glycemia and thus can be used to monitor BGL in diabetics. No positive correlation was found between SGL and HbA1c, nor was any correlation found between SGL, age, sex, and duration ofdisease.
Through the findings obtained, saliva can be used as a routine potential diagnostic tool in assessing diabetes mellitus. It is a simple and noninvasive technique for screening and monitoring this disease. Repeated painful finger pricks, the hazard of getting infections, complications in hemophiliac patients, and various other disadvantages that involve the blood tests currently used for diagnosis and monitoring of this widely prevalent diabetes mellitus disease, can be replaced by noninvasive tests involving saliva, which is also cost-effective. Therefore, this research focuses on salivasamples.
B. Comparison of past research results
In this paper, we introduce a flexible RSCR as a sensor for salivary glucose testing. The proposed sensor has a sensing hot spot at the center, allowing it to detect and respond to any sample placed on top of the sensing area, resulting in a significant frequency change. Table 4 shows a comparison between the proposed work and the existing sensors. Table 4 presents the novelty of the proposed sensor by the introduction of the flexible RSCR. Another novelty, the RSCR has independent characteristics, it is suitable for detecting glucose levels in saliva. Moreover, this study also presents the correlation between BGL and saliva by involving 20 volunteers with 20 times separated tests. Additionally, the study involved trials utilizing varying volumes of saliva. Based on the measurements, the frequency of saliva secretion increased in direct correlation with the rise in glucose levels.
Previously, sweat and skin samples have been utilized by researchers. In [19], the skin was subjected to frequencies ranging from 0.5 to 4 GHz. Similarly, [20] utilized PET material in conjunction with sweat samples for their research. The antenna was positioned on the skin by the researcher to unveil a frequency shift that exhibited a positive correlation with the concentration of glucose. This study utilized a skin adhesion method for data collection, but it did not include a comparison of the obtained results with established industry-standard instruments. Consequently, the correctness of the findings remains undetermined.
Authors [21] discovered that the frequency was 2.14 GHz at 10% glucose levels, 2.18 GHz at 30% ethanol, 2.24 GHz at 50%, 2.3 GHz at 70%, and 2.37 GHz at 90%. Therefore, a sample with a higher glucose concentration generates a larger frequency even with varied substrates. According to [17], the frequency of water was 2.89 GHz, 20% of glucose samples had a frequency of 2.97 GHz, 25% had a frequency of 2.99 GHz, and 30% had a frequency of 3 GHz. Two percent glucose in ethanol samples produced frequencies at S11 of 165 MHz, 170 MHz, 180 MHz, 190 MHz, 200 MHz, 220 MHz, 230 MHz, and 240 MHz, and 80% ethanol produced 240 MHz in the study [2]. This demonstrates that as liquid glucose levels rise, so does the test frequency. According to [17], the frequency was 3.52 GHz at 0 mg/dl and 3.55 GHz at 2000 mg/dl of glucose. This attests to the frequency increase in glucose levels. Table 4 provides a summary.
IV. CONCLUSION
In this paper, we have successfully developed a flexible ring slot circular resonator for salivary glucose detection. The proposed sensor operates at 2.45 GHz for unloaded frequency and shifts to 1.55 GHz for loaded frequency. In addition, the proposed device has independent characteristics with the center sensing area, so that it can be used for biological liquid sample measurements such as saliva and blood. From these measurements, the frequency range for blood sugar levels below 125 mg/dl is from 1.5 GHz to 2.16 GHz. Diabetic frequency arises when blood sugar levels surpass 125 mg/dl and exceed 2.3 GHz. The error of 0.16% was obtained for the S11 simulation and measurement results. This sensor can be recommended as an alternative solution for BGL detection. The findings indicate that the quantification of 20 saliva samples was successfully accomplished. In addition, throughout the testing process utilizing blood samples, the findings were mostly similar to those obtained from saliva samples. Furthermore, there was a noticeable shift towards higher frequencies when the blood sugar levels of the volunteers were elevated.
ACKNOWLEDGMENT
The Directorate General of Higher Education Ministry of Education and Culture, the Republic of Indonesia, financially supports this work under the fundamental research grant project 2022-2023. In addition, the authors would like to thank the Research and Community Service Agency (LPPM) Universitas Riau for research management and motivation.
REFERENCES
[1] IDF Diabetes Atlas 2021, IDF Atlas 10th Edition [Online]. Available: https://diabetesatlas.org/atlas/tenth-edition.
[2] R. N. Fatimah, ”Diabetes Mellitus type 2,” J. Majority, vol. 4, no. 5, pp. 93-101, 2015.
[3] L. Tang, S. J. Chang, C. J. Chen, and L. T. Liu, “Non-invasive blood glucose monitoring technology: A review,” Sensors, vol. 20, no. 23, p. 6925, 2020.
[4] A. Petersmann, D. Müller-Wieland, U. A. Müller, R. Landgraf, M. Nauck, G. Freckmann, and, E. Schleicher, “Definition, classification, and diagnosis of diabetes mellitus,” Experimental and Clinical Endocrinology & Diabetes, vol. 127, no. S 01, pp. S1-S7, 2019.
[5] V. Mohan, R. Deepa, and M. Rema, “Correlation between fasting plasma glucose and two-hour plasma glucose during oral glucose tolerance test in South Indians,” Metabolism, vol. 49, no. 4, pp. 455-457, 2000.
[6] S. J. Kim, S. J. Choi, J. S. Jang, H. J. Cho, and I. D. Kim, “Innovative nanosensor for disease diagnosis,” Acc. Chem. Res, vol. 50, no. 1, pp. 1587-1596, 2017.
[7] W. Zhang, Y. Du, and M. L. Wang, ”Non-invasive glucose monitoring using saliva nano-biosensor,” Sensing and Bio-Sensing Research, vol. 4, pp. 23-29, 2015.
[8] Y. Wang, X. Wang, W. Lu, Q. Yuan, Y. Zheng, and B. Yao, “A thin film polyethylene terephthalate (PET) electrochemical sensor for the detection of glucose in sweat,” Talanta, vol. 198, pp. 86-92, 2019.
[9] A. Bakkali, C. Buisson, L. Mounien, J. Landrier, V. Tishkova, and P. Sabouroux, ”First microwave tomography approach towards a truly non-invasive, pain-free, and wearable blood glucose monitoring device,” Progress in Electromagnetics Research M, vol. 102, pp. 193-206, 2021.
[10] V. V. Deshmukh and S. S. Chorage, “Microstrip antennas are used for the non-invasive determination of blood glucose levels,” in 2020 4th International Conference on Intelligent Computing and Control Systems (ICICCS), pp. 720-725, May 2020.
[11] A. Firdausi, G. P. Hakim, F. A. Kurniawan, D. Septiyana, and M. Alaydrus, “Development of a microstrip antenna for glucose detection at millimeter waves,” in 2019 IEEE Conference on Antenna Measurements & Applications (CAMA), pp. 181-183, Oct. 2019.
[12] T. Carlson and L. E. Asp, “Structural carbon fibre composite/PET capacitors-effects of dielectric separator thickness,” Composites Part B: Engineering, vol. 49, pp. 16-21, 2013.
[13] S. Chisca, I. Sava, V. E. Musteata, and M. Bruma, “Dielectric and conduction properties of polyimide films,” in CAS 2011 Proceedings (2011 International Semiconductor Conference), vol. 2, pp. 253-256, Oct. 2011.
[14] H. Li, Y. Zhou, Y. Liu, L. Li, Y. Liu, and Q. Wang, “Dielectric polymers for high-temperature capacitive energy storage,” Chemical Society Reviews, vol. 50, no. 11, pp. 6369-6400, 2021.
[15] Y. Cui, H. Zhang, J. Zhu, Z. Liao, S. Wang, and W. Liu, “Correlations of salivary and blood glucose levels among six saliva collection methods,” International Journal of Environmental Research and Public Health, vol. 19, no. 7, p. 4122, 2022.
[16] V. Turgul and I. Kale, “Permittivity extraction of glucose solutions through artificial neural networks and non-invasive microwave glucose sensing,” Sensors and Actuators A: Physical, vol. 277, pp. 65-72, 2018.
[17] A. K. Jha, Z. Akhter, N. Tiwari, K. M. Shafi, H. Samant, M. J. Akhtar, and M. Cifra, ”Broadband wireless sensing system for non-invasive testing of biological samples,” IEEE Journal on Emerging and Selected Topics in Circuits and Systems, vol. 8, no. 2, pp. 251-259, 2018.
[18] L. S. Vagish Kumar, “Salivary glucose levels and its correlation with serum glucose and glycemic status in diabetic patients,” Cukurova Med. J., vol. 39, pp. 7-18, 2014.
[19] J. Hanna, Y. Tawk, S. Azar, A. H. Ramadan, B. Dia, E. Shamieh, and A. A. Eid, “Wearable flexible body-matched electromagnetic sensors for personalized non-invasive glucose monitoring,” Scientific Reports, vol. 12, no. 1, p. 14885, 2022.
[20] Q. Xue, Z. Li, Q. Wang, W. Pan, Y. Chang, and X. Duan, “Nanostrip flexible microwave enzymatic biosensor for non-invasive epidermal glucose sensing,” Nanoscale Horizons, vol. 5, no. 6, pp. 934-943, 2020.
[21] A. Javed, A. Arif, M. Zubair, M. Q. Mehmood, and K. Riaz, “A low-cost multiple complementary split-ring resonator-based microwave sensor for contactless dielectric characterization of liquids,” IEEE Sensors Journal, vol. 20, no. 19, pp. 11326-11334, 2020.
[22] M. Karami, P. Rezaei, S. Kiani, and R. A. Sadeghzadeh, ”Modified planar sensor for measuring the dielectric constant of liquid materials,” Electronics Letters, vol. 53, no. 19, pp. 1300-1302, 2017.
[23] Y. Rahayu, F. Arifa, D. A. Kholik, H. Masdar, and T. Praludi, ”Design flexible microstrip antenna for non-invasive blood glucose detection,” in 2022 International Conference on Radar, Antenna, Microwave, Electronics, and Telecommunications (ICRAMET), pp. 179-182, Dec. 2022.
[24] S. Saha, H. Cano-Garcia, I. Sotiriou, O. Lipscombe, I. Gouzouasis, M. Koutsoupidou, and E. Kallos, “A glucose sensing system based on transmission measurements at millimeter waves using microstrip patch antennas,” Scientific Reports, vol. 7, no. 1, p. 6855, 2017.
[25] A. E. Omer, S. Safavi-Naeini, R. Hughson, and G. Shaker, “Blood glucose level monitoring using an FMCW millimeter-wave radar sensor,” Remote Sensing, vol. 12, no. 3, p. 385, 2020.
[26] T. Chretiennot, D. Dubuc, and K. Grenier, “Microwave-based microfluidic sensor for non-destructive and quantitative glucose monitoring in aqueous solution,” Sensors, vol. 16, no. 10, p. 1733, 2016.
[27] Y. Rahayu, W. N. Nugraha, T. Praludi, M. Alaydrus, and H. Masdar, “Experimental based blood glucose monitoring with a non-invasive cylindrical biosensor,” Progress in Electromagnetics Research M, p. 115, 2023.
[28] F. Jiang, S. Li, Y. Yu, Q. S. Cheng, and S. Koziel, “Sensitivity optimization of antenna for non-invasive blood glucose monitoring,” in 2017 International Applied Computational Electromagnetics Society Symposium (ACES), pp. 1-2, Aug. 2017.
BIOGRAPHIES

Yusnita Rahayu was born in Pekanbaru, Indonesia. She received a B.Eng. degree in Electrical Engineering from the Department of Electrical Engineering, National Institute of Science and Technology Jakarta 1999. She received her M.Eng. and Ph.D. degrees from Universiti Teknologi Malaysia in 2004 and 2009, respectively. She is currently a Senior Lecturer in the Department of Electrical Engineering at Universitas Riau and a Senior Member of IEEE. Her research interests include antennas and propagation, microwave and millimeter wave components, sensors, and wireless communication.
Fildza Arifa is a Master of Philosophy student in the Faculty of Electrical Engineering at Universiti Teknologi Malaysia. She earned a B.Eng. degree from the Universitas Riau in 2023. She is very interested in studying the field of antennas and propagation. She was a presenter at the international conference on radars, antennas, microwaves, electronics, and telecommunications (ICRAMET) with the research title ”Design Flexible Microstrip Antenna for Non-Invasive Blood Glucose Detection” on 7 December 2022 besides publishing a paper with the title ”A WDM Scheme to Analyze the Performance of Rof Systems by Giving Various Bits Rates” in the Journal of Informatics and Telecommunication Engineering, July 2023.

Mudrik Alaydrus was born in Jakarta, Indonesia. He received the Dipl.-Ing. and Dr.-Ing. degrees in Electrical Engineering from Universitaet Hannover and Universitaet Wuppertal in 1997 and 2001, respectively. Since 2003, he has worked at Universitas Mercu Buana, Jakarta. Dr. Alaydrus is a Senior Member of IEEE and a member of Verein der Deutschen Elektroingenieure (VDE). His current research includes microwave and millimeter wave components, wireless power transfers, wireless sensor networks, interaction between electromagnetics and materials, and mathematical modeling in signal processing.

Anhar has been a lecturer at the University of Riau since 2002. He took his Ph.D. at Brunel University London, UK, and finished in 2019. Currently, he is a senior lecturer and has been teaching many subjects such as data communication, traffic engineering, wireless sensor networks, electrical measurement, and signals and systems. In terms of research, he has been supervising many students and publishing many articles related to the performance analysis of sensor networks. He is also interested in investigating the performance of medium access control (MAC) and routing protocols in sensor networks, the Internet of Things (IoT), and Wi-Fi.

Teguh Praludi has been a researcher at the telecommunications research center of the National Research and Innovation Agency since 2003. He completed his master’s program at Bandung Institute of Technology in 2013, study program of Radar. He currently researches telecommunications, especially radio frequency modules such as filters and antennas. He is currently a member of the Indonesian Engineers Association (PPI). Various research results have been published in journals and conference proceedings.
Huriatul Masdar was born in Limapuluh Kota, West Sumatra, Indonesia, in 1979. She received her S.Ked. and Dr. degrees from the Faculty of Medicine, Universitas Andalas, in 2004, and her M.Sc. degree in biomedical sciences from Vrije Universiteit, Amsterdam, in 2009. She is currently a senior lecturer and researcher at the Faculty of Medicine, Universitas Riau (UR). In addition, she conducts various research projects through national grants. Her research interests included histology and immunology. She has published five articles and attended four national and internationalsymposia.

Syah Alam was born in Jakarta, Indonesia. He received a Bachelor Education of Engineering (S.Pd.) degree in electrical engineering from Universitas Pendidikan Indonesia (UPI) and an M.Eng. (M.T.) degree in telecommunication engineering from the Graduate Program of Electrical Engineering, Universitas Trisakti, in 2010 and 2012, respectively. In 2018, he joined the Department of Electrical Engineering Universitas Trisakti as a researcher and lecturer. From 2021, he is pursuing his Ph.D. at Universiti Teknikal Melaka Malaysia (UTeM) in the field of electronic engineering (RF and microwave). His research interests include microstrip antennae and microwave sensors for various applications.
ACES JOURNAL, Vol. 39, No. 7, 623–631
doi: 10.13052/2024.ACES.J.390706
© 2024 River Publishers