Contribution of Mobile Communication Technologies to EMF Exposure in the University of Novi Sad Campus Area
Dragan R. Kljajić, Nikola M. Djuric, Karolina K. Kasas-Lazetic, Miodrag M. Milutinov, and Snezana M. Djuric
1Faculty of Technical Sciences
University of Novi Sad, Novi Sad 21000, Serbia
dkljajic@uns.ac.rs, ndjuric@uns.ac.rs, kkasas@uns.ac.rs, miodragm@uns.ac.rs
2Institute BioSens
University of Novi Sad, Novi Sad 21000, Serbia
snesko@uns.ac.rs
Submitted On: January 23, 2024; Accepted On: September 3, 2024
ABSTRACT
Densely populated areas are usually extensively exposed to the emission of electromagnetic fields (EMFs) that is primarily caused due to extensive use of wireless telecommunication technologies, particularly those providing mobile phone communication services. Consequently, observation and control of EMF levels in human surroundings have great importance in terms of human health and environmental protection. Particular efforts have to be devoted to EMF investigation in highly sensitive areas, where people can stay for quite long periods, such as university campuses. This paper brings the results of 2023 EMF monitoring campaign, performed over the University of Novi Sad campus for the third time, comparing them with EMF results obtained in previous 2012 and 2018 campaigns. Having in mind the emergence of new 4G Long Term Evolution (LTE) base stations in the campus, during 2022, a special focus of the 2023 campaign was on the inevitable increase of field levels, because of the contribution of 2G/3G/4G mobile communication technologies to human EMF exposure. Despite the expected increase of the field levels, obtained values were still significantly lower than the minimal reference levels, prescribed by the Serbian legislation.
Index Terms: broadband measurement, continuous monitoring, EMF, exposure assessment.
I. INTRODUCTION
Exposure to electromagnetic field (EMF) radiation has become one of the major environmental concerns, considering continuous increase of a number of artificial EMF sources in surroundings. Among them, base stations (BSs) of new generations of mobile phone communication technologies are the most pronounced. Consequently, the investigation of EMF, thorough the long-term monitoring and control of its levels in the environment, is of a great importance.
In line with that, particular efforts have to be paid to EMF level measurements, as well as corresponding exposure assessment of population, in highly sensitive zones with long-term stay of people, as suggested by the World Health Organization [1]. University campuses are certainly highly sensitive areas, having in mind the high concentration of people in them, almost every day. Therefore, some scientific studies have been devoted to EMF investigation in those areas, performing short- and long-term stationary measurements in broadband or band selective frequency ranges [2–7].
Regarding the University of Novi Sad campus area, in the Republic of Serbia, the first broadband EMF monitoring campaign was conducted in 2012 [8], where 4-hour monitoring of the high-frequency electric field (E-field) was performed at 10 most crowded locations in the campus. Narda NBM-550 instrument with broadband E-field probe EF 0691 was used, covering a frequency range from 100 kHz to 6 GHz [9, 10]. The second monitoring campaign was carried out in 2018 [11], at the same locations and with usage of additional instruments (Wavecontrol SMP2) and its WPT broadband E-field probe designed to cover frequency ranges of 2G/3G/4G mobile communications services – from 700 to 2600 MHz [12, 13]. The 2023 campaign included also a third measuring instrument, the Narda SRM 3006 spectrum analyzer, to perform frequency selective scanning of EMF content, in the frequency range from 420 MHz to 6 GHz [14].
This paper brings comparative presentation of the three EMF campaigns and discusses the results acquired so far. Particular attention is devoted to the analysis of the contribution of mobile communication technologies to EMF exposure in the campus, considering their dominant presence in this area.
II. MATERIALS AND METHODS
Detailed information about the measuring procedure applied in the first two EMF monitoring campaigns, as well as descriptions of the selected locations in the campus, are given in [8, 11]. The same measuring procedures were applied in the 2023 campaign, at the same locations, as listed in Table 1 and marked with yellow triangles in Fig. 1.
Table 1: Campus locations for EMF monitoring
| Location | Description |
|---|---|
| Location 1 | in front of the Rectorate building |
| Location 2 | in front of the Faculty of Agriculture |
| Location 3 | the square surrounded by three Faculty buildings |
| Location 4 | entrance into the campus |
| Location 5 | in front of Students’ Cultural Center (former student cafeteria) |
| Location 6 | in the vicinity of Novi Sad Business School and Student Sports Centre |
| Location 7 | at the most frequented traffic crossroad |
| Location 8 | between two students’ dormitories |
| Location 9 | in front of the entrance of a main student cafeteria |
| Location 10 | the square in front of the Faculty of Technical Sciences |
Regarding the measuring equipment used in monitoring campaigns, a list of instruments is provided in Table 2.
Table 2: Measuring equipment used in campaigns
| Campaign | Measuring Equipment | ||
|---|---|---|---|
| NBM-550 | SMP2 | SRM 3006 | |
| 2012 | Yes | No | No |
| 2018 | Yes | Yes | No |
| 2023 | Yes | Yes | Yes |
Broadband field meters NBM-550 and SMP2 were used for 4-hour continuous EMF monitoring of E-field strength. Technical parameters of the field probes are shown in Tables 3 and 4.
Table 3: Broadband electric field probe EF 0691 [10]
| Parameter | Value |
|---|---|
| Frequency range | 100 kHz to 6 GHz |
| Measurement range | 0.35 V/m to 650 V/m |
| Linearity | 0.5 dB (2 to 400 V/m) |
| Frequency sensitivity | 1.5 dB (1 MHz to 4 GHz) |
It should be highlighted that the WPT field probe performs broadband EMF monitoring, acquiring the EMF contribution from four frequency ranges dedicated for 2G/3G/4G mobile phone services, as given in Table 4.
Table 4: Mobile phone services’ field probe WPT [13]
| Parameter | Value |
|---|---|
| Frequency ranges | 700 MHz to 900 MHz 1800 MHz to 1900 MHz 2100 MHz and 2600 MHz |
| Measurement range | 0.04 V/m to 65 V/m |
| Linearity | 0.4 dB (0.2 to 50 V/m) |
| Frequency response | 3.3 dB |
In the last campaign, a SRM 3006 spectrum analyzer was also applied, for short measurements, i.e. a few minutes long spectrum’s content scanning. The basic settings of this instrument are listed in Table 5.
Table 5: SRM 3006 spectrum analyzer settings [14]
| Parameter | Settings Value |
|---|---|
| Frequency ranges | 420 MHz to 6 GHz |
| Resolution bandwidth (RBW) | 500 kHz |
| Video bandwidth (VBW) | 5 kHz |
| Averaging method | Time |
| Averaging time | 60 s |
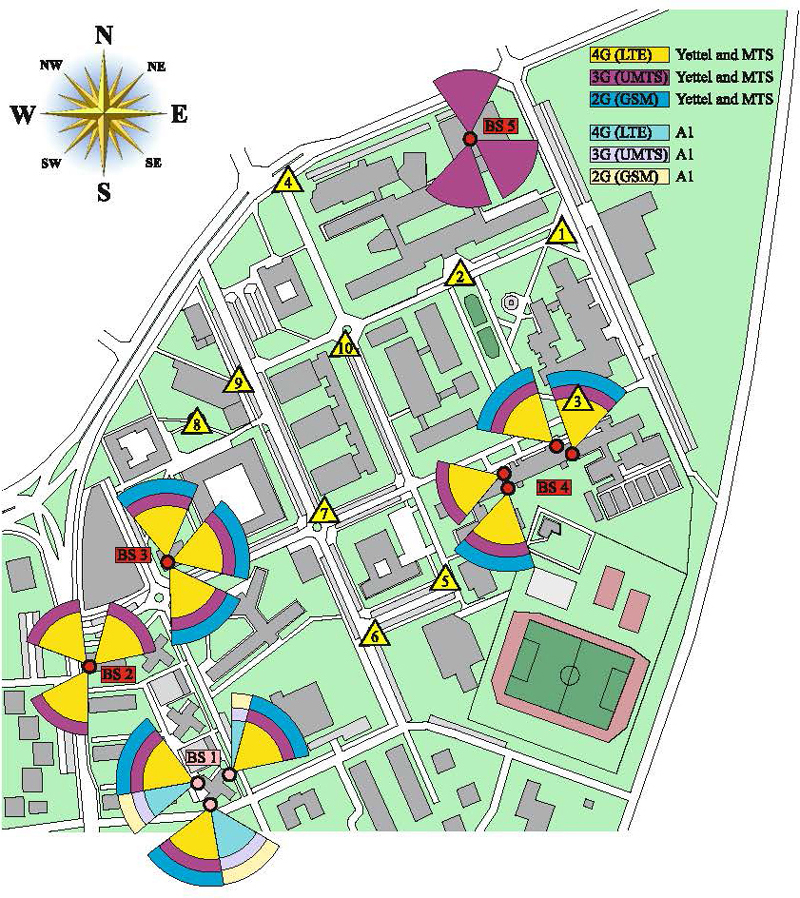
Figure 1: Positions of BSs and monitoring locations in the University of Novi Sad campus.
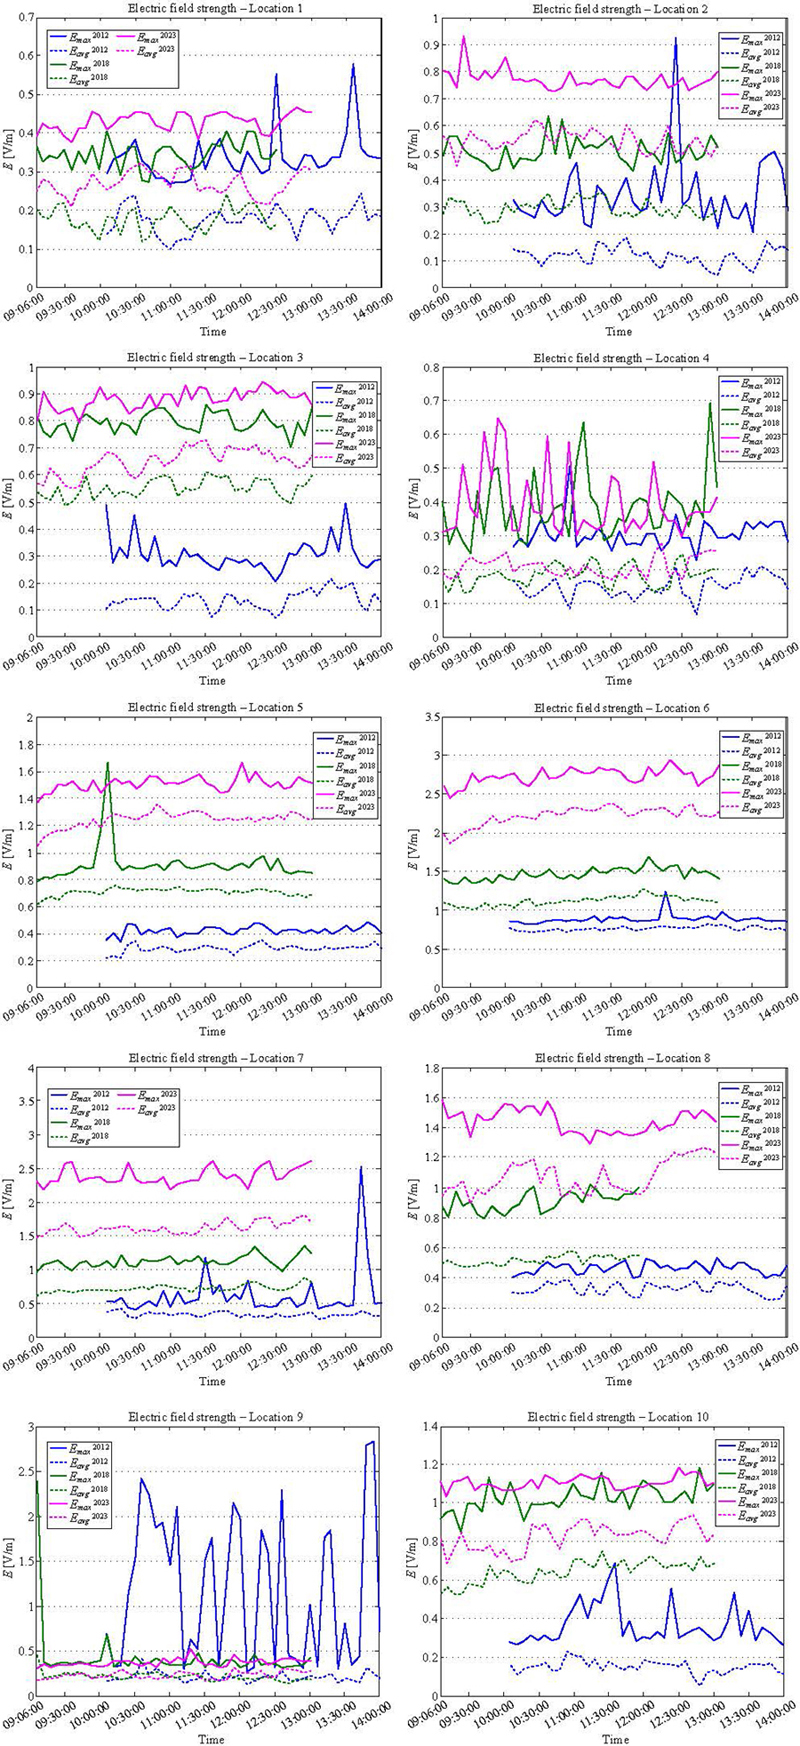
Figure 2: E-field strength values – Narda NBM-550 [11].
Besides significant daily frequency of student population and university staff in the campus, this area is additionally interesting for EMF investigation due to periodic installation of new BSs, visually noticeable in this area. With the introduction of new generations of mobile communication, the number of BSs and their antennas in the campus has been increased in the last decade. Thus, they have become dominant EMF sources not only in this area, but also in its urban surrounding.
Currently, five BSs are present and operational in the campus, owned by three national operators (A1, Yettel and MTS). These BSs and their sector antennas are marked with red and pink circles in Fig. 1. Technical parameters of these antennas will be omitted here, but their radiation patterns are depicted in Fig. 1 by different colors per communication services.
It should be mentioned that only BS 1 and BS 3 were present in the campus in the 2012 campaign [8]. In that time, they were providing only GSM/2G service, while today they provide GSM/2G, UMTS/3G and LTE/4G services.
The next BS in the campus appeared during 2017 (a four-sector BS 4), whose antennas serve to cover the surrounding area with a signal of all existing services [11]. Finally, two additional BSs have been installed in the campus area, BS 2 (UMTS and LTE services) and BS 5 (only UMTS service), before the 2023 campaign.
III. RESULTS AND DISCUSSION
Measurement results acquired in the three EMF campaigns, by three types of measuring instruments, will be compared and discussed in the following subsections.
A. NBM-550 field meter
A graphical comparative presentation of the average, E, and maximum, E, field strength values, obtained in all campaigns by the Narda NBM-550 field meter is given in Fig. 2.
Considering these graphs, a slight or significant increase of the E-field strength values, from campaign to campaign, is noticed at nine of the 10 locations (except Location 9). These conclusions are practically in line with those drawn in the previous paper [11].
The field strength values at Location 9 in 2023 remained very similar to those in 2018, while it was noticed their significant decrease in comparison with 2012 results. As stated in [11], those differences and observed short-term peaks of E values are primarily caused by the increased usage of mobile communication technologies (cell phones calls and internet connections) at that location.
Finally, the most pronounced increase and the highest E-field strength values (maximum of 2.946 V/m) were achieved at Location 6. A comparison of maximum values of E, obtained by the Narda NBM-550 field meter, is provided in Table 6.
Table 6: Maximum values of E (V/m) NBM-550 [11]
| Location | Campaign | ||
|---|---|---|---|
| 2012 | 2018 | 2023 | |
| 1 | 0.580 | 0.406 | 0.467 |
| 2 | 0.926 | 0.637 | 0.932 |
| 3 | 0.496 | 0.862 | 0.945 |
| 4 | 0.507 | 0.694 | 0.647 |
| 5 | 0.489 | 1.664 | 1.667 |
| 6 | 1.248 | 1.695 | 2.946 |
| 7 | 2.529 | 1.355 | 2.615 |
| 8 | 0.529 | 1.020 | 1.589 |
| 9 | 2.834 | 2.389 | 0.522 |
| 10 | 0.684 | 1.181 | 1.186 |
Considering data from Table 6, it is evident that all field strength values obtained in three campaigns were several times lower than the minimal reference level, prescribed by the Serbian legislation (E = 11 V/m for frequency range 100 kHz to 6 GHz) [15].
In all campaigns, the exposure assessment was performed using the proposed boundary approach, where upper and lower boundaries of the Global Exposure Ratio (GER) [16] are evaluated. Those boundaries determine the range where actual exposure exists, while they are calculated by the following equations:
| (1) |
where E denotes measured value of the E-field, while E and E are the minimum and maximum reference levels, prescribed by the Serbian legislation [15], in monitored broadband frequency range.
GER boundaries were calculated taking the average field strength values, E, as E in equation (1), acquired by the Narda NBM-550 meter. Their comparison by campaigns is shown in Fig. 3.
Results presented in Fig. 3 confirmed conclusions about the increase of exposure at nine of 10 locations, with a slight decrease at Location 9 only. Statistical analysis of maximum values of upper boundary, GER, a much more important exposure boundary, calculated with E results from the Narda NBM-550 is given in Table 7, offering their comparison by campaign.
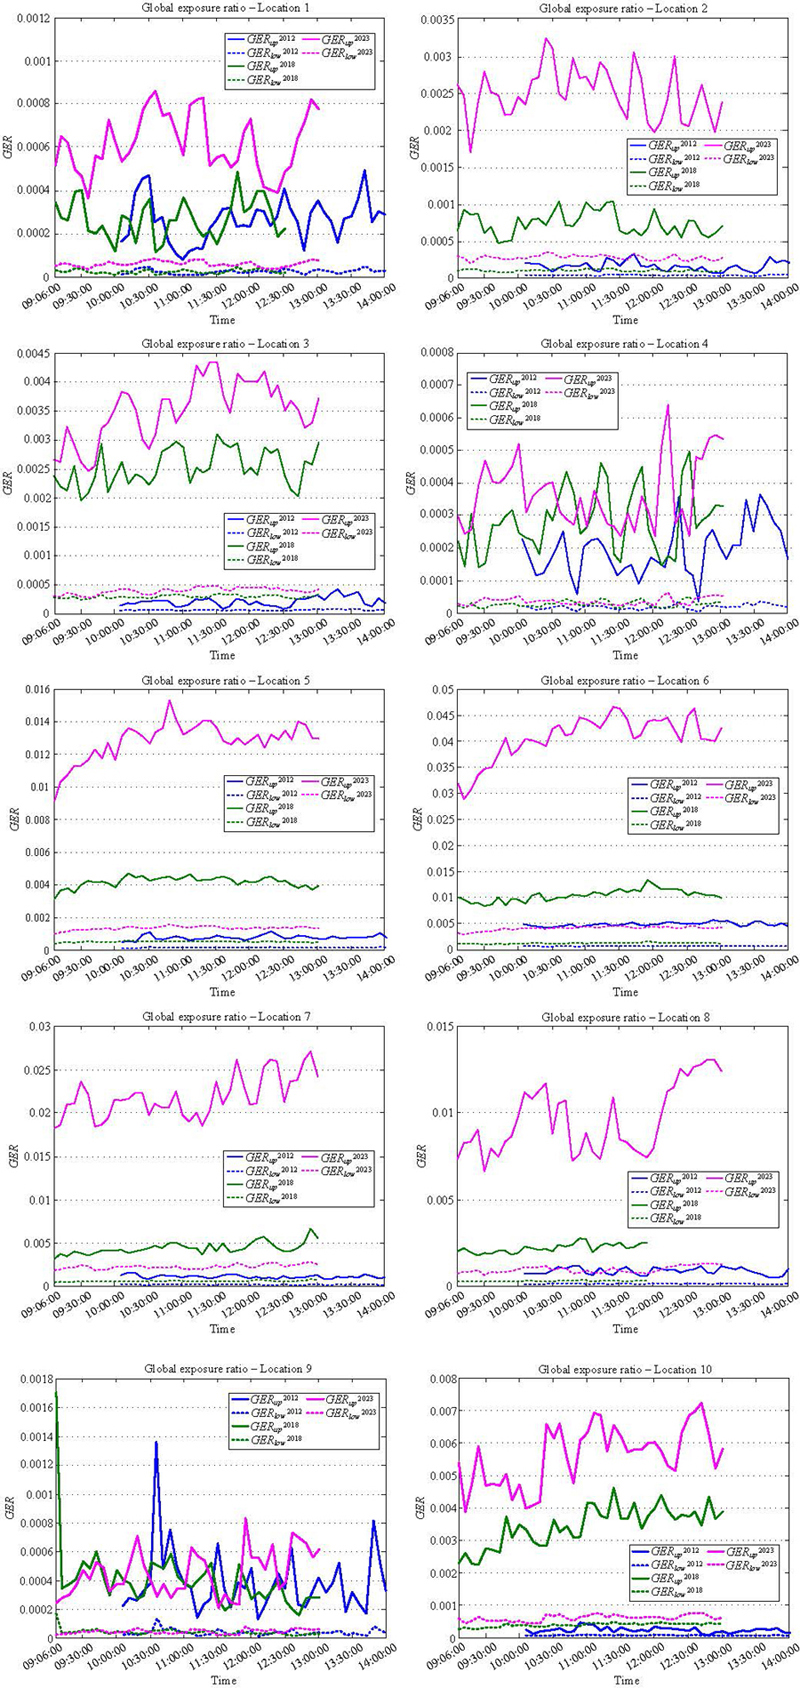
Figure 3: The exposure boundaries – Narda NBM-550 [11].
The highest value of GER boundary, achieved at Location 6 in the 2023 campaign, was about 21 times lower than the maximal allowable exposure level GER 1.
All other values were several hundred or thousand times lower than the maximal allowable exposure level, suggesting that, from campaign to campaign, the campus area remained low EMF exposed.
Table 7: Maximum values of GER NBM-550 [11]
| Location | Campaign | ||
|---|---|---|---|
| 2012 | 2018 | 2023 | |
| 1 | 0.4910 | 0.4910 | 0.8610 |
| 2 | 0.2910 | 1.0310 | 3.2110 |
| 3 | 0.3810 | 3.1010 | 4.3510 |
| 4 | 0.3610 | 0.4910 | 0.6410 |
| 5 | 1.0410 | 4.7210 | 15.310 |
| 6 | 5.5610 | 13.410 | 46.510 |
| 7 | 1.4710 | 6.6110 | 27.110 |
| 8 | 1.1810 | 2.7410 | 13.110 |
| 9 | 1.3510 | 1.7010 | 0.8310 |
| 10 | 0.4310 | 4.6210 | 7.2310 |
B. SMP2 field meter
As regards measurements conducted by the Wavecontrol SMP2 field meter, this paper brings the first comparison of the results obtained by this instrument, since it was used for the first time in the 2018 campaign. The average, E, and instant, E, field strength values, obtained in the 2018 and 2023 campaigns, are graphically presented and compared in Fig. 4.
A graphical comparison revealed an increase of field strength values at nine of 10 locations. That increase was the highest at Location 6 and the lowest at Location 9, while Location 10 was the only one with a decrease of field strength values compared with the 2018 campaign. That location is at one of the central squares in the campus, surrounded by several high buildings and far distanced from all five BSs. These could be the reasons for the achieved slight decrease of field strength values from mobile phone services at that location.
A comparative overview of maximum values of E, obtained in both campaigns by the Wavecontrol SMP2 field meter, is provided in Table 8.
Table 8: Maximum values of E (V/m) SMP2 [11]
| Location | Campaign | |
|---|---|---|
| 2018 | 2023 | |
| 1 | 0.194 | 0.257 |
| 2 | 0.452 | 0.571 |
| 3 | 0.402 | 0.595 |
| 4 | 0.187 | 0.291 |
| 5 | 0.647 | 0.820 |
| 6 | 1.086 | 1.939 |
| 7 | 1.233 | 1.408 |
| 8 | 0.626 | 0.883 |
| 9 | 0.250 | 0.250 |
| 10 | 1.409 | 1.135 |
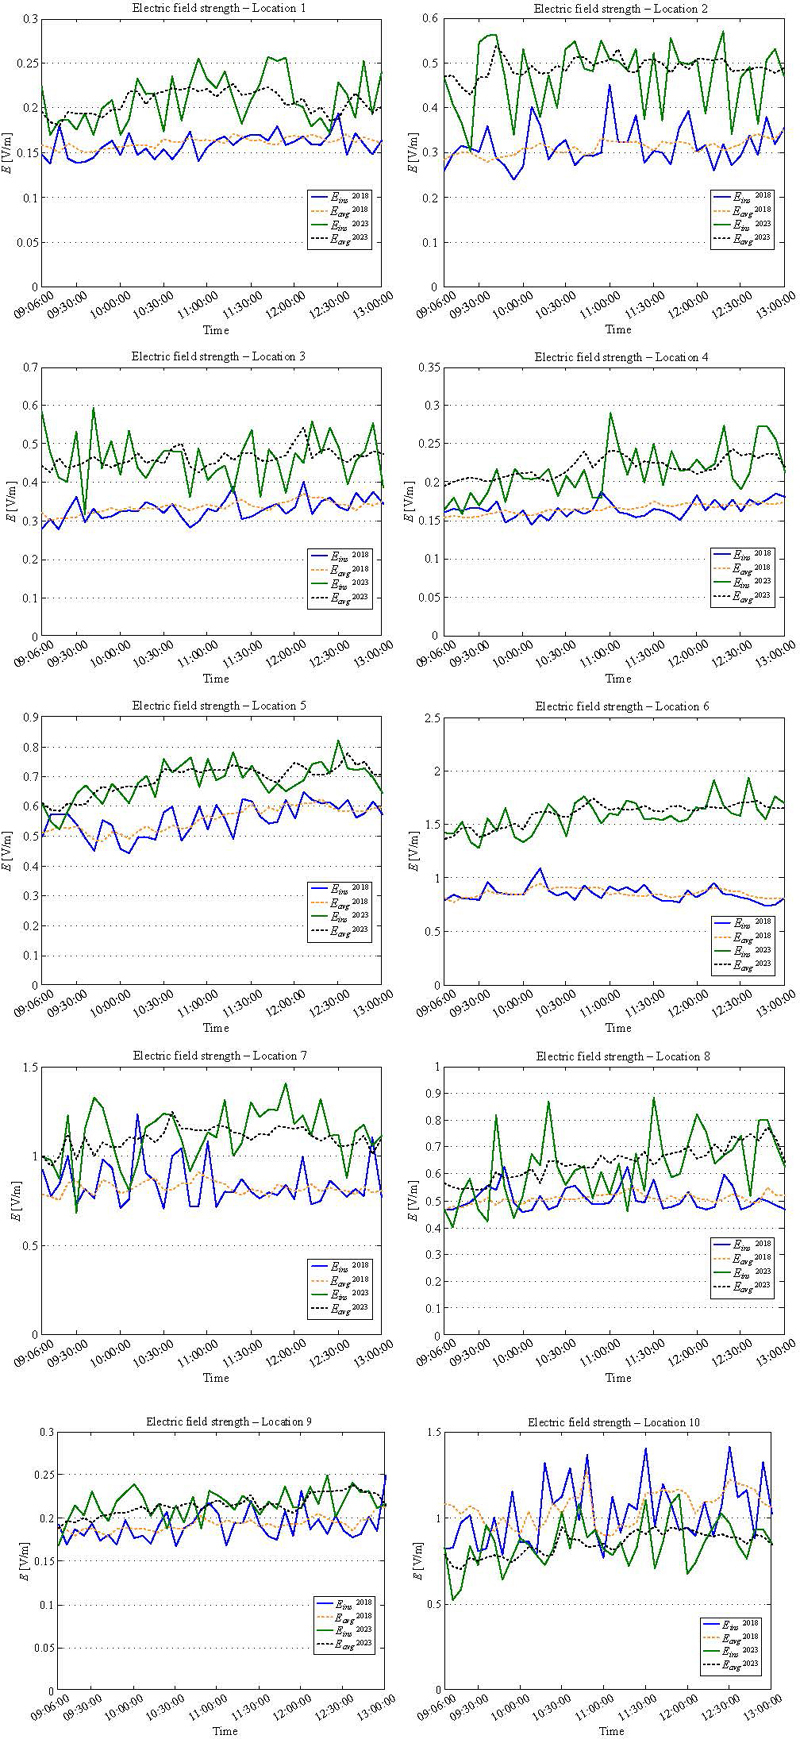
Figure 4: E-field strength values – Wavecontrol SMP2 [11].
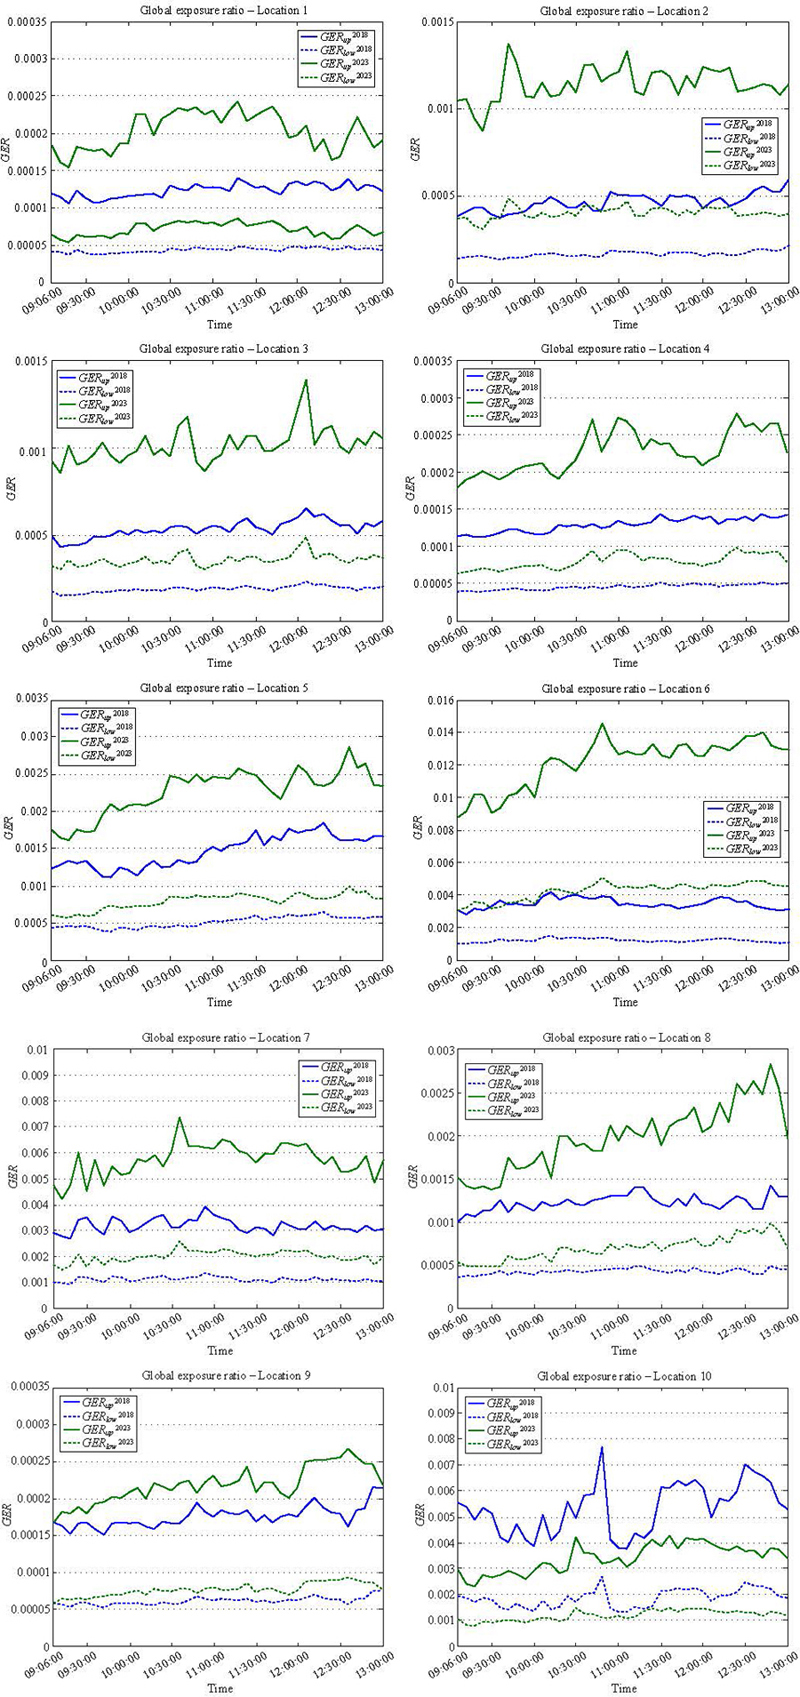
Figure 5: The exposure boundaries – Wavecontrol SMP2 [11].
The highest field strength value of 1.939 V/m was achieved at Location 6 in 2023. However, that value, as well all others obtained in both campaigns, were about 10 or more times lower than the minimal reference level, prescribed by Serbian legislation for the frequency range from 700 MHz to 2600 MHz (E 14.5 V/m) [15].
Graphical presentation of the exposure boundaries, calculated using the average field strength values, E, of the Wavecontrol SMP2 field meter as E in equation (1), is given in Fig. 5.
Results presented in Fig. 5 additionally showed the tendency of an increase of exposure to mobile communication technologies in the campus in the past years. A comparison of maximum values of upper boundary, GER, calculated according to the Wavecontrol SMP2 measuring results is provided in Table 9.
Table 9: Maximum values of GER SMP2 [11]
| Location | Campaign | |
|---|---|---|
| 2018 | 2023 | |
| 1 | 0.1410 | 0.2410 |
| 2 | 0.5910 | 1.3810 |
| 3 | 0.6510 | 1.3910 |
| 4 | 0.1410 | 0.2810 |
| 5 | 1.8510 | 2.8610 |
| 6 | 4.2010 | 14.510 |
| 7 | 3.9110 | 7.3610 |
| 8 | 1.4310 | 2.8210 |
| 9 | 0.2210 | 0.2710 |
| 10 | 7.6910 | 4.2810 |
The highest increase of upper exposure boundary can be noticed for Location 6, where the maximum value of GER was about 69 times lower than the maximal allowable level GER 1.
Despite an expected increase of exposure values in the 2023 campaign, most values were several hundred or thousand times lower than the maximal allowable level.
C. SRM 3006 spectrum analyzer
For the first time, in the 2023 campaign, a frequency selective analysis of the high-frequency part of the spectrum was performed by the Narda SRM 3006 spectrum analyzer. It recorded actual, maximal, and averaged values of E-field strength, in the frequency range from 420 MHz to 6 GHz, while the averaging time was set to 1 minute.
Since no spectral components were detected in the range between 3 GHz and 6 GHz, at each of 10 locations, analyses were repeated in the shrunken frequency range from 420 MHz up to 3 GHz. Figure 6 shows the results of spectral analyses of the E-field at the monitoring locations.
At all locations, a dominant presence of E-field components in several frequency subranges can be noticed. Most of them are downlink and uplink bands for GSM 900/1800 MHz, UMTS 2100 MHz and LTE 800/1800/2100 MHz mobile phone technologies. Practically, these data confirmed the dominant contribution of five BSs in the campus, as initially expected according to a visual inspection of this area.
Some spectral components were detected in the range between 2400 MHz and 2500 MHz, which could originate from a number of local Wi-Fi networks in the campus, technically and visually unknown to authors.
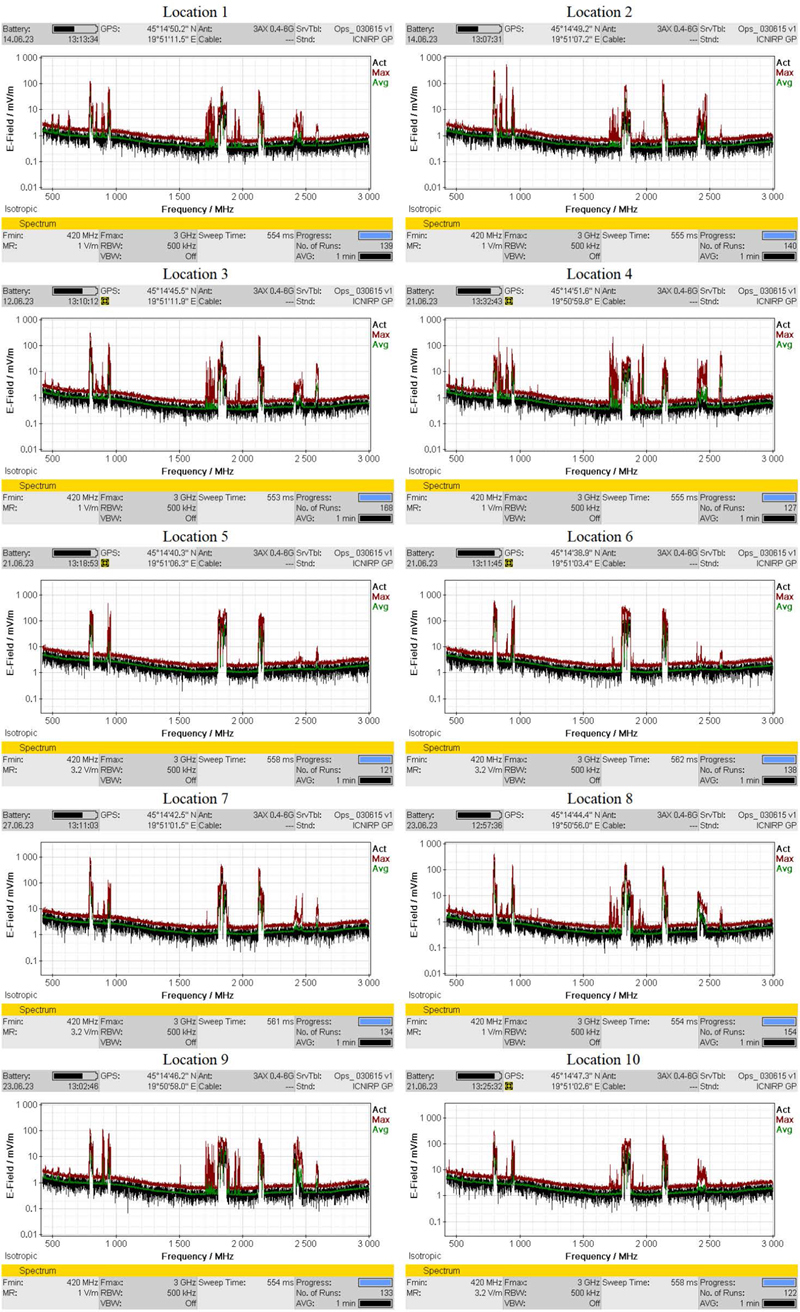
Figure 6: Spectrum content of the high-frequency E-field in the campus.
Finally, performed spectrum analyses showed that mobile communication technologies had dominant contribution to overall EMF exposure in the campus area. Therefore, these types of EMF sources could be regarded as those with the highest impact on exposure changes in this sensitive area.
Future campaigns should certainly include detailed analyses by the Narda SRM 3006 spectrum analyzer, bearing in mind the foreseen deployment of a new generation of mobile communication technology – 5G (New Radio - NR), the appearance of which is expected in the near future in the Republic of Serbia.
IV. CONCLUSION
The results of the three EMF monitoring campaigns in the University campus area are presented in this paper. As regards broadband monitoring in the range from 100 kHz to 6 GHz, comparative analysis of the measurement results showed an increase of E-field values, as well public exposure, at nine of the 10 monitoring locations. Regardless of that increase, all values remained significantly lower than the minimal reference level prescribed by Serbian legislation.
Similar conclusions are drawn from the previous two monitoring campaigns and measurements in the range from 700 MHz to 2600 MHz, observing E-fields originating primarily from mobile communications services. An increase of E-field strength values at nine of the 10 locations was noticed, but all acquired values were a few dozen times less than the minimal reference level prescribed for that frequency range.
Considering the wide prevalence of existing mobile communication technologies in the campus, the 2023 campaign included frequency selective analysis of the high-frequency part of spectrum at monitoring locations. Results revealed a dominant contribution of 2G/3G/4G mobile communication technologies in the spectrum, as well as a slightly smaller contribution of Wi-Fi technology. Those sources for certain have had the highest impact on the increase of EMF exposure in the campus in last decade.
Although exposure is still far below the maximal allowable level, it is clear that the contribution of mobile communication technologies will remain the most dominant in the future. This assumption is additionally strengthened by the announced deployment of 5G technology in the near future. Therefore, beside the necessity for periodic monitoring campaigns, measurements and exposure assessment analyses should be extended to the frequency range beyond 6 GHz, considering the features of 5G communication standards.
ACKNOWLEDGMENT
The paper is supported by Provincial Secretariat for Science and Technological Development of Autonomous Province of Vojvodina, through the project 142-451-3469/2023-01/02 and Ministry of Science, Technological Development and Innovations of the Republic of Serbia, through the project grant 451-03-65/2024-03/200156.
REFERENCES
[1] World Health Organization, WHO research agenda for radiofrequency fields, [Online] Available: https://who.int/iris/bitstream/handle/10665/44396/9789241599948_eng.pdf.
[2] X. Zhao, Z. Ji, W. Chu, Y. Zhao, L. Yan, H. Zhou, Q. Liu, and K. Huang, “Measurement and analysis of electromagnetic environment characteristics on Wangjiang campus of Sichuan university,” Radio Science, vol. 54, issue 7, pp. 633-645, July 2019.
[3] M. Fernández, D. Guerra, U. Gil, I. Trigo, I. Peña, and A. Arrinda, “Measurements and analysis of temporal and spatial variability of WiFi exposure levels in the 2.4 GHz frequency band,” Measurement, vol. 149, no. 106970, pp. 1-9, Jan. 2020.
[4] S. Keshmiri, N. Gholampour, and V. Mohtashami, “Assessing the compliance of electromagnetic fields radiated by base stations and WiFi access points with international guidelines on university campus,” Radiation Protection Dosimetry, vol. 192, issue 1, pp. 1-13, Oct. 2020.
[5] R. Ramirez-Vazquez, S. Arabasi, H. Al-Taani, S. Sbeih, J. Gonzalez-Rubio, I. Escobar, and E. Arribas, “Georeferencing of personal exposure to radiofrequency electromagnetic fields from Wi-Fi in a university area,” International Journal of Environmental Research and Public Health, vol. 17, issue 6, 1898, pp. 1-19, Mar. 2020.
[6] R. Ramirez-Vazquez, I. Escobar, A. Martinez-Plaza, and E. Arribas, “Comparison of personal exposure to radiofrequency electromagnetic fields from Wi-Fi in a Spanish university over three years,” Science of the Total Environment, vol. 858, Part 3, 160008, pp. 1-13, Feb. 2023.
[7] F. L. Suarez, S. M. Yepes, and A. Escobar, “Assessment of the electromagnetic field exposure due to wireless communication technologies in two university campuses of Medellin, Colombia,” Heliyon, vol. 9, issue 9, e20323, pp. 1-14, Sep. 2023.
[8] N. Djuric, D. Kljajic, K. Kasas-Lazetic, and V. Bajovic, “The SEMONT continuous monitoring of daily EMF exposure in an open area environment,” Environmental Monitoring and Assessment, pp. 187-191, Mar. 2015.
[9] Narda Safety Test Solutions GmbH, NBM-550 broadband field meter user’s guide, Narda, 2006.
[10] Narda Safety Test Solutions GmbH, EF 0691 electric field user’s guide, Narda, 2006.
[11] D. Kljajic and N. Djuric, “Comparative analysis of EMF monitoring campaigns in the campus area of the University of Novi Sad,” Environmental Science and Pollution Research, vol. 27, issue 13, pp. 14735–14750, May 2020.
[12] Wavecontrol SMP2 Electromagnetic field meter and spectrum analyzer [Online] Available: https://www.wavecontrol.com/rfsafety/images/data-sheets/en/SMP2_Datasheet_EN.pdf.
[13] Wavecontrol WPT Field probe for mobile frequency bands [Online] Available: https://www.wavecontrol.com/rfsafety/images/data-sheets/en/WPT_Datasheet_EN.pdf.
[14] Narda Safety Test Solutions GmbH, SRM3006, Selective radiation meter, operating manual, Narda, 2012.
[15] Law of the Republic of Serbia, “Regulation on the limits of exposure to non-ionizing radiation,” no. 104/09.
[16] D. Kljajic and N. Djuric, “The adaptive boundary approach for exposure assessment in a broadband EMF monitoring,” Measurement, vol. 93, pp. 515–523, Nov. 2016.
BIOGRAPHIES

Dragan R. Kljajić was born on April 29, 1987, in Novi Sad, the Republic of Serbia. He received a Ph.D. in Electrical and Computer Engineering, at Faculty of Technical Sciences in Novi Sad, at Department of Power, Electronic and Telecommunication Engineering. He works as an Associate Professor at the same Department. His scientific area is theoretical electrotechnics, while his research interests are in the field of theoretical electrical engineering, theoretical and applied electromagnetics and microelectronics. He is the author or co-author of more than 70 scientific papers, published in proceedings of international conferences and high impact factor journals. He is a member of IEEE society.

Nikola M. Djuric was born in Novi Sad, Serbia, in 1973. He received M.Sc. and Ph.D. degrees in Telecommunication and Signal Processing from the Faculty of Technical Sciences, University of Novi Sad, in 2003 and 2009, respectively. From 1997 to 2010 he was a Teaching Assistant; from 2010 to 2015 Assistant Professor; from 2015 to 2020 Associate Professor; while since 2020 he has been a Full Professor at FTN-UNS. He is the author or co-author of more than 100 journal and conference articles. His research interests include computational and applied electromagnetics, with environmental EMF measurement and monitoring for EMF compliance testing, estimation, and simulation of EMF whole-body exposure. He is a member of IEEE society.

Karolina K. Kasas-Lazetiz was born in Novi Sad, Serbia, in 1964. She received her Ph.D. degree in Electrical and Computer Engineering from the Faculty of Technical Sciences, University of Novi Sad. She has been with the same institution since the beginning of her teaching and scientific carrier. Currently, she is an Associate Professor at the Department of Power, Electronic and Telecommunication Engineering. Her main research interests are in the field of theoretical and applied electromagnetics, electromagnetic field analysis and measurement, as well as electromagnetic compatibility. She is the author and co-author of more than 100 scientific papers in refereed journals and international conferences. She is a member of IEEE society.

Miodrag M. Milutinov was born on August 28, 1976, in Zrenjanin, the Republic of Serbia. He received a Ph.D. in Electrical and Computer Engineering, at Faculty of Technical Sciences in Novi Sad, in the Department of Power, Electronic and Telecommunication Engineering in 2017. He works as an Associate Professor in the same Department. His scientific area is theoretical electrotechnics, while his research interests are calculation and measurements of electric and magnetic fields, electromagnetic compatibility, and human exposure to electromagnetic fields. He is the author or co-author of more than 80 scientific papers. He is a member of IEEEsociety.

Snezana M. Djuric is a Research Associate Professor at the BioSense Institute, University of Novi Sad. She received the M.Sc. and Ph.D. degrees in Electrical and Computer Engineering from the Faculty of Technical Sciences, University of Novi Sad. Her research interest is focused on sensors, wearable electronics, computational and applied electromagnetics, energy harvesting and energy storage.
ACES JOURNAL, Vol. 39, No. 7, 593–605
doi: 10.13052/2024.ACES.J.390703
© 2024 River Publishers