Mie Scattering Properties of Simple RCS Objects and Applications
Ilkyu Kim, Sun-Gyu Lee, and Jeong-Hae Lee
1Department of Electrical and Electronics Engineering
Sejong Cyber University, Seoul 05006, South Korea
Ikkim0704@sjcu.ac.kr
2Radio Environment Monitoring Laboratory
Electronics and Telecommunications Research Institute, Daejeon 34129, Republic of Korea
gyul0206@etri.re.kr
3Department of Electronic and Electrical Engineering
Hongik University, Seoul 04066, Republic of Korea
jeonglee@hongik.ac.rk
Submitted On: March 14, 2024; Accepted On: December 4, 2024
ABSTRACT
The requirement for advanced target recognition has facilitated the evolution of radar systems, enabling classification, recognition and identification of various types of objects. Numerous studies have focused on the accurate prediction of radar cross-section (RCS) for target identification. While the magnitude of the Mie scattering has been widely employed to enhance the likelihood for target detection, the proposed method based on the frequency spectrum of Mie scattering was presented for estimation of the size of the target. An accurate size of targets was quickly estimated using the frequency of the peak Mie scattering. The frequencies of Mie scattering are investigated using different radiuses of spheres and cylinders which directly indicate the size of objects. The peak magnitudes were acquired at 105485 MHz and 83398 MHz for spheres and cylinders, respectively, as the radiuses change from 0.1 m to 0.5 m. In addition, two aircraft-shaped models consisting of an ellipsoidal body, two wings and a stabilizer are used to obtain RCS scattering with various azimuth and elevation angles. Indoor RCS measurements with a metal sphere are presented in order to validate its effectiveness.
Index Terms: Aircraft-shaped objects, Mie scattering, radar cross-section (RCS), target identification.
I. INTRODUCTION
Radar systems have been widely used for the classification, recognition and identification of various types of objects [1–2]. A number of methods have been investigated for accurately predicting a radar cross-section (RCS) for the purpose of target identification [3–5]. The process of target identification commonly requires analyzing electromagnetic waves reflected back from targets. Several techniques have been applied to the analysis of RCS targets in which a simplified RCS object was used. Physical optics and geometrical optics methods have been applied to the analysis of simplified electromagnetic models for tanks [6], ships [7], aircraft [8] and missiles [9]. Statistical models based on the collected data set have been used in target identification and several algorithms have been investigated in order to implement effective target classifiers [10–12]. Radio frequency (RF) imaging has techniques for recognizing the details of unmanned aerial vehicles (UAV) with wings, payloads and body types [13]. However, this method typically demands intensive post-processing for the creation of target images. For time-limited operations, a simpler procedure requiring only RCS is more desirable. RCS scattering in the resonance (Mie) region has been used in target detection and classification algorithm in the time domain [14–16]. With a readily attainable frequency point of the highest RCS in the frequency domain, an accurate and more efficient target classification method may be achieved.
In this paper, a simple technique based on the unique signature of RCS scattering is proposed for the size estimation of targets. A workflow of this article is presented in Fig. 1. Compared to the conventional method, which has utilized the amplitude of the echo signal, more accurate estimation of target size can be realized using both magnitude and frequency of peak Mie scattering. The size of the target is instantly obtained by measuring the frequency where the peaks of RCS scattering are made. The frequencies of Mie scattering are investigated using different radiuses of spheres and cylinders, and aircraft-shaped model with various azimuth and elevation angles.
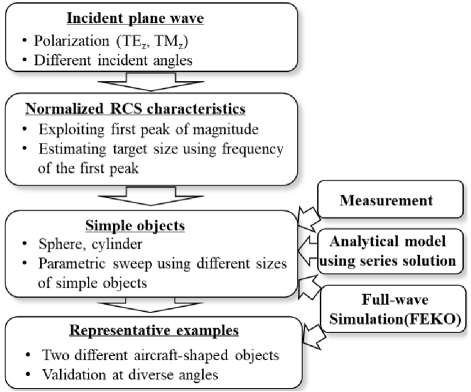
Figure 1: Workflow of this article: proposed method based on the frequency point of normalized RCS scattering.
The purpose of this section is to present the target estimation principles based on the distinct features of RCS scattering produced by the different sizes and shapes of objects. While estimation of the target size usually revolves around the magnitude of the echo signal, RCS scattering in the frequency domain [17] is introduced to enhance accuracy in this work. The frequency point where the first peak magnitude of RCS scattering appears is applied to the precise estimation of the target size. The proposed method was validated with RCS scattering of a metal sphere and cylinder, which were used as a simplified aircraft model, and the plane-wave incidence on the objects was assumed. Firstly, RCS scattering is investigated using the sphere and cylinder which were normalized with their cross-sections. Two spheres with radiuses of 25 mm and 15.9 mm were used for the evaluation in accordance with the setup of the indoor measurement presented in the subsequent sections. RCS scattering properties were obtained using the full-wave simulation FEKO and the analytical model based on series solution presented in [18]. The validity of the simulated results is evaluated with the calculated one. Figure 2 shows the magnitude of RCS normalized with the cross-section of the sphere and cylinder. Figure 2 (a) shows RCS characteristics in the Rayleigh and Mie regime. In the Mie regime, it tends to oscillate and converge to one for the optical regime [19].
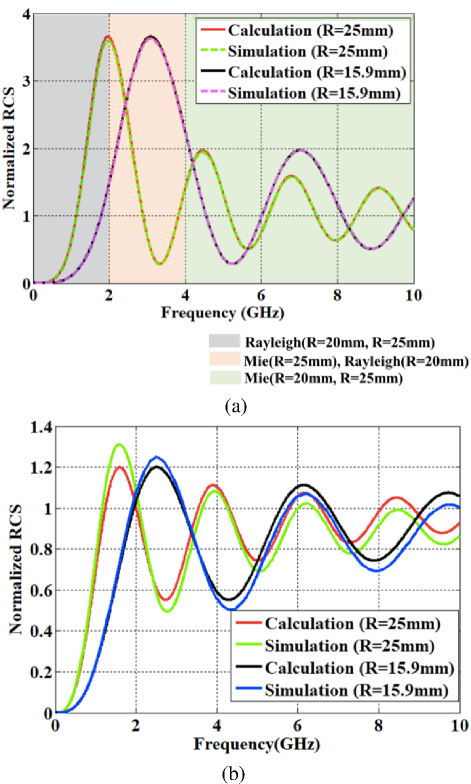
Figure 2: Monostatic RCS normalized with its cross-section for (a) the case of the sphere and (b) the case of thecylinder.
For the sphere with radiuses R25 mm and 15.9 mm, the peaks of the normalized RCS occurred at 2 GHz and 3 GHz, respectively. For the cylinder, an incident wave with TE polarization was used since it was more suitable for obtaining peak RCS value for target identification. Frequency points for the cylinder with radiuses of R25 mm and 15.9 mm were 1.6 GHz and 2.5 GHz, respectively, which were roughly 20% lower than both cases of the sphere, due to the larger RCS of the cylinder. For both cases, excellent agreement between the simulated and calculated results was observed. While the frequency points can be instantly obtained using the proposed method, the computational time of two spheres using FEKO was 3.9-5.3 hours per one case of simulations. Figure 3 shows frequencies of peak RCS calculated using the analytical model of the series solution with different radiuses of the sphere model and the cylinder model. It can be found that frequency of peak RCS decreases with increased radius of the sphere model and the cylinder model.
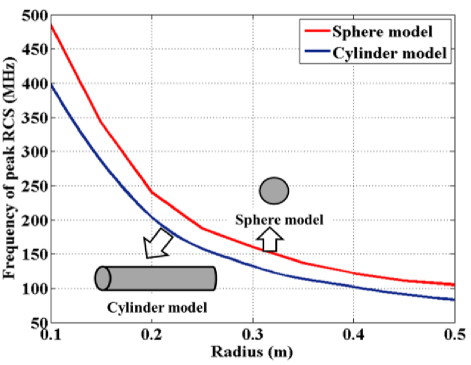
Figure 3: Frequencies of peak RCS calculated using the analytical model for different radiuses of the sphere model and the cylinder model.
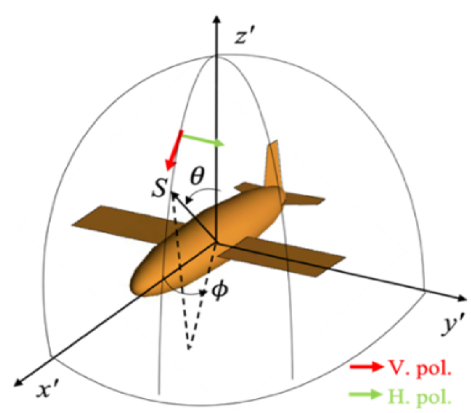
Figure 4: RCS scattering of the aircraft-shaped FEKO model: target inside a 3D spherical coordinate system.
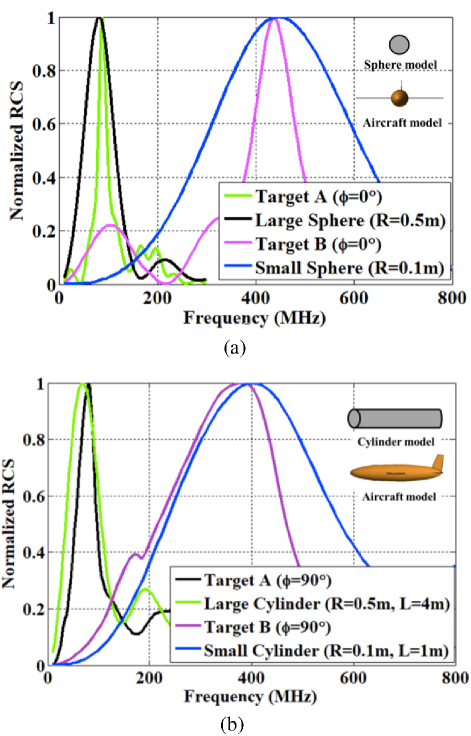
Figure 5: RCS scattering of the aircraft-shaped FEKO model: (a) target inside 3D spherical coordinate system and (b) scenarios of target detection.
Peak magnitudes were acquired at 105485 MHz for sphere and 83398 MHz for cylinder. The frequencies of the sphere model are slightly higher than the cylinder model. Note, the frequencies of the cylinder model depend on the radius regardless of length of the cylinder.
III. APPLICATIONS OF THE PROPOSED METHOD
One of the main purposes of this paper was to evaluate the applicability of the proposed method using an aircraft-shaped model. The main body of the aircraft model was modeled as an ellipsoidal shape to represent a large airplane (Target A) and a small airplane (Target B). The length and radius of the ellipsoidal shape is 4 m and 0.5 m for target A, and 1 m and 0.1 m for target B, respectively. The aircraft model includes the wing, the tail and the stabilizer. The target inside the 3D spherical coordinate system is shown in Fig. 4. In order to evaluate the proposed method based on the aircraft model, a comparative analysis between sphere and cylinder model and the aircraft model is presented.
The dimensions of the sphere and cylinder are set to correspond to those of target A and target B, respectively. Note that a vertically polarized incident wave is used due to its effectiveness in target classification. Figure 5 shows a comparison of the normalized RCS between the simple geometries and the aircraft-shaped model. Despite the difference in graph shapes, the frequencies of the peak points exhibit a remarkable similarity, deviating by less than 5% in terms of center frequencies. Using the two aircraft models, diverse line of sight scenarios were evaluated. Typical line of sight scenarios with elevation angle of 95110 and azimuth angle of 3060 were considered. Figure 6 shows the normalized RCS with respect to the elevation angle obtained from full-wave simulation FEKO. The frequencies of the highest value of the normalized RCS are approximately 90 MHz for target A and 510 MHz for target B. Deviation of the frequencies according to the elevation angles is less than 3 MHz for target A and 25 MHz for target B. There is a relatively small frequency variation in terms of the elevation angle . Figure 7 shows the normalized RCS of line-of-sight detection with the azimuth angle at the elevation angle =100.
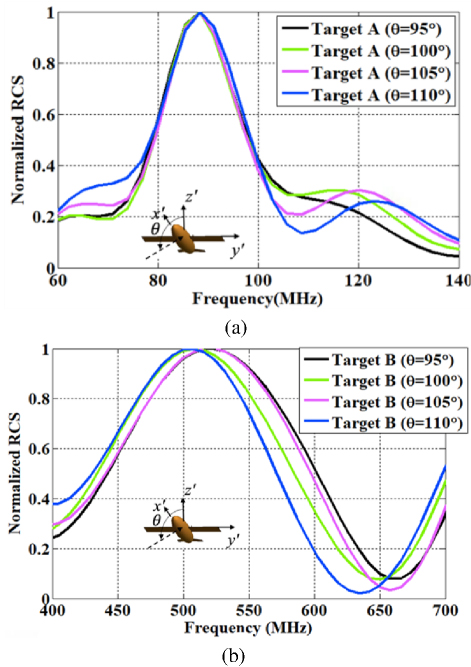
Figure 6: Normalized RCS in the frequency domain for (a) target A (large aircraft) and (b) target B (small aircraft) with elevation angles of 0, 45 and 90.
The circumference of the ellipsoidal model and the area of the two wings were changed for the different azimuth angle, which resulted in different frequencies. The peak RCS values were obtained at 8594 MHz for target A and 436492 MHz for target B. The observed frequency points, which are influenced by the incident angles, exhibit a variation of less than 15%, thereby providing significant utility in discriminating between various target types. It is shown that the method provides the successful classification of the two aircrafts. In Fig. 8, 3D plots of the frequencies of the highest RCS values are presented. It is observed that there is a slight increase of all frequencies at the azimuth angle 30. Although in the 3D plot a variation increases slightly, it can be found that two groups of frequencies for both large and small aircrafts can be achieved. This work studies modified shapes of the aircraft model to validate its effectiveness. Figure 9 presents the frequencies of the peak RCS for ellipsoidal object with different radiuses based on the target A. The similar frequencies of the peak RCS can be obtained when r/r is smaller than 2.0. It is also shown that the frequencies of the peak RCS are not severely affected by the modified shapes of the aircraftmodel.
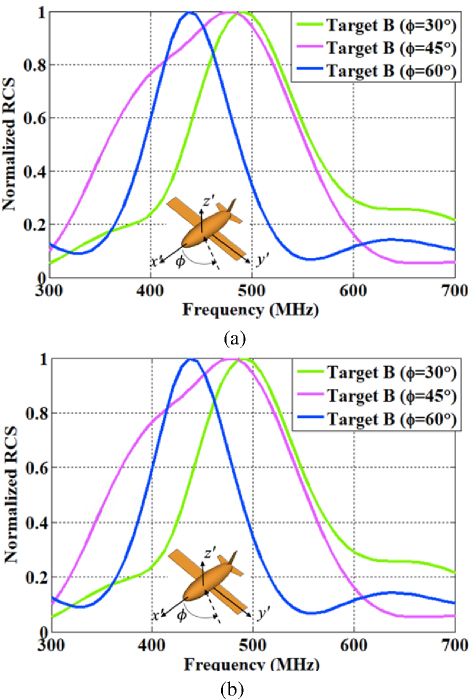
Figure 7: Normalized RCS in the frequency domain for (a) target A (large aircraft) and (b) target B (small aircraft) with azimuth angles of 0, 45 and 90.
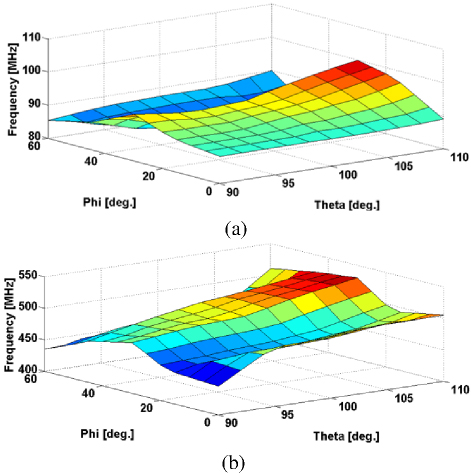
Figure 8: 3D plots of the frequencies of the highest RCS values for (a) target A (large aircraft) and (b) target B (small aircraft) with different azimuth and elevation angles.
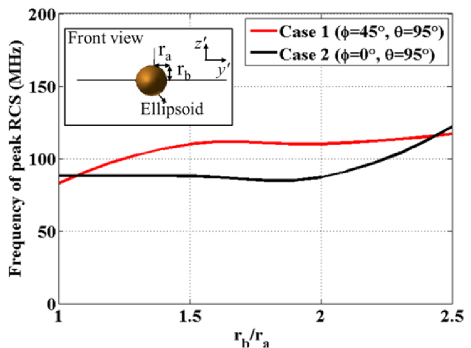
Figure 9: Frequencies of peak RCS with different radius ratio of the ellipsoidal object.
Next, the procedure to estimate the size of targets using the frequency of first peak RCS is presented. The first peak of the normalized RCS can be found to obtain its frequency point:
| (1) |
where and are the normalized RCS at frequency point and , respectively. The frequency point where the peak of the normalized RCS occurs can be obtained. Next step is to compare the frequency point to the one in the database using the target classification technique presented in [15]. The distance between two frequency points can be defined as:
| (2) |
where and are the frequencies of target a and b, respectively. Thus, an unidentified target with a frequency can be classified as a specific target u listed in the database under the following condition:
| (3) |
where M is the number of data points.
IV. MEASUREMENT OF RCS OF A METAL SPHERE
In order to evaluate the numerical approach, indoor measurement of a metal sphere is performed. To experimentally verify the relationship between target size and RCS in the frequency domain, a scattered signal is generated by the sample. Therefore, a careful measurement setup was required to enhance the signal originating from the sample while minimizing external interference signals. The sample was located at 1 m elevation using a Styrofoam stand to prevent interference by scattered waves from the indoor floor.
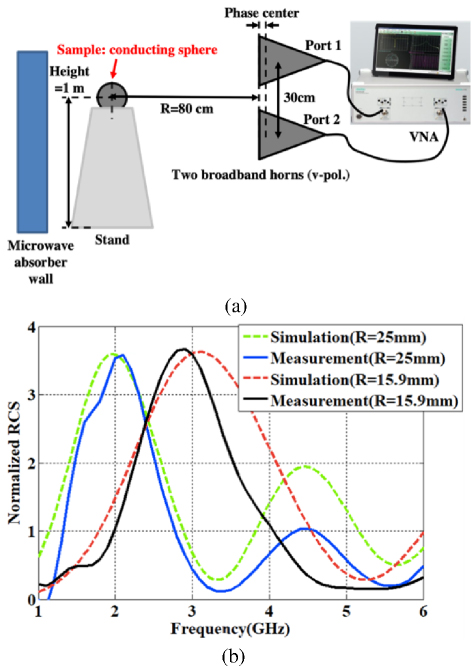
Figure 10: Evaluation using indoor measurements: (a) depiction of the indoor measurement setup and (b) comparison between simulated and measured results for the two different radiuses of the metal spheres.
Microwave absorber walls were placed around the sample to minimize interference by scattered waves from the indoor wall. Two broadband horn antennas operating in the frequency range of 1-6 GHz were used to generate an incident wave of vertical polarization (v-pol).Separation distance between the sample and the two horns was the most important factor in determining the strength of the scattered signal from the sample. Since the previous study [20] suggested that the horn antenna had little gain reduction when the distance to the target normalized by the far-field distance was greater than 2, the separation distance was set to 80 cm. Finally, RCS can be calculated from the measured S21 in a vector network analyzer (VNA). A time-gating function [21] was used to separate the scattered signal by the sample from the noises, such as thermal noise and near-field coupling between two horns. Figure 10 (b) shows the measured RCS of the conducting spheres. The trend of measured results agrees well with the calculation and simulation results. The discrepancy in the second peak value was mainly due to a slight axis misalignment and a time-gating error. It was experimentally verified that target size could be distinguished from RCS shape in the frequency domain.
V. CONCLUSION
The proposed method based on the frequency spectrum of the scattering characteristics was presented for estimation of the size of the target. Target size was estimated using the distinctive features of RCS scattering in the Mie region. The principle of estimating the size of the target was presented for a simple aircraft model consisting of a metal sphere and cylinder which simply represents the front and side of an aircraft. The ellipsoidal aircraft model with the wing, the tail and the stabilizer was evaluated in terms of different aircraft sizes, and its azimuth and elevation angles. The peak magnitudes were acquired at 8594 MHz for target A and 436492 MHz for target B. Peak RCS values at different frequencies imply the sizes comparable to small and large aircraft. The frequency points according to the azimuth and elevation angles shows a relatively small deviation providing significant utility in discriminating various targets.
ACKNOWLEDGMENT
J.-H. Lee and I. K. Kim were funded by the National Research Foundation of Korea (NRF) grant funded by the Korea government (MSIT) (RS-2024-00343372).
REFERENCES
[1] I. Guvenc, F. Koohifar, S. Singh, M. L. Sichitiu, and D. Matolak, “Detection, tracking, and interdiction for amateur drones,” IEEE Comm. Magazine, vol. 56, no. 4, pp. 75-81, Apr. 2018.
[2] I. Kim, H. Kim, and J.-H. Lee, “Theoretical minimum detection range for a rapidly moving target and experimental evaluation,” J. Electromagn. Eng. Sci., vol. 21, no. 2, pp. 161-164, Apr. 2021.
[3] A. Boag, “A fast iterative physical optics (FIPO) algorithm based on non-uniform polar grid interpolation,” Microw. Opt. Technol. Lett., vol. 35, no. 3, pp. 240-244, Nov. 2002.
[4] M. A. Shah, B. A. Salau, and Ç. Tokgöz, “Bistatic radar cross section prediction using iterative physical optics with physical theory of diffraction for plate geometries,” in 2020 IEEE Int. Symp. on Antennas and Propag. and North American Radio Sci. Meeting, Feb. 2020.
[5] M. A. Shah, B. A. Salau, and Ç. Tokgöz, “Radar cross section prediction using iterative physical optics with physical theory of diffraction,” IEEE Trans. Antennas Propag., vol. 70, no. 6, pp. 4683-4690, June 2022.
[6] R. J. Burkholder, Ç. Tokgöz, C. J. Reddy, and W. O. Coburn, “Iterative physical optics for radar scattering predictions,” Appl. Comput. Electromagn. Soc. J., vol. 24, no. 2, pp. 241-258, June 2009.
[7] E. Gillion, E. Rochefort, J. Claverie, and C. Brousseau, “Improvement of RCS estimation of large targets by using near-field approach,” in IEEE Radar Conf, Ottawa, Canada. p. 1, Apr. 2013.
[8] W. D. Burnside, R. C. Rudduck, and R. J. Marhefka, “Summary of GTD computer codes developed at the Ohio State University,” IEEE Trans. Electromagn. Compat., vol. EMC-22, no. 4, pp. 238-243, Feb. 1980.
[9] G. S. B. Rao, S. Nambari, S. Kota, and K. S. R. Rao, “Monostatic radar cross section estimation of missile shaped object using physical optics method,” 2017 IOP Conf. Ser.: Mater. Sci. Eng., p. 225,2017.
[10] F. Obelleiro-Basterio, J. L. Rodriguez, and R. J. Burkholder, “An iterative physical optics approach for analyzing the electromagnetic scattering by large open-ended cavities,” IEEE Trans. Antennas Propag., vol. 43, no. 4, pp. 356-361, Apr. 1995.
[11] M. Ezuma, C. K. Anjinappa, M. Funderburk, and I. Guvenc, “Radar cross section based statistical recognition of UAVs at microwave frequencies,” IEEE Trans. on Aerospace and Electronic Systems, vol. 58, no. 1, pp. 27-46, Feb. 2022.
[12] S. Lee, S.-J. Jeong, B.-S. Kang, H. Kim, S.-M. Chon, and H.-G. Na, “Classification of shell-shaped targets using RCS and fuzzy classifier,” IEEE Trans. Antennas Propag., vol. 64, no. 4, pp. 1434-1443, Apr. 2016.
[13] C. J. Li and H. Ling, “An investigation on the radar signatures of small consumer drones,” IEEE Antennas and Wireless Propag. Letts., vol. 64, no. 4, pp. 649-652, Apr. 2016.
[14] Y.-R. Jeong, C.-S. Park, Y.-K. Ko, and J.-G. Yook, ”Analysis of RCS of low observable aircraft in VHF band,” Int. J. of Antennas Propag., vol. 2018, p. 10, 2018.
[15] J. S. Chen and E. K. Walton, “Comparison of two target classification techniques,” IEEE Trans. Aerospace and Electronic Systems, vol. AES-22, no. 1, pp. 15-22, Jan. 1986.
[16] D. Moffatt and R. Mains, “Detection and discrimination of radar targets,” IEEE Trans. Antennas Propag., vol. 23, no. 3, pp. 358-367, May 1975.
[17] T. Mizushima, R. Nakamura, and H. Hadama, “Reflection characteristics of ultra-wideband radar echoes from various drones in flight,” 2020 IEEE Topical Conf. Wireless Sensors Sens. Netw. (WiSNeT), pp. 30-33, 2020.
[18] C. A. Balanis, Advanced Engineering Electromagnetics, 2nd ed. New Jersey: Wiley, 2012.
[19] I. Kim, S. Xu, and Y. Rahmat-Samii, “Generalised correction to the Friis Formula: Quick determination of the coupling in the Fresnel region,” IET Microw. Antennas Propag., vol. 7, no. 13, pp. 1092-1101, Oct. 2013.
[20] C. Uluisik, G. Cakir, M. Cakir, and L. Sevgi, “Radar cross section (RCS) modeling and simulation, part 1: A tutorial review of definitions, strategies, and canonical examples,” IEEE Antennas and Propag. Magazine, vol. 50, no. 1, pp. 115-126, Feb. 2008.
[21] A. Henderson, J. R. James, P. Newham, and G. Morris, “Analysis of gating errors in time domain antenna measurements,” IEE Proceedings H (Microw. and Antennas and Propag.), vol. 136, no. 4, pp. 311-320, Aug. 1989.
BIOGRAPHIES

Ilkyu Kim received his B.S. degree in Electronics and Electrical Engineering from Hongik University, Seoul, South Korea, in 2003, the M.S. degree in Electrical Engineering from University of Southern California, Los Angeles, CA, in 2006, and Ph.D. degree in Electrical Engineering from University of California at Los Angeles in 2012. He was with Samsung Advanced Institute of Technology from 2006 to 2008. After gaining his Ph.D. degree, he joined the Defense Agency for Technology Quality, Daejeon, South Korea, where his research area was studying radar and space applications. Since 2022, he has been an assistant professor with the Department of Electrical and Electronics Engineering, Sejong Cyber University, Seoul, South Korea. His research interests include but are not limited to computation of electromagnetic mutual coupling and antenna design for space and radar applications.

Sun-Gyu Lee received the B.S., M.S. and Ph.D. degrees in electronic and electrical engineering from Hongik University, Seoul, South Korea, in 2016, 2018 and 2023, respectively. He was a Research Professor of the Metamaterial Electronic Device Research Center, Hongik University, Seoul, South Korea, in 2023. Since 2024, he has been working as a Senior Researcher with the Electronics and Telecommunications Research Institute, Daejeon, South Korea. His current research interests include reconfigurable metasurfaces, reconfigurable intelligent surfaces and phased array antennas.

Jeong-Hae Lee received the B.S. and M.S. degrees in electrical engineering from Seoul National University, South Korea, in 1985 and 1988, respectively, and the Ph.D. degree in electrical engineering from the University of California at Los Angeles, Los Angeles, CA, USA, in 1996. From 1993 to 1996, he was a Visiting Scientist of general atomics in San Diego, CA, USA, where his major research initiatives were developing a millimeter-wave diagnostic system and studying plasma wave propagation. Since 1996, he has been a Professor with the Department of Electronic and Electrical Engineering, Hongik University, Seoul, South Korea. He was President of the Korea Institute of Electromagnetic Engineering and Science in 2019. He is currently Director of the Metamaterial Electronic Device Center. He has more than 130 articles published in journals and 80 patents. His current research interests include metamaterial radio frequency devices and wireless power transfer.
ACES JOURNAL, Vol. 40, No. 2, 123–129
doi: 10.13052/2025.ACES.J.400205
© 2025 River Publishers