Effect of Cotton and Wool Fabrics on the Accuracy of Electromagnetic Dosimetry Analysis Due to Millimeter Wave Exposures
Fatih Kaburcuk
Department of Electrical-Electronics Engineering
Sivas University of Science and Technology, Sivas 58100, Turkiye
fkaburcuk@sivas.edu.tr
Submitted On: April 22, 2024; Accepted On: October 17, 2024
ABSTRACT
With the development of wireless communication, satellite, and radar technologies operated at millimeter wave (MMW) frequency range, it is essential to consider the adverse health effects of the radiated electromagnetic (EM) fields at MMW frequency. In most EM dosimetry analyses for the human body models, bare human models have been considered. However, the presence of fabrics such as cotton and wool on the human body can affect the accuracy of the EM dosimetry analysis. At the MMW frequency range, the effect of fabrics on EM dosimetry analysis in a human body model has not been extensively investigated using the finite-difference time-domain (FDTD) method. In this study, the effects of fabrics on the human body on the power transmission coefficient, specific absorption rate, absorbed power density, and heating factor due to EM MMW exposure are investigated using the FDTD method. Numerical results show that the thickness of the fabrics and air gap introduced between the fabrics and the skin surface significantly affects the accuracy of EM dosimetry analysis at the frequency range 1-100 GHz.
Index Terms: Absorbed power density, electromagnetic exposure, fabric effects, FDTD method, heating factor, millimeter wave, SAR.
I. INTRODUCTION
With the development of 5G and 6G wireless communication, satellite, and radar technologies, which require high data speeds and secure communication, the use of millimeter wave (MMW) frequencies [1–4] has increased significantly. Devices operated at MMW frequency range radiate electromagnetic (EM) fields that comply with EM field exposure limits for human safety determined by international guidelines. These guidelines are defined by the International Commission on Non-Ionizing Radiation Protection (ICNIRP) [5] and the IEEE International Committee on Electromagnetic Safety (IEEE-ICES) [6].
Below 6 GHz, IEEE and ICNIRP guidelines recommend basic restrictions which are specific absorption rate (SAR) over 1-gram and 10-gram tissues and incident power density (IPD) for EM field exposure limits. In the frequency range 6-300 GHz, the basic restrictions and limitations determined by the guidelines are absorbed power density (APD), IPD, and whole-body average SAR for a given IPD.
Interaction between the human body and EM field exposure generated by far-field and near-field sources has been extensively investigated in [7–23] at different frequency of interest. In most studies [7–18], human body models with bare skin have been used for EM dosimetry analysis at below and above 6 GHz. However, electromagnetic power absorption by biological tissues can be affected by the presence of fabrics on the human body [19–23]. Power transmission coefficients (PTC) [19] in the presence of a fabric on the skin surface with and without an air gap between the fabric and skin surface have been analytically calculated up to 300 GHz. Therefore, it is important to consider the impact of fabrics on the accuracy of EM dosimetry analysis, especially at MMW frequency range. In several studies [1, 2, 19–23], the effect of fabrics on the human body has been investigated due to EM field exposure at MMW frequencies, and it could be concluded that the presence of fabric on the human body acts as impedance matching layers affecting EM field absorption. The effects of most common fabrics, cotton and wool, on APD, PTC, and temperature rise of a one-dimensional (1D) four-layered model are investigated in [20] using the finite element method (FEM) due to EM far-fields exposure and in [20] using CST software employing the finite integration technique (FIT) at 26 GHz and 60 GHz. The effect of fabrics on the human body for body centric communication has been studied in terms of path gain at 60 GHz in [21]. Two-dimensional (2D) clothed skin models with cotton and wool fabrics experiencing EM field exposure with oblique incident angle at 60 GHz in [22] and over the frequency range from 20 GHz to 100 GHz in [23] have been investigated using Monte Carlo simulations. However, to the best of our knowledge, 1D clothed multi-layered human body models exposed to an EM field at MMW frequency range have not been investigated using the finite-difference time-domain (FDTD) method.
The FDTD method has been widely used in EM dosimetry analysis of three-dimensional (3D) human body voxel models without clothing. However, it is difficult to create 3D clothed human body voxel models for EM dosimetry analysis based on the FDTD method, especially at MMW frequency range. Therefore, a 1D multi-layered head model obtained from a realistic head voxel model as in [11] can be used in EM dosimetry analysis using the FDTD method based on the Debye model to show the effect of different fabric materials on the EM field exposure metrics at wide range of frequencies from 1 GHz to 100 GHz.
In this study, a 1D multi-layered head model clothed with cotton or wool fabrics is analyzed using the FDTD method based on the Debye model to show the effect of fabrics in the human body over the frequency range from 1 GHz to 100 GHz. Furthermore, the effect of fabric thickness and effect of an air gap between the fabrics and the skin surface in the 1D multi-layered model on the accuracy of EM dosimetry analysis are investigated using the FDTD method at frequencies up to 100 GHz. Numerical results obtained in this study show that PTC, APD, and heating factor based on the temperature rise and APD in the 1D multi-layered model are significantly affected by the presence and thickness of fabrics and air gap.
II. METHOD AND MODELS
A. 1D multi-layered model and fabrics
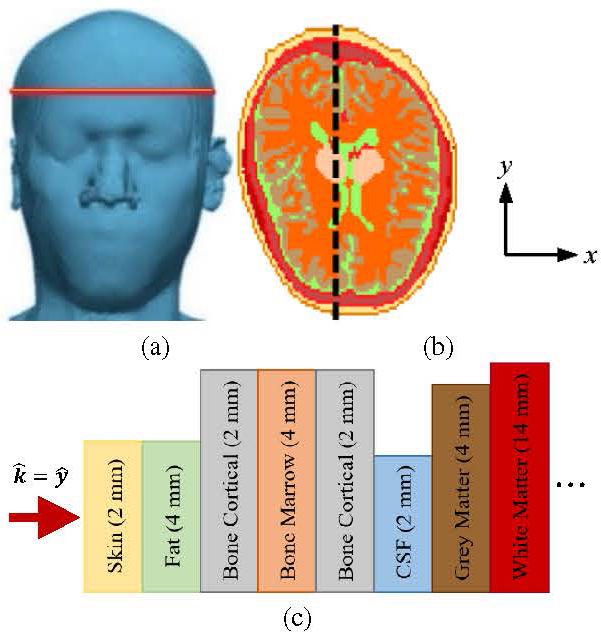
Figure 1: (a) 3D human head model [24] (red band shows the 2D cross sectional of forehead region), (b) 1D multi-layered forehead model (black dashed line), and (c) types of tissues and their thickness in the 1D model.
A 1D multi-layered model extracted from the forehead region of 3D realistic human head model [24] shown in Fig. 1 (a) is used in the EM dosimetry analysis. The tissue arrangement and thicknesses in the 1D multi-layered model, shown as dashed lines in Fig. 1 (b), are shown in Fig. 1 (c).
The 1D multi-layered forehead model in Fig. 1 (b) covered by cotton/wool fabrics, such as a hat, is used in this study to show the effect of clothing on EM dosimetry analysis. The complex relative permittivity [] of the cotton and wool, which are and , respectively, are given in [20]. The thickness of fabrics (t) varies from 0.5 mm to 3 mm or more. The thickness of air gap (t) between the fabric and the skin surface varies from 0 mm to several mm.
B. FDTD method based on the Debye model
The FDTD method mostly used in the EM dosimetry analysis provides solutions at a wide range of frequencies when the Debye model [25, 26] is integrated into the FDTD method to analyze frequency-dependent biological tissues as in [10, 11]. The three-term Debye parameters ( relative permittivity at infinite frequency, static relative permittivity, and relaxation time at k term) of head tissues provided in [27] are used in the Debye model to obtain solutions up to 100 GHz. These Debye parameters were obtained from a numerical procedure presented in [28] and provide EM solutions at frequencies up to 100 GHz in a single FDTD simulation:
| (1) |
In the FDTD method, cell size is set to 0.0625 mm which satisfies the Courant-Friedrichs-Lewy (CFL) condition [26]. The FDTD computational domain is terminated by 10-cell convolution perfect matched layers (CPML) with 15-cell air layers. A Gaussian waveform considered as an incident plane wave including all frequency of interest up to 100 GHz is generated on the total-field scattered-field (TF-SF) boundary [26] to excite the FDTD computational domain. The IPD of the incident plane wave based on the public exposure scenario in the ICNIRP guideline [5] is set to 5 W/m at 1 GHz and 10 W/m over the frequency range from 2 GHz to 100 GHz.
C. Calculations of power transmission coefficient, SAR, absorbed power density, and heating factor
In order to evaluate transmission from air to skin tissue, the power transmission coefficient (PTC) is calculated by dividing the total power deposition (TPD) by the IPD. The TPD of the 1D model is expressed in [29] as:
| (2) |
where i is larger than penetration depth in the 1D model, and [V/m] and [S/m] are the electric field strength and the electric conductivity of the i indexed cell of the tissues, respectively. The APD [30] for 1D multi-layered models can be expressed as:
| (3a) |
where:
| (3b) |
where is the characteristic impedance in free space and is the relative permeability of a material. The SAR defined in [5, 6] is calculated to determine how much EM power is absorbed per unit mass of tissues:
| (4) |
where is the mass density of the tissues.
The temperature rise distribution in the 1D multi-layered model due to EM field exposure has been calculated by using the Pennes bioheat equation [31]. This equation can be solved using the finite-difference approximation as follows:
| (5) | ||
where [J/(kgC)], [W/(mC)], and [W/(mC)] are the heat capacity, the thermal conductivity, and the blood perfusion rate, respectively, and is the resolution of 1D multi-layered model. is the temperature [C] at time and at i indexed cell, and is the blood temperature [C] set to 37C. The thermal increment () for the iterative calculation of equation (5) must satisfy the thermal stability numerically:
| (6) |
The convection boundary condition for a clothed 1D model without an air gap can be solved using the finite difference approximation as implemented in [10, 11]. However, the boundary conditions in the presence of an air gap between the fabric and skin surface can be considered in [32, 33] as a closed enclosure. The convective boundary condition is expressed as:
| (7) |
where is the air temperature set to 20C, is the unit normal vector to the interfaces, and is the convection heat transfer coefficient of 10.5 [W/(mC)]. The mass density and thermal parameters of the tissues used here are provided in [34]. The steady-state temperature distribution in the human body model is calculated when SAR 0. Then, the final temperature rise distribution is computed by solving the bioheat equation again when SAR 0. Finally, the temperature rise distribution is difference of the steady-state and final temperature distributions.
The heating factor, defined as the steady-state temperature rise divided by APD, is calculated as a function of frequency up to 100 GHz. The heating factor is a useful assessment of thermal effect due to EM wave exposure at frequencies above 6 GHz. Above 6 GHz, the maximum heating factor should be at most 0.025 [Cm/W] based on [13].
III. NUMERICAL RESULTS
To verify the validity of the FDTD method based on the Debye model, the 1D multi-layered forehead bare model is analyzed to obtain APD and local SAR values at 60, 77, and 100 GHz when IPD is 10 W/m. In Table 1, the maximum values of APD and local SAR of the 1D human forehead model are compared with the results presented in [1, 14, 19]. The results obtained in this study are in good agreement with the published results, despite analyzing different multi-layered models. The 1D multi-layered models clothed with cotton/wool fabrics of different thickness (t) in contact with the skin surface (t 0) are analyzed in this study to calculate the PTC and APD values at 60 GHz for IPD of 10 W/m. For comparison, Table 2 shows the results obtained in this study and obtained using FEM in [20].
Table 1: Max. APD and local SAR values at different frequencies of interest for IPD of 10 W/m
| Models | Freq. [GHz] | Max. APD [W/m] | Max. SAR [W/kg] |
|---|---|---|---|
| [1] | 60 | 6.2 | 26.0 |
| [19] | 5.9 | 27.6 | |
| This study | 6.2 | 20.6 | |
| [14] | 77 | N/A | 27.2 |
| This study | 6.5 | 25.4 | |
| [14] | 100 | N/A | 33.9 |
| This study | 6.9 | 29.3 |
Table 2: PTC and max. temperature rise at 60 GHz
| Cotton (mm) | Models | TPC | APD |
|---|---|---|---|
| 1 | [20] | 0.79 | 7.8 |
| This study | 0.78 | 7.8 | |
| 2 | [20] | 0.72 | 6.4 |
| This study | 0.63 | 6.4 | |
| 3 | [20] | 0.77 | 6.3 |
| This study | 0.65 | 6.4 |
A. Effect of cotton/wool thickness on EM exposure metrics
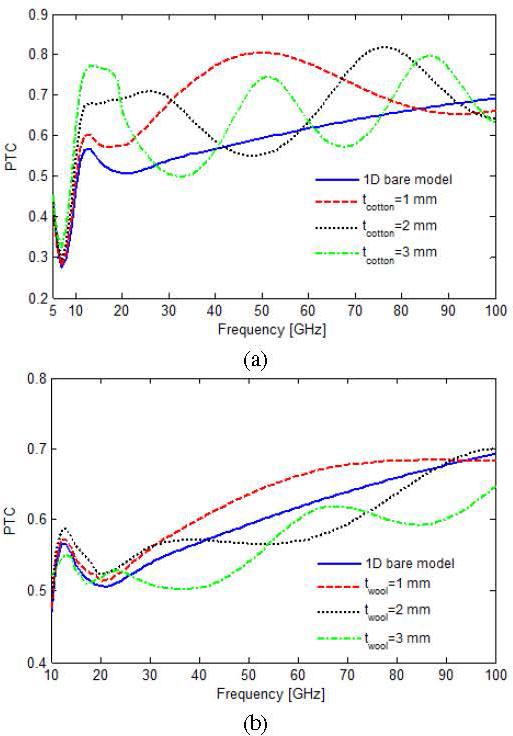
Figure 2: PTCs of bare and clothed 1D multi-layered forehead models with different thickness of (a) cotton (t) and (b) wool (t) fabrics when t 0.
The effects of cotton/wool thickness in contact with skin surface in the 1D multi-layered forehead models are analyzed using the FDTD method over the frequency range up to 100 GHz. PTCs of the 1D bare and clothed models with cotton/wool fabrics of 1, 2, and 3 mm thickness are calculated and shown in Fig. 2 as a function of frequency. It can be realized that power transmission between the fabrics and skin surface is significantly affected by the fabric type and thickness, and the frequency of EM field exposure. As frequency changes, there may be an oscillation in power transfer to the skin surface. PTCs for clothed models in Fig. 2 have maxima and minima at certain frequencies because the fabric acts as impedance matching layers. In PTC values for the 3 mm thick cotton, the first highest occurs at a frequency of 17 GHz, where the thickness of cotton is equal to t [19] where is the wavelength in the fabrics. Similarly, other maxima of PTC occur at frequencies of 51 and 85 GHz when t and t, respectively. It can be deduced that peak values of PTCs appear at frequencies where the thickness of fabrics is equal to odd multiples of [19] and expressed as:
| (8) |
where is phase velocity in the fabrics, f is the frequency of the EM field, and is an integer number. In Table 3, frequencies calculated from equation (8) and obtained from Fig. 2 are the frequencies at which peak power absorption occurs for different thicknesses of the cotton and wool fabrics. The frequencies obtained from Fig. 2 are in good agreement with those obtained from exact calculation in equation (8). Additionally, it can be seen from Fig. 2 that PTC values below 10 GHz are not affected by the presence of fabrics because the thickness of fabrics is smaller than the wavelengths of the EM waves at frequencies below 10 GHz.
Table 3: Frequencies for peak PTCs in Fig. 2 and calculated from equation (8) for fabrics with different thickness
| Models | Thickness [mm] | Exact Freq. in (8) [GHz] | Freq. in Fig. 2 [GHz] |
|---|---|---|---|
| Cotton | 1 | 53.03 | 51 |
| 2 | 26.51/79.55 | 26/77 | |
| 3 | 17.68/53.03/88.38 | 17/51/85 | |
| Wool | 1 | 67.9 | 74 |
| 2 | 33.95 | 34 | |
| 3 | 22.63/67.90 | 23/68 |
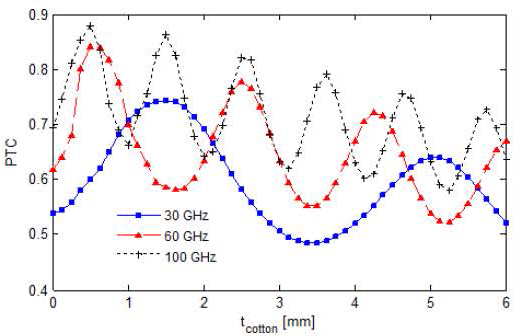
Figure 3: PTCs at 30, 60, and 100 GHz as a function of t for the 1D multi-layered forehead models clothed with cotton fabric when t 0.
Figure 3 shows the PTCs of 1D models clothed with cotton fabric as a function of its thickness at frequencies of 30, 60, and 100 GHz. In Fig. 3, the maximum PTC values for each frequency of interest occurs when the cotton thickness is equal to odd multiples of in equation (8). Table 4 shows the cotton thickness at which PTC values are maximum at 30, 60, and 100 GHz, calculated from equation (8) and obtained from Fig. 3. The cotton thickness calculated using equation (8) and obtained from Fig. 3 are in acceptable agreement.
Table 4: Cotton thickness for peak PTCs in Fig. 3 and calculated from equation (8) at 30, 60, and 100 GHz
| Freq. [GHz] | Exact Thickness in (8) [mm] | Thickness in Fig. 3 [mm] |
|---|---|---|
| 30 | 1.8/5.3 | 1.5/5.125 |
| 60 | 0.88/2.7/4.4 | 0.625/2.5/4.25 |
| 100 | 0.53/1.6/2.7/3.7/4.8/5.8 | 0.5/1.5/2.5/3.625/4.625/5.75 |
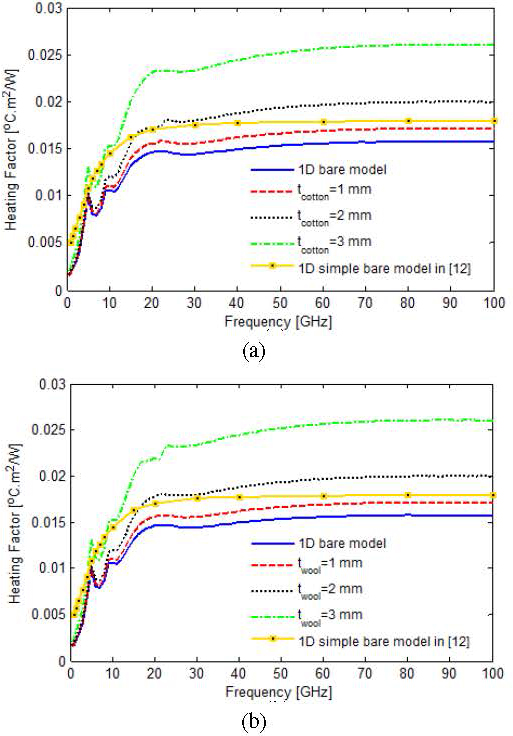
Figure 4: Heating factors of the bare and clothed 1D models with different thickness for (a) cotton (t) and (b) wool (t) fabrics when t 0.
Heating factors for cotton and wool fabrics with the thickness of 1, 2, and 3 mm are shown in Fig. 4 over the frequency range up to 100 GHz. The calculated heating factors are compared to those obtained for a 1D multi-layered bare model presented here and a simple 1D bare model presented in [12]. The heating factors are frequency-dependent below 30 GHz, whereas they are little affected by frequency changes above 30 GHz. They are significantly affected by the thickness of the fabric and not so much by the type of fabric.
The frequency-dependent local SAR values are calculated for the 1D multi-layered forehead model clothed with cotton/wool fabrics having different thicknesses when t 0. Peak local SAR values for clothed with different thickness and bare 1D multi-layered models are shown in Fig. 5 as a function of frequency. From Fig. 5, peak SAR values of 1D models, especially at frequencies above 20 GHz, are affected by the presence of fabrics and their thickness on the 1D model. It can be realized from Figs. 2 and 5 that the frequencies at which the maxima and minima values in the PTC curves occur are the same as the frequencies at which the maximum and minimum values occur in the SAR curves.
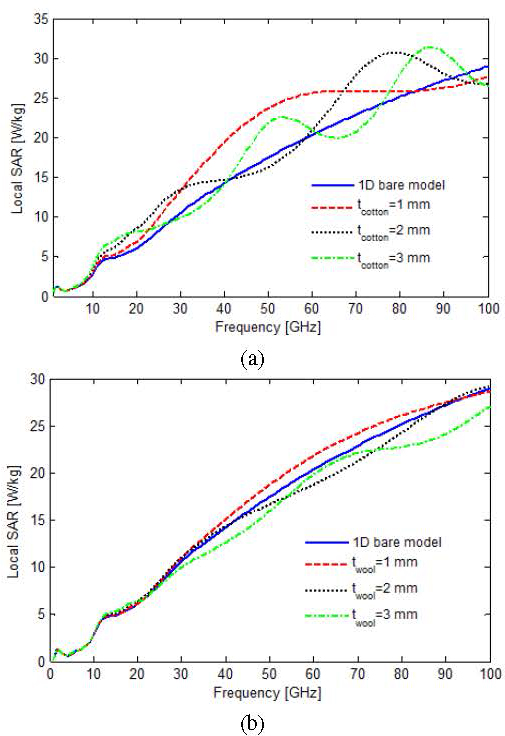
Figure 5: Peak local SAR of bare and clothed 1D models for different thickness of (a) cotton and (b) wool fabrics when t = 0.
B. Effect of air gap thickness between fabrics and skin surface
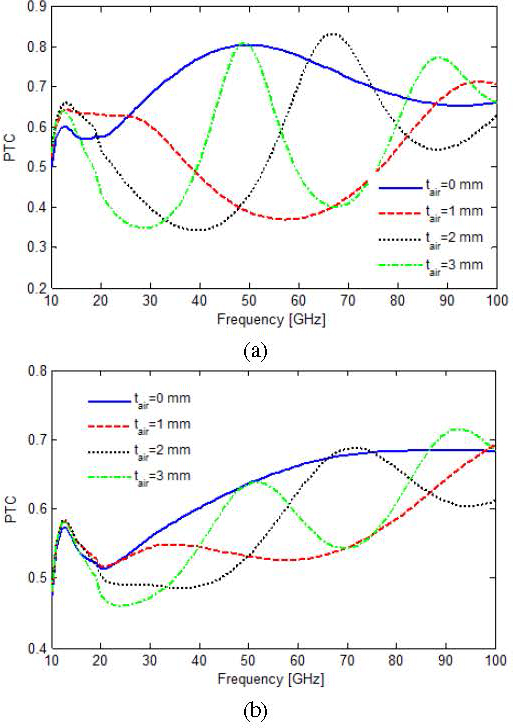
Figure 6: PTCs of the 1D model clothed with 1 mm thick (a) cotton and (b) wool fabrics when t 0, 1, 2, 3 mm.
To demonstrate the effects of different thickness for an air gap between fabric and skin surface on the EM field absorption, 1D multilayer forehead models clothed with 1 mm thick cotton/wool fabrics in the presence of an air gap with different thicknesses (t 0, 1, 2, 3 mm) are analyzed up to 100 GHz. PTCs for the different thickness of air gap in the 1D multi-layered model are shown in Fig. 6. It can be seen from Fig. 6 that PTCs of clothed 1D models are increasing and decreasing in the presence of the air gap over the frequency range. The air gap and fabrics act as impedance matching layers between the fabrics and the skin surface, and they create fluctuations over the frequency band. Cotton fabric causes larger fluctuations in the PTC values over the frequency band due to its higher relative permittivity compared to the permittivity of wool fabric. In Fig. 7, the PTCs of the 1D model clothed with 1 mm thick cotton at frequencies of 30, 60, and 100 GHz are shown as a function of air gap thickness. From Fig. 6, it can be noticed that PTC values are significantly affected by the change of thickness of the air gap between the fabric and the skinsurface.
Heating factors of the 1D multi-layered models clothed with 1 mm thick cotton and an air gap of 1, 2, and 3 mm thickness are shown in Fig. 8. At the frequency band above 10 GHz, heating factors for cotton fabric are slightly higher than those for wool fabric due to having higher relative permittivity of the cotton fabric. They are not affected by the presence of an air gap larger than 1 mm thick.
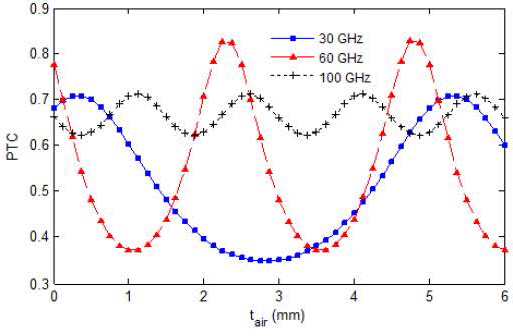
Figure 7: PTCs at 30, 60, and 100 GHz as a function of t for 1 mm thick cotton.
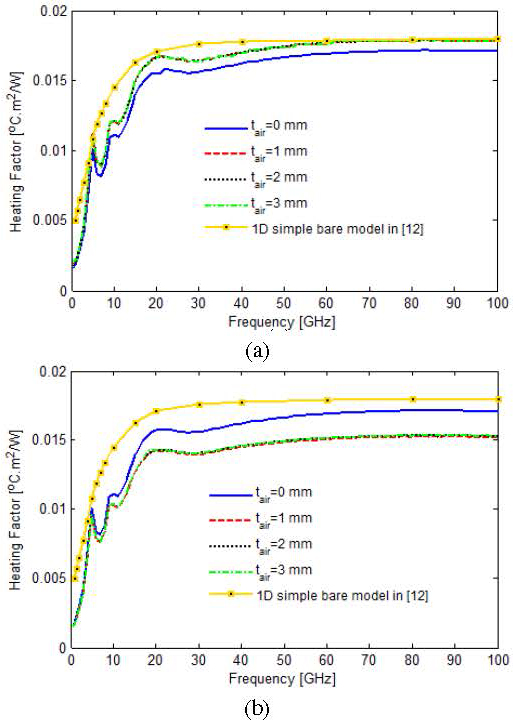
Figure 8: Heating factors of 1D models with 1 mm thick (a) cotton and (b) wool fabrics when t 0, 1, 2, 3 mm.
The peak values of local SAR over the frequency band are shown in Fig. 9 for clothed 1D multi-layered model with different thickness of air gap. The local SAR values in Fig. 9 are significantly affected by the type of fabric and the presence of an air gap and its thickness. Above 20 GHz, the cotton fabric causes larger fluctuations for local SAR values than wool fabric. It can be realized from Fig. 9, the air gap between fabrics and skin tissue acts as an impedance matching layer.
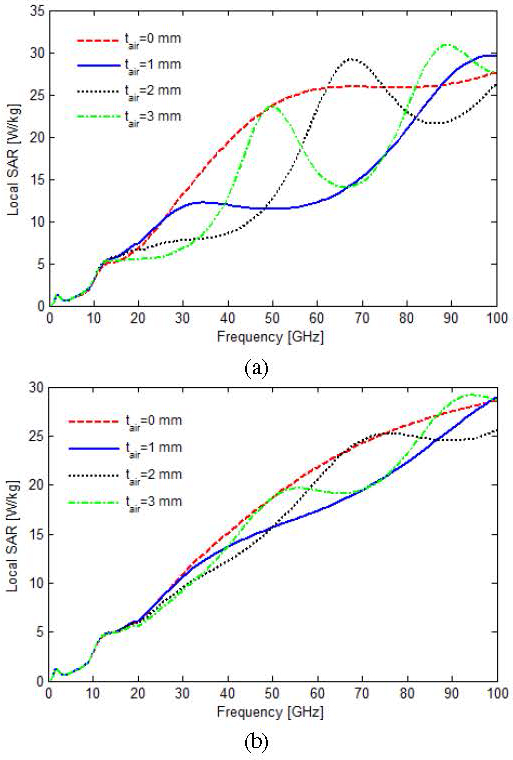
Figure 9: Peak local SAR of 1D model clothed with 1 mm thick (a) cotton and (b) wool when t 0, 1, 2, 3 mm.
IV. CONCLUSION
EM field exposure of 1D multi-layered head models clothed with cotton and wool fabrics is investigated using the FDTD method with Debye model in the frequency range from 1-100 GHz. The impact of the thickness of cotton and wool fabrics on EM field exposure metrics is analyzed up to 100 GHz. In addition, it is investigated how the presence of an air gap with different thickness between the fabric and the skin surface could affect power transmission to the skin surface, APD, and heating factor. Numerical results show that the presence of fabrics and air gap introduced between the fabric and the skin surface significantly affects power transmission to the skin surface, APD, and heating factor. Power transmission to the skin surface strictly depends on the thickness of the fabric and the air gap, resulting in decreased and increased EM power deposition in thetissues.
REFERENCES
[1] M. Zhadobov, N. Chahat, R. Sauleau, C. L. Quement, and Y. L. Drean, “Millimeter-wave interactions with the human body: State of knowledge and recent advances,” Int. J. Microw. Wireless Technol., vol. 3, no. 2, pp. 237-247, Mar. 2011.
[2] G. Sacco, D. Nikolayev, R. Sauleau, and M. Zhadobov, “Antenna/human body coupling in 5G millimeter-wave bands: Do age and clothing matter?” IEEE Journal of Microwaves, vol. 1, no. 2, pp. 593-600, Apr. 2021.
[3] T. S. Rappaport, S. Sun, R. Mayzus, H. Zhao, Y. Azar, K. Wang, G. N. Wong, J. K. Schulz, M. Samimi, and F. Gutierrez, “Millimeter wave mobile communications for 5G cellular: It will work!” IEEE Access, vol. 1, pp. 335-349, 2013.
[4] W. Hong, Z. H. Jiang, C. Yu, D. Hou, H. Wang, C. Guo, Y. Hu, L. Kuai, Y. Yu, Z. Jiang, Z. Chen, J. Chen, Z. Yu, J. Zhai, N. Zhang, L. Tian, F. Wu, G. Yang, Z.-C. Hao, and J. Y. Zhou, “The role of millimeter-wave technologies in 5G/6G wireless communications,” IEEE Journal of Microwaves, vol. 1, no. 1, pp. 101-122, Jan. 2021.
[5] International Commission on Non-Ionizing Radiation Protection, “Guidelines for limiting exposure to electromagnetic fields (100 kHz to 300 GHz),” Health Phys., vol. 118, no. 5, pp. 483-524, May 2020.
[6] IEEE Standard for Safety Levels with Respect to Human Exposure to Electric, Magnetic and Electromagnetic Fields, 0 Hz to 300 GHz, Standard C95.1-2019, 2019.
[7] A. Hirata and O. Fujiwara, “The correlation between mass averaged SAR and temperature elevation in the human head model exposed to RF near-fields from 1 to 6 GHz,” Phys. Med. Biol., vol. 54, no. 23, pp. 7227-7238, Dec. 2009.
[8] R. L. McIntosh and V. Anderson, “SAR versus VAR, and the size and shape that provide the most appropriate RF exposure metric in the range of 0.5-6 GHz,” Bioelectromagnetics, vol. 32, no. 4, pp. 312-321, May 2011.
[9] A. Hirata, I. Laakso, T. Oizumi, R. Hanatani, K. H. Chan, and J. Wiart, “The relationship between specific absorption rate and temperature elevation in anatomically based human body models for plane wave exposure from 30 MHz to 6 GHz,” Phys. Med. Biol., vol. 58, no. 4, pp. 903-921, 2013.
[10] F. Kaburcuk and A. Z. Elsherbeni, “Temperature rise and SAR distribution at wide range of frequencies in a human head due to an antenna radiation,” Applied Computational Electromagnetics Society (ACES) Journal, vol. 33, no. 4, pp. 367-372, Apr. 2018.
[11] F. Kaburcuk, A. Z. Elsherbeni, R. Lumnitzer, and A. Tanner, “Electromagnetic waves interaction with a human head model for frequencies up to 100 GHz”, Applied Computational Electromagnetics Society (ACES) Journal, vol. 35, no. 6, pp. 613-621, June 2020.
[12] D. Funahashi, A. Hirata, S. Kodera, and K. R. Foster, “Area-averaged transmitted power density at skin surface as metric to estimate surface temperature elevation,” in IEEE Access, vol. 6, pp. 77665-77674, 2018.
[13] K. Sasaki, M. Mizuno, K. Wake, and S. Watanabe, “Monte Carlo simulations of skin exposure to electromagnetic field from 10 GHz to 1 THz,” Phys. Med. Biol., vol. 62, no. 17, pp. 6993-7010, 2017.
[14] F. Gustrau and A. Bahr, “W-band investigation of material parameters, SAR distribution, and thermal response in human tissue,” IEEE Trans. Microwave Theory Tech., vol. 50, no. 10, pp. 2393-2400, Oct. 2002.
[15] I. Laakso, “Assessment of the computational uncertainty of temperature rise and SAR in the eyes and brain under far-field exposure from 1 to 10 GHz,” Physics in Medicine and Biology, vol. 54, pp. 3393-3404, 2009.
[16] R. Morimoto, I. Laakso, V. De Santis, and A. Hirata, “Relationship between peak spatial averaged specific absorption rate and peak temperature elevation in human head in frequency range of 1-30 GHz,” Phys. Med. Biol., vol. 61, pp. 5406-5425, 2016.
[17] R. Morimoto, A. Hirata, I. Laakso, M. C. Ziskin, and K. R. Foster, “Time constants for temperature elevation in human models exposed to dipole antennas and beams in the frequency range from 1 to 30 GHz,” Phys. Med. Biol., vol. 62, pp. 1676-1699, 2017.
[18] Y. Hashimoto, A. Hirata, R. Morimoto, S. Aonuma, I. Laakso, K. Jokela, and K. R. Foster, “On the averaging area for incident power density for human exposure limits at frequencies over 6 GHz,” Phys. Med. Biol., vol. 62, no. 8, pp. 3124-3138, Mar. 2017.
[19] O. P. Gandhi and A. Riazi, “Absorption of millimeter waves by human beings and its biological implications,” IEEE Transactions on Microwave Theory and Techniques, vol. 34, no. 2, pp. 228-235, Feb. 1986.
[20] G. Sacco, S. Pisa, and M. Zhadobov, “Impact of textile on electromagnetic power and heating in near-surface tissues at 26 GHz and 60 GHz,” IEEE Journal of Electromagnetics, RF and Microwaves in Medicine and Biology, vol. 5, no. 3, pp. 262-268, Sep. 2021.
[21] A. R. Guraliuc, M. Zhadobov, G. Valerio, N. Chahat, and R. Sauleau, “Effect of textile on the propagation along the body at 60 GHz,” IEEE Transactions on Antennas and Propagation, vol. 62, no. 3, pp. 1489-1494, Mar. 2014.
[22] K. Li and K. Sasaki, “Monte Carlo simulation of clothed skin exposure to electromagnetic field with oblique incidence angles at 60 GHz,” Front. Public Health, vol. 10, no. 795414, 2022.
[23] K. Li, K. Sasaki, G. Sacco, and M. Zhadobov, “Clothing effect on multilayered skin model exposure from 20 GHz to 100 GHz,” IEEE Journal of Electromagnetics, RF and Microwaves in Medicine and Biology, vol. 7, no. 4, pp. 408-415, Dec. 2023.
[24] T. Nagaoka, S. Watanabe, K. Sakurai, E. Kunieda, S. Watanabe, M. Taki, and Y. Yamanaka, “Development of realistic high-resolution whole-body voxel models of Japanese adult males and females of average height and weight, and application of models to radio-frequency electromagnetic-field dosimetry,” Phys. Med. Biol., vol. 49, no. 1, pp. 1-15, Jan. 2004.
[25] M. M. Okoniewski, M. P. Mrozowski, and M. A. Stuchly, “Simple treatment of multi-term dispersion in FDTD,” IEEE Microwave and Guided Wave Letters, vol. 7, no. 5, pp. 121-123, 1997.
[26] A. Z. Elsherbeni and V. Demir, The Finite-Difference Time-Domain Method for Electromagnetics with MATLAB Simulations, 2nd ed. Edison, NJ: SciTech Publishing, 2016.
[27] R. S. Lumnitzer, “Energy harvesting near the human body using finite-difference time-domain simulations,” dissertation, Colorado School of Mines, 2023.
[28] M. A. Eleiwa and A. Z. Elsherbeni, “Debye constants for biological tissues from 30 Hz to 20 GHz,” Applied Computational Electromagnetics Society (ACES) Journal, vol. 18, no. 3, Nov. 2001.
[29] S. Kodera, K. Taguchi, Y. Diao, T. Kashiwa, and A. Hirata, “Computation of whole-body average SAR in realistic human models from 1 to 100 GHz,” IEEE Transactions on Microwave Theory and Techniques, vol. 72, no. 1, pp. 91-100, Jan. 2024.
[30] N. O. Sadiku Matthew, Elements of Electromagnetics. Oxford: Oxford University Press, 2007.
[31] H. H. Pennes, “Analysis of tissue and arterial blood temperature in resting forearm,” J. Appl. Physiol., vol. 1, pp. 93-122, 1948.
[32] S. He, D. Huang, Z. Qi, H. Yang, Y. Hu, and H. Zhang, “The effect of air gap thickness on heat transfer in firefighters’ protective clothing under conditions of short exposure to heat,” Heat Transfer Research, vol. 43, no. 8, pp. 749-765, 2012.
[33] G. Song, S. Mandal, and M. Rossi, Thermal Protective Clothing for Firefighters. Cambridge: Woodhead Publishing, 2016.
[34] A. Hirata, O. Fujiwara, and T. Shiozawa, “Correlation between peak spatial-average SAR and temperature increase due to antennas attached to human trunk,” IEEE Trans. Biomed. Eng., vol. 53, no. 8, pp. 1658-1664, 2006.
BIOGRAPHIES

Fatih Kaburcuk received both the M.Sc. and Ph.D. degrees from Syracuse University, Syracuse, NY, USA, in 2011 and 2014, respectively, in electrical engineering. During his graduate studies, he worked as a Research Assistant with Syracuse University and PPC-Belden Inc. in Liverpool, NY, USA. He worked as a Visiting Research Scholar at the Department of Electrical Engineering, Colorado School of Mines, Golden, CO, USA, in 2014. He joined the Erzurum Technical University and Sivas Cumhuriyet University in 2015 and 2019, respectively. Dr. Kaburcuk is currently an Associate Professor in the Department of Electrical and Electronics Engineering at Sivas University of Science and Technology, Sivas, Turkiye. He is the Associated Editor for Applied Computational Electromagnetics Society (ACES) Journal. His research interests include numerical methods in electromagnetics, biological effect of electromagnetic radiation, and finite-difference time-domain analysis of antennas and RF devices.
ACES JOURNAL, Vol. 39, No. 8, 733–741
doi: 10.13052/2024.ACES.J.390909
© 2024 River Publishers