Analysis and Research on the Construction Stage of Suspension Bridge Steel Towers Using Midas Civil and ANSYS
Haodong Wang, Liu Jie, Fan Ji, Yongkai Zhou, and Liu Liang
1Technical Center
Sichuan Road and Bridge East China Construction Co. Ltd.,
Chengdu, Sichuan Province 610000, China
657103053@qq.com, 281622164@qq.com, 121083920@qq.com
2Technical Center
Sichuan Highway and Bridge Construction Group Co. Ltd.,
Bridge Engineering Branch, Chengdu, Sichuan Province 610000, China
852772307@qq.com, 417232337@qq.com
Submitted On: September 12, 2024; Accepted On: June 11, 2025
ABSTRACT
Scholars have conducted extensive research on the anchoring methods and cable systems of suspension bridges, but there is relatively less research on the analysis of steel tower construction stages. As an important supporting part of the entire bridge, the stability of steel towers during installation directly affects the safety assurance during construction. In order to comprehensively understand the dynamic characteristics of steel towers during the construction stage, this paper presents a comprehensive analysis of the construction process of steel towers in large-span suspension bridges, focusing on the roles of active and cross braces in maintaining structural stability. Utilizing advanced finite element modelling techniques in both Midas Civil and ANSYS, the study evaluates the deformation and stress responses of the steel tower under various loading conditions, including self-weight and wind loads. The findings reveal critical insights into the maximum deformation behaviors and stress distributions at different construction stages, underscoring the importance of jacking operations and the strategic installation of braces. By comparing the performance of structures with and without these braces, the research demonstrates their essential role in enhancing the overall stability and safety of the tower during construction. Furthermore, considering the influence of wind loads and crane loads on the structure in Midas Civil, the paper analyzes the changes in structural strength and stiffness, providing useful references and guidance for this project and similar engineering endeavors.
Index Terms: Construction stage, Midas Civil and ANSYS, steel towers, suspension bridge.
I. INTRODUCTION
As an important form of bridge structure, suspension bridges play a crucial role in modern transportation infrastructure. Their unique structural advantages provide reliable solutions for spanning natural obstacles, such as rivers and valleys. During the construction process of suspension bridges, the installation and control of bridge towers are critical stages. The steel tower, as an integral supporting part of the entire bridge, directly influences the safety and lifespan of the bridge. Scholars’ research on suspension bridges tends to focus more on performance design, anchoring methods, and construction techniques. For instance, in the 1990s, countries such as the United States and European nations transitioned from safety factor methods to partial coefficient limit state methods in bridge design [1, 2]. Xiong et al. [3] based their work on load resistance and statistical characteristics of key design parameters to construct reliability-based limit state design equations for gravity-type anchorages in suspension bridges. Zhao et al. [4] conducted a numerical analysis of the entire bridge, including local anchorages, to investigate the safety factors of anchorages against sliding. A method was proposed for analyzing the construction process as a whole of a steel box girder ground-anchored suspension bridge using the finite element software Midas Civil [5]. The utilization of Midas Civil to establish a spatial finite element model of bridge towers, calculating and analyzing parameters such as pre-elevation, anti-push stiffness, anti-twist stiffness, and allowable deviation under three construction conditions — bare towers, suspended cables, and completed bridges — is employed [6]. The finite element software MIDAS/Civil was used to simulate and analyze the asynchronous construction method of “tower-first, beam-later” during the construction phase [7]. Newton’s Law was used to establish vibration control equations for main cable parameters, and studying the nonlinear parameter vibration issues during suspension bridge construction was also utilized [8]. Zhu et al. [9] employed MIDAS/Civil to establish a spatial analysis model for a suspension bridge during operation and utilized ANSYS to construct a solid finite element model for the concrete tower pylons for local analysis.
Although many countries worldwide have successfully constructed numerous large-span suspension bridges, deficiencies still exist in design theories and industry standards, especially in research on the analysis of steel tower construction stages[10]. Our proposed work integrates artificial neural networks, electro-thermal inverter models, and finite element analysis, as demonstrated by Deevi, to enhance real-time thermal and structural analysis of steel towers during staged construction [11]. Incorporating intelligent FEA modelling enhances simulation fidelity, safety, and efficiency throughout the construction process. Kodadi employed cloud-based seismic management systems in machine learning and wavelet analysis for rapid data processing and accurate earthquake prediction [12]. Inspired by their cloud-based seismic management system, our research integrates the deployment of Midas Civil and ANSYS on a cloud-based high-performance computing (HPC) platform that facilitates real-time, large-scale structural and electromagnetic simulations. Cloud computing strategies, including load balancing, auto-scaling, and resource optimization, were presented by Dharma [13]. Our framework incorporates their Cloud computing strategies into our study to dynamically manage simulation workloads and maintain system stability through real-time monitoring, resulting in faster, cost-effective, and energy-efficient multiphysics simulations. Therefore, to comprehensively understand the stress and deformation states of steel towers during the construction stage, this paper, based on a specific Yangtze River bridge, utilizes Midas Civil for finite element analysis. The effectiveness of the analysis model is validated by comparing its results with those from the ANSYS finite element software. Furthermore, the construction stage analysis considers wind loads and crane working loads to investigate their effects on the stress and deformation of steel towers. The sensitivity of steel towers to various loads at different stages is analyzed, and the structural strength, stiffness, and overall stability are verified during the construction phase. The stress and deformation effects of various components in the main tower under different construction stages are also analyzed in detail, providing an important reference for subsequent construction activities.
This paper examines the construction stages of steel towers in large-span suspension bridges, with a focus on the impact of varying loading conditions on structural stability. It uses advanced finite element modelling techniques in Midas Civil and ANSYS to understand how active and cross braces affect deformation and stress distribution. The research provides a detailed examination of steel tower dynamics, emphasizing the importance of active braces for stability. It introduces innovative modelling approaches that incorporate variable cross-section designs, enhancing the reliability of the analysis. A comparative analysis between Midas Civil and ANSYS validates the effectiveness of simplified modelling techniques and offers insights into steel tower performance under various construction scenarios. The findings provide recommendations for engineering practices that improve safety and reliability in suspension bridge tower construction. This paper fills a significant gap in bridge engineering literature by focusing on steel tower construction.
This paper is organized as follows. Section II highlights key findings and gaps in current research. Section III presents the methodology used in this study, including a brief description of Midas Civil and ANSYS finite element model. Section IV presents the analysis of structural effects under different loads along with the analysis of calculation results under tower crane load. Finally, section V summarizes the key findings, conclusions, and recommendations.
II. PROJECT OVERVIEW
This article is based on the Zhangjinggao Yangtze River Bridge project. The bridge is located in the lower reaches of the Yangtze River, in the Chengtong section of the Sa Group in Rugao, China. The span of the bridge is 7,859 meters, with two main navigation bridges and three approach bridges (south, central, and north). The South Navigation Bridge, spanning 2,300 meters, is currently the world’s largest span suspension bridge under construction. The precision requirements, deformation control, and automation welding rate for fabricating the Zhangjinggao Yangtze River Bridge steel towers are high. The vertical deviation of each segment must be controlled within 5 millimeters, and the planar deviation must be controlled within 2 millimeters. The north navigation bridge spans the Hanfu North Waterway in Rugao and features a main span of 1,208 meters, making it a single-span cable-stayed bridge. This article focuses on the analysis of the South Main Tower of the North Navigation Bridge. The south anchor tower adopts a gantry structure steel tower with a total height of 217 meters (including the tower crown). The tower crown is 9 meters high, with a height of 58.1 meters for the crossbeam and below and 149.9 meters above the crossbeam. The elevation of the tower crown is 224.000 meters, the elevation of the tower top (excluding the crown) is 215.00 meters, and the elevation at the center of the tower bottom is 7.00 meters. Two crossbeams are set on the tower column, as shown in Fig. 1.
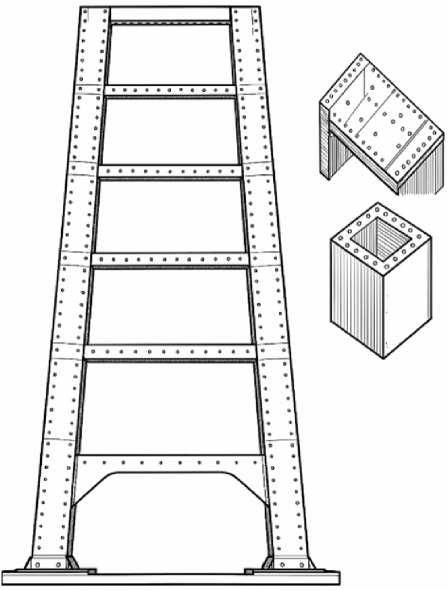
Figure 1: Schematic diagram of the south tower of the North Channel Bridge.
Table 1: Main construction steps
| Working Conditions | Construction Steps |
| 1 | Install T0-T7 segments |
| 2 | Install the lower beam bracket and push up the tower column |
| 3 | Locking jack and lower beam bracket: |
| 4-5 | Install lower beam segments 1-3 in sequence |
| 6 | Install the lower beam closing section and unlock it |
| 7 | Install sections T8-T11 and the first attachment of the tower crane |
| 8-9 | Install active cross brace 1 and push tower column |
| 10 | Locking jack and active cross brace 1, install segments T12-T14 |
| 11-12 | Install active cross brace 2 and push the tower column |
| 13 | Locking jack and active cross brace 2 |
| 14 | Install sections T15-T17 and install the remaining tower crane |
| 15-16 | Install active cross brace 3 and push the tower column |
| 17-18 | Locking jack and active cross brace 3, install segments T18-T22 |
| 19-20 | Install the upper beam bracket and push up the tower column |
| 21-23 | Install the lower beam sections 1-3 to the closing section in sequence and unlock them |
| 24 | Remove the upper beam bracket and active cross brace |
III. FINITE ELEMENT MODEL VERIFICATION
A. Midas Civil finite element model
Midas Civil software is widely used in the engineering industry due to its high integration of functions and ease of modelling. In this paper, Midas Civil is employed for construction stage analysis. Due to the inherent inclination of the steel tower and the variable cross-section of each segment, the SPC section property calculator is used to import the steel tower sections, and the model is simulated using beam elements. The entire tower consists of 2,019 nodes and 3,563 components. The steel tower and crane base are fixed with constraints at the bottom. The active braces, upper beam supports, and lower beam supports are connected to the steel tower with varying degrees of freedom in elastic connections, depending on the construction stage. Temperature loads are used to simulate the jacking force of the jacks. The weight of each steel component is predicted based on its dimensions and the type of steel used, and its impact on the structure is considered throughout the entire construction plan[11]. Therefore, adjustments to the unit weight of each segment are made to match the design requirements.
During the gradual installation of bridge pier segments, they undergo gradual deformation due to their weight and other factors. Since the steel towers are installed during periods of relatively constant temperature and low wind speeds, during the comparative analysis stage, only the self-weight of the structure is considered, while factors such as wind loads and temperature loads are ignored. The primary objective of this analysis is to determine the overall deformation, stress, and the required jacking force for each brace of the steel tower, thereby facilitating comparison with the ANSYS finite element model to validate the effectiveness of this simplified model. Additionally, the calculation results are used to determine the most critical state of the structure during construction. The main construction stages and corresponding finite element models are shown in Table 1 and Figure 2.
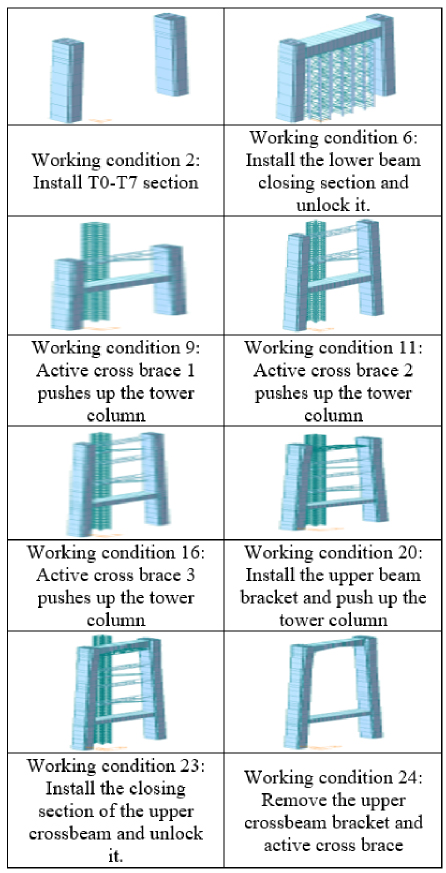
Figure 2: Schematic diagram of the construction stage model.
B. ANSYS finite element model
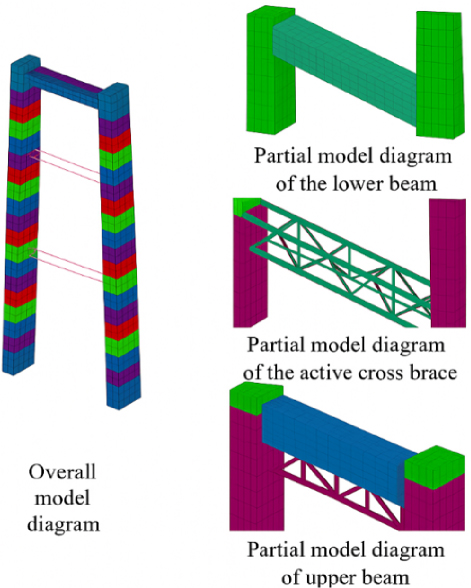
Figure 3: Schematic diagram of ANSYS finite element model.
This paper utilizes large-scale finite element general-purpose computational software, ANSYS, for detailed modelling and analysis, aiming to compare and validate the effectiveness of the simplified model in Midas Civil. Each segment of the steel tower in the literature is modelled using the shell element SHELL181, while the lower beam of the steel tower, three active braces, and upper beam supports are modelled using the beam element BEAM189. Additionally, shell element SHELL181 is used to simulate the external steel shell, vertical partitions, vertical ribs, and local joints of each segment of the steel tower, strictly following the design thickness specified in the drawings.
In the construction stage analysis, ANSYS functionality allows for the simulation of the construction process through techniques such as “killing” and “activating” elements, which are particularly suitable for simulating the step-by-step establishment of structures[12]. When elements are “killed” in the ANSYS program, their stiffness matrix is multiplied by a very small coefficient, typically defaulting to 1e-6. The results of the solution will not include the mass and energy of “dead” elements. The stiffness, mass, and load parameters return to their real state upon reactivation. After elements are “reactivated,” there is no history of strain, and they are “annealed” through the process of being both dead and alive, where all stresses and strains are zero when they are alive. The ANSYS finite element model is shown in Fig. 3
Meanwhile, during the construction stage simulation process, the deflection deformation of the tower body mainly originates from its weight. Therefore, it is necessary to compare and verify the weight of each segment of the steel tower calculated from the model with the weights specified in the design drawings. This ensures the accurate application of the steel tower’s self-weight load and verifies the accuracy of the model establishment through mass differences. This is summarized in Table 2.
| Segment Number | Model Weight (t) | Design Weight (t) | Error (%) |
| 1 | 225.7 | 264.8 | 14.7 |
| 2 | 202.3 | 232.6 | 13 |
| 3 | 202 | 232.3 | 13 |
| 4 | 201.7 | 231.9 | 13 |
| 5 | 201.4 | 232 | 13.2 |
| 6 | 217.4 | 262 | 17 |
| 7 | 209.3 | 253 | 17.3 |
| 8 | 217.6 | 262.9 | 17.2 |
| 9 | 200.3 | 230 | 12.9 |
| 10 | 200.1 | 229.7 | 12.9 |
| 11 | 207.7 | 237.2 | 12.4 |
| 12 | 239.9 | 280 | 14.3 |
| 13 | 239.2 | 278.4 | 14.1 |
| 14 | 238.6 | 277.7 | 14.1 |
| 15 | 238.3 | 277.1 | 14 |
| 16 | 238 | 276.5 | 13.9 |
| 17 | 237.4 | 275.9 | 13.9 |
| 18 | 236.9 | 275.3 | 13.9 |
| 19 | 225.6 | 270.1 | 16.5 |
| 20 | 238 | 288.5 | 17.5 |
| 21 | 225.7 | 279.6 | 19.3 |
| 22 | 311.4 | 332.3 | 6.3 |
C. Comparison of finite element calculation results
During the construction process of the main tower, three temporary active braces are set up to support the toppling, located at the top push rods of the lower beam supports at 97.95 m (section T11), 131.341 m (section T14), and 164.932 m (section T17), as well as the top push rods of the upper beam supports. The top push force, top push displacement, and vertex displacement of each brace are shown in Table 3. Table 3 shows the largest differences in top push displacement and deformation between the two models in stages 2 and 3 of the active braces. However, the calculation results for the lower beam supports, upper beam supports, and vertex displacement are relatively consistent [13]. Overall, using Midas Civil for construction stage analysis proves to be effective.
Table 3: Thrust force and displacement comparison between Midas and ANSYS models
| Location | Midas Thrust Force (t) | Midas Displacement (mm) | ANSYS Thrust Force (t) | ANSYS Displacement (mm) |
| Lower cross-member bracket | 23 | 2 | 20 | 2.17 |
| Active cross brace 1 | 62 | 4.74 | 66 | 5.87 |
| Active cross brace 2 | 26 | 3.26 | 34 | 4.98 |
| Active cross brace 3 | 18 | 2.14 | 22 | 3.38 |
| Upper beam bracket | 29 | 5.56 | 39 | 7.21 |
| Vertex displacement | 453 | 398 |
IV. ANALYSIS OF STRUCTURAL EFFECTS UNDER DIFFERENT LOADS
A. Analysis of calculation results under self-weight state
1. Main tower strength and stiffness
The maximum stress and lateral deformation variations of the steel tower during the construction stage are depicted in Fig. 4. Figure 4 shows that the maximum combined stress of the steel tower decreases due to the application of the jacking force during tower installation, although the numerical fluctuations are small. However, the stress level shows a gradually increasing trend, indicating overall stability in structural strength. According to the analysis results, the maximum stress in the structure occurs at the base of the steel tower during each construction stage. The minimum stress is reached during the installation of the lower beam supports at 6.4 MPa, while the maximum stress is attained during the closing stage of the upper beam at 21.9 MPa. After removing the active braces and upper beam supports, the stress reaches 21.8 MPa. This analysis highlights the crucial role of jacking operations in maintaining structural stability and underscores the importance of monitoring and adjusting the jacking force[14].
Due to the structure’s inclination, there is a tendency for the steel tower to lean inward during installation, which is a result of its weight. Therefore, this analysis focuses more on lateral deformation behavior. The maximum deformation of the steel tower occurs after the upper beam supports are installed, reaching 5.984 mm. The structure returns to its design shape under the influence of various jacking forces before installing the next section, with deformation reduced to 0.54 mm after removing the upper beam supports and active braces. According to the analysis results, the maximum deformation occurs at the top of the steel tower in each construction stage.
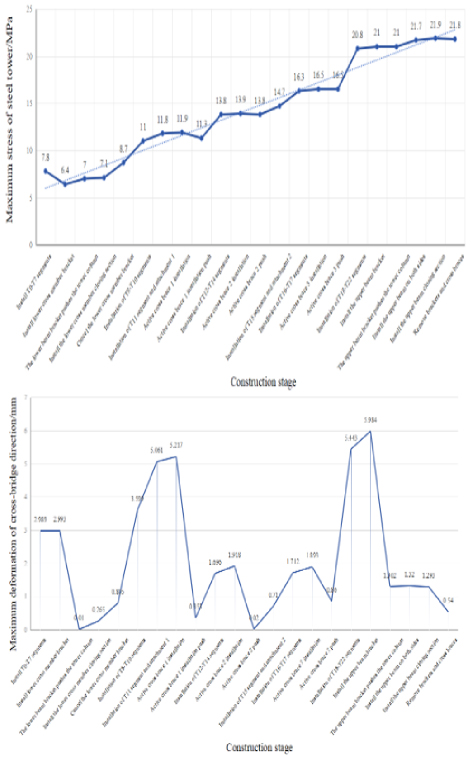
Figure 4: Maximum stress and deformation development curve of the main tower during (unit: MPa).
2. Active cross brace strength and stiffness
The actual development of the maximum lateral deformation of the steel tower during the construction stage is illustrated in Fig. 5. Due to the structure’s inclination, there is a tendency for the steel tower to lean inward during installation, which is a result of its weight. Therefore, this analysis focuses more on lateral deformation behavior. Figure 5 shows that the maximum deformation of the steel tower occurs after the installation of the upper beam supports, reaching 5.984 mm. Under various jacking forces, the structure returns to its design shape before installing the next section, with deformation reduced to 0.54 mm after removing the upper beam supports and active braces. According to the analysis results, the maximum deformation occurs at the top of the steel tower in each construction stage. Additionally, before installing the second active brace, the third active brace, and the upper beam supports, the structure is in a state of the maximum cantilever, with its stiffness at the lowest point, thus being in the most unfavorable condition.
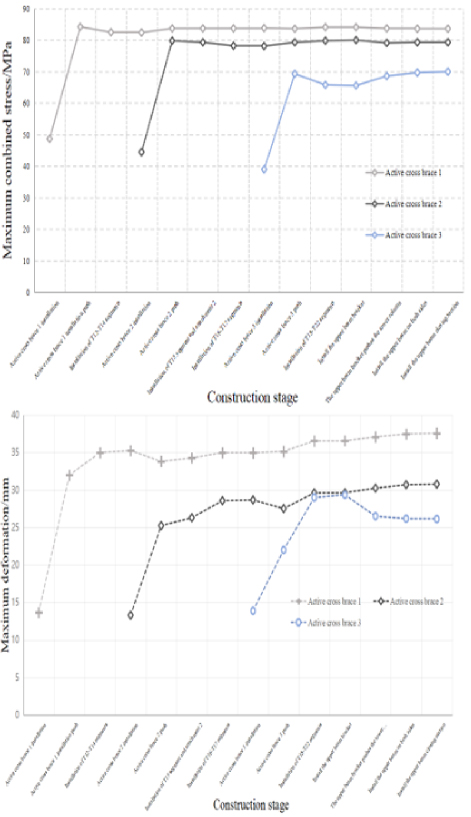
Figure 5: Maximum stress and deformation development curve during the construction stage (unit: MPa).
B. Analysis of calculation results under wind load
Due to geographical factors, the steel tower may be subjected to strong winds when not under construction. A wind tunnel test was conducted on self-supporting bridge tower models to determine response patterns under various wind speeds and angles of attack [15]. A formula for estimating permissible oscillation amplitudes of bridge tower bending vortex-induced resonance based on tower height parameters was summarized by [16, 19]. The significant impact of wind angle of attack and average wind speed on the flutter response of self-supporting bridge towers, using a multi-channel coupled vibration frequency calculation method, was emphasized by [17, 20].
This paper analyses the stress under three maximum cantilever conditions based on the calculation results under self-weight conditions. The wind loads on both sides of the steel tower are considered to simultaneously bear the maximum wind loads in the longitudinal and transverse directions. Here, wind loads are not applied to the active braces, and the analysis examines the degree to which the steel tower is affected by wind loads on the active braces. The tower crane considers the loads on the crane head and wind loads on the tower body under non-working conditions, taking into account loading directions in the longitudinal, transverse, and attachment directions. According to the design wind resistance standards for cable-stayed towers, the return period for wind speed during construction is 30 years.
According to the “Code for Design of Highway Bridges for Wind Resistance” [18, 21], the bridge falls under the R2 region, with a ground category of A. Located in Nantong, the wind speed is U10 28.5 m/s. For calculations, the heights Z of active braces 1, 2, and 3 are 94.95 m, 128.538 m, and 161.932 m, respectively. The wind load on the steel tower is then calculated based on height variation from the tower base to the top. The wind load calculation formula is as follows:
| (1) | ||
| (2) | ||
| (3) | ||
| (4) | ||
| (5) | ||
| (6) |
where U10 represents the basic wind speed; is the terrain conversion coefficient, taken as 1.174; represents the design basic wind speed, taken as the maximum of the two; is the wind risk coefficient, taken as 1.02; represents the terrain condition coefficient, taken as 1; is the wind pressure height correction coefficient, taken by linear interpolation; represents the surface roughness coefficient, taken as 0.12; is the equivalent static coefficient, obtained by linear interpolation; represents air density, taken as 1.25; is the component drag coefficient; represents the projected area of the component.
1. Maximum cantilever state of the first cross brace
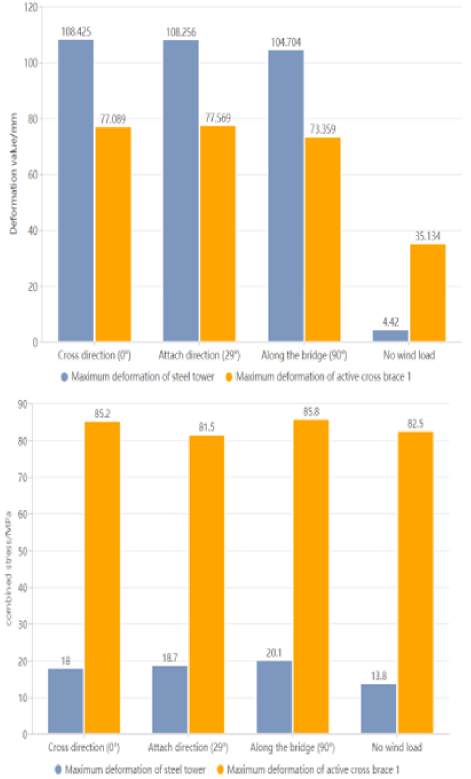
Figure 6: Maximum stress and deformation development curves of wind load in different directions.
Figure 6 shows the maximum total deformation and maximum combined stress of the steel tower and active brace 1 in the first cantilever condition. From Fig. 6, it can be observed that wind loads have a significant impact on the stiffness of the steel tower and active brace 1. Compared to the case without wind loads, the maximum deformation of the steel tower under transverse wind loads reaches 108.425 mm. In contrast, the maximum deformation of the active brace occurs under wind loads in the attachment direction, reaching 77.569 mm. Compared to changes in stiffness, the changes in strength for both the steel tower and active brace 1 are relatively small. Under transverse wind loads, the maximum combined stress in the steel tower reaches 42.1 MPa, while the maximum stress in the active brace occurs in the attachment direction, reaching 86.5 MPa.
2. Maximum cantilever state of the second cross brace
In the second cantilever condition, the maximum deformation and maximum combined stress of the steel tower, active brace 1, and active brace 2 are shown in Fig. 7.
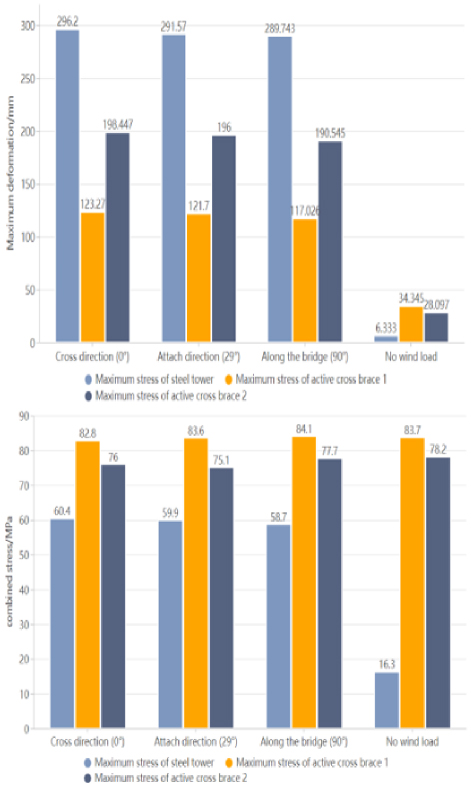
Figure 7: Maximum stress and deformation development curves of wind load in different directions.
Compared to the first cantilever condition, it can be observed from Fig. 7 that as the height of the steel tower increases, the influence of wind loads on the stiffness of the steel tower also increases. Under transverse wind loads, the maximum deformation of the steel tower reaches 296.2 mm, the maximum deformation of active brace 1 is 123.27 mm, and the maximum deformation of active brace 2 is 198.447 mm. Despite changes in stiffness, the structural changes in strength remain relatively small. Under transverse wind loads, the maximum combined stress of the steel tower reaches 60.4 MPa. The maximum stress of active brace 1 occurs under wind loads in the attachment direction, reaching 83.6 MPa. The maximum stress of active brace 2 occurs under wind loads in the longitudinal direction, reaching77.7 MPa.
3. Maximum cantilever state of the third cross brace
In the third cantilever condition, the maximum total deformation and maximum combined stress of the steel tower, active brace 1, active brace 2, and active brace 3 are shown in Fig. 8.
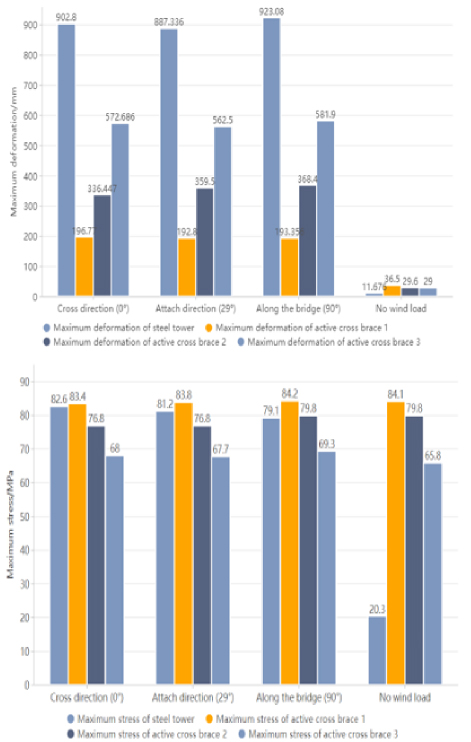
Figure 8: Maximum stress and deformation development curves of wind load in different directions.
From Fig. 8, it can be seen that, due to the longer cantilever length, the influence of wind loads on the stiffness of the steel tower under this condition is more severe. Compared to the previous conditions, under longitudinal wind loads, the maximum deformation of the steel tower reaches 923.08 mm. The maximum deformation of active brace 1 under transverse wind loads is 196.77 mm. The maximum deformation of active brace 2 under longitudinal wind loads is 368.4 mm. The maximum deformation of active brace 3 reaches 581.9 mm. Despite changes in stiffness, the overall structural changes in strength remain relatively small. Under transverse wind loads, the maximum combined stress of the steel tower reaches 82.6 MPa; the maximum stress of active brace 1 under longitudinal wind loads reaches 86.5 MPa; and the maximum stresses of active brace 2 and active brace 3 reach 79.8 MPa and 69.3 MPa, respectively. According to the calculation results, the structure’s overall strength and stiffness meet the requirements specified.
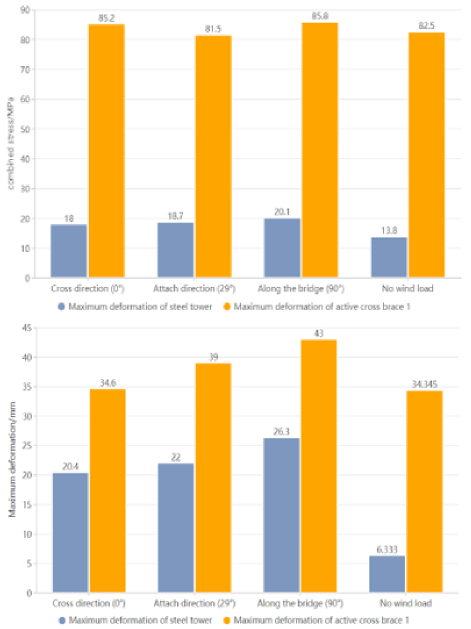
Figure 9: Maximum stress and deformation development curve of tower crane load in different directions.
C. Analysis of calculation results under tower crane load
1. Maximum cantilever state of the first cross brace
During installation of the steel tower, it is necessary to consider the impact of the tower crane load on the structure in different directions. Figure 9 shows the maximum total deformation and maximum combined stress of the steel tower and active brace 1 in the first cantilever condition. Figure 9 shows that, compared to wind loads, the influence of the tower crane load on the strength and stiffness of the steel tower and active brace 1 is relatively small. Under longitudinal tower crane load, the maximum stress of the steel tower reaches 20.1 MPa with a deformation of 26.3 mm, while active brace 1 reaches 85.8 MPa with a deformation of 43 mm.
2. Maximum cantilever state of the second cross brace
Figure 10 shows the maximum total deformation and maximum combined stress of the steel tower, active brace 1, and active brace 2 in the second cantilever condition. From Fig. 10, it can be observed that, under the longitudinal tower crane load, the maximum stress in the steel tower reaches 21.4 MPa, accompanied by a maximum deformation of 64.6 mm in the attachment direction. Active brace 1 reaches a maximum stress of 85.4 MPa under both longitudinal and transverse tower crane loads, with a maximum deformation of 41 mm in the longitudinal direction. Active brace 2 reaches a maximum stress of 84.1 MPa under transverse tower crane load, with a maximum deformation of 53 mm in the longitudinal direction.
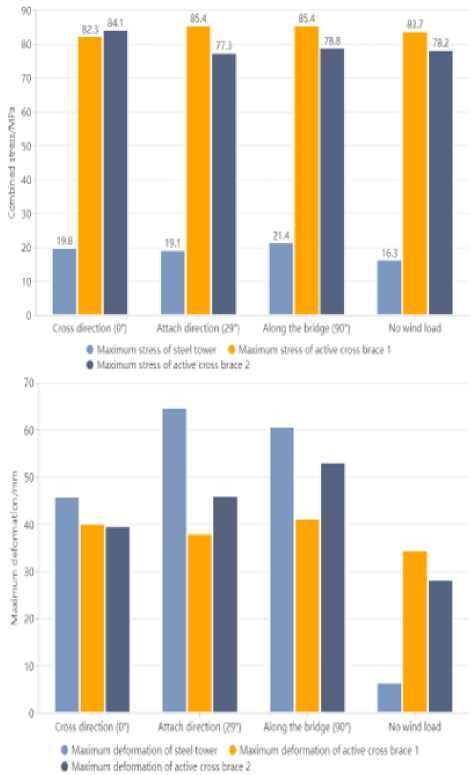
Figure 10: Maximum stress and deformation development curve of tower crane load in different directions.
3. Maximum cantilever state of the third cross brace
In the third cantilever condition, the maximum total deformation and maximum combined stress of the steel tower, active brace 1, active brace 2, and active brace 3 are shown in Fig. 11. From Fig. 11, it can be observed that, under the longitudinal tower crane load, the maximum stress in the steel tower reaches 26.1 MPa, accompanied by a maximum deformation of 98 mm in the attachment direction. Active brace 1 reaches a maximum stress of 85.4 MPa with a maximum deformation of 43 mm in the longitudinal direction. Active brace 2 reaches a maximum stress of 82.5 MPa under transverse tower crane load, with a maximum deformation of 54 mm in the longitudinal direction. Active brace 3 reaches a maximum stress of 69.1 MPa under a transverse tower crane load, with a maximum deformation of 71 mm in the longitudinal direction.
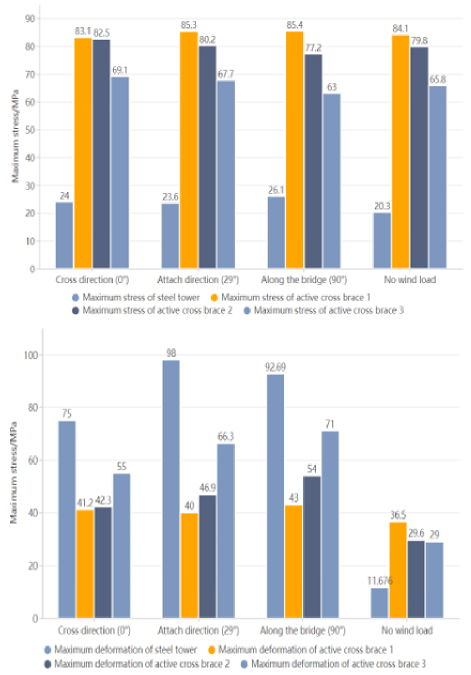
Figure 11: Maximum stress and deformation development curve of tower crane load in different directions.
V. CONCLUSION
This research examines two finite element modelling methods, Midas Civil and ANSYS, employed in assessing steel towers throughout the construction phases of suspension bridges. The results show that each software tool has unique but supportive functions in structural analysis. Midas Civil is especially useful for initial evaluations because of its intuitive interface and effective modelling features. It enables engineers to quickly model construction scenarios and assess the overall performance of the steel tower under various conditions. The results acquired from Midas Civil have been validated through comparison with those from ANSYS, demonstrating its reliability for initial designphases.
ANSYS provides a more detailed and comprehensive analysis, capturing complex interactions and localized impacts that may be vital for preserving structural integrity. Its sophisticated modelling features enable a thorough examination of stress distribution and deformation, rendering it a crucial instrument for ultimate validation and adherence to safety regulations. Nonetheless, it is essential to recognize the constraints of every method. Midas Civil, although efficient, might overlook some complex aspects of structural behavior, which could result in oversimplifications. While ANSYS offers greater accuracy, it requires considerable computational power and expertise, which may not be practical for every engineering team. Overall, integrating Midas Civil and ANSYS in the analysis process enhances understanding of steel tower dynamics during construction. Utilizing Midas Civil for initial assessments, followed by detailed validation with ANSYS, can lead to improved safety, reliability, and efficiency in the design and construction of suspension bridges. This dual approach not only aids in addressing the complexities of steel tower construction but also contributes valuable insights for future engineering practices.
Future research will enhance the analysis of steel towers in suspension bridge construction by implementing advanced modelling techniques, such as nonlinear analysis and dynamic simulations, to better understand their behavior under various loads. It will also develop real-time structural health monitoring systems to validate model predictions and assess performance. The study will be expanded to include comparative analyses of additional finite element software tools and investigate the impact of new materials, such as high-strength steel and composites, on structural performance.
REFERENCES
[1] AASHTO, “AASHTO LRFD Bridge Design Specifications,” 8th ed., AASHTO, Washington, DC, 2017.
[2] T. L. L. Orr, “Selection of characteristic values and partial factors in geotechnical designs to Eurocode 7,” Computers and Geotechnics, vol. 26, no. 3, pp. 263-279, Apr. 2000.
[3] W. Xiong, R. Wang, T. Wang, Y. Liu, and J. Zhang, “Design method for anti-skid safety of gravity anchor of suspension bridges with a span of over 2000 meters,” Chinese Journal of Highways, vol. 37, no. 4, pp. 166-175, Apr. 2024.
[4] X. Q. Zhao, X. N. Gong, and P. P. Guo, “Caisson-bored pile composite anchorage foundation for long-span suspension bridge: Feasibility study and parametric analysis,” Journal of Bridge Engineering, vol. 27, no. 12, p. 04022117, Oct. 2022.
[5] L. Ye, H. Ke, and Z. Chen, “Analysis of the construction stage of steel box main beam ground anchored suspension bridges based on Midas/Civil,” Zhongwai Highway, vol. 40, no. 6, pp. 140-145, 2020.
[6] S. Tan, G. Xiong, and Y. Yang, “Research on monitoring indicators for construction of large span suspension bridge towers,” China Municipal Engineering, no. 3, pp. 55-58, 138, 2022.
[7] C. Lu, W. Wang, and Y. Liao, “Numerical simulation analysis of the construction process of a large-span suspension bridge tower,” Building Structure, vol. 48, no. S2, pp. 959-962, 2018.
[8] J. Lv, H. Kang, and R. Wang, “Nonlinear parametric vibration of the main cable of a suspension bridge under longitudinal action of bridge towers,” J. Hunan Univ. Sci. Technol. (Natural Science Edition), vol. 32, no. 3, pp. 41-46, July 2017.
[9] D. Zhu, X. Luo, and C. Zuo, “Performance analysis of the concrete main tower structure of an in-service suspension bridge based on ANSYS,” Highway and Motor Transport, no. 2, pp. 112-118, 2021.
[10] X. Zhao, W. Zhan, X. Yan, and M. Liu, “Current status and future development prospects of suspension bridge anchorage research,” Journal of Geotechnical Engineering, vol. 43, no. 2, pp. 150-153, 2021.
[11] D. P. Deevi, “Artificial neural network enhanced real-time simulation of electric traction systems incorporating electro-thermal inverter models and FEA,” Int. J. Eng. Sci. Res., vol. 10, no. 3, pp. 36-48, 2020.
[12] S. Kodadi, “High-performance cloud computing and data analysis methods in the development of earthquake emergency command infrastructures,” Journal of Current Science, vol. 10, no. 3, pp. 87-105, 2022.
[13] T. V. Dharma, “Optimizing cloud computing environments for big data processing,” Int. J. Eng. Sci. Res., vol. 13, no. 2, pp. 1756-1775, 2023.
[14] Y. Niu, “Construction technology for positioning and installation of curved section steel towers in self-anchored suspension bridges,” Northern Transportation, no. 2, pp. 11-15, 2023.
[15] L. Sun, Q. Wang, and Y. Zhang, “Design and local stress analysis of steel tower suspension wall for self-anchored suspension bridge,” Highway, vol. 66, no. 1, pp. 171-175, 2021.
[16] X. Qu and C. Qian, “Multi-point constraint (MPC) method and finite element analysis of heat exchangers,” Pressure Vessel, vol. 30, no. 2, pp. 54-58, 2013.
[17] F. Cao, Z. Liu, and H. Huang, “Innovative design of A-shaped bridge tower for single main cable suspension bridge,” Urban Road and Bridge and Flood Control, no. 4, pp. 15, 75-77, 85, 2023.
[18] L. Zeng, R. Ma, and A. Chen, “Experimental study on wind resistance performance of self-supporting tower of large-span suspension bridge,” Hunan Transportation Technology, vol. 49, no. 1, pp. 75-79, 2023.
[19] J. Li, G. Zhang, and B. Zhang, “Determination of allowable amplitude for the vortex-induced resonance of steel bridge towers,” Chinese Journal of Highways, vol. 27, no. 3, pp. 45-50,2014.
[20] J. Li, Z. Shen, S. Xing, and W. Tang, “Buffeting response of a free-standing bridge pylon in a trumpet-shaped mountain pass,” Wind & Structures, vol. 30, no. 1, pp. 85-97, Jan. 2020.
[21] Ministry of Transport of the People’s Republic of China, “Wind Resistant Design Code for Highway Bridges,” JTG/T D60-01-2004, China Communications Press, Beijing, China, 2004.
BIOGRAPHIES

Haodong Wang was born in Dazhou, Sichuan, P.R. China, in 1996. He received his master’s degree from Qinghai University, P.R. China, in 2022. Currently, he works at the Technical Center of Sichuan Road and Bridge East China Construction Co., Ltd. His research interests include road and bridge construction and design, as well as seismic design of structures.

Liu Jie was born in Chengdu, Sichuan Province, China. He obtained his bachelor’s degree in 2009 from Jincheng College, Sichuan University. Currently, he is a project manager at Sichuan Road and Bridge Group. His research focuses on large-scale bridge construction, and he has participated in the construction of several world-class bridges.

Fan Ji was born in Nantong, Jiangsu Province, China, in 1997. He received his master’s degree from Southwest Jiaotong University in 2022. He is currently working at the Technical Center of Sichuan Highway and Bridge Construction Group Co. Ltd., Bridge Engineering Branch. His specialization is in the design and construction of underground railways and mountain tunnels.

Yongkai Zhou was born in Chengdu, Sichuan Province, China. He obtained his bachelor’s degree from Xihua University in 2009. Currently, he works as the Deputy Director at the Technical Center of Sichuan Road and Bridge East China Construction Co., Ltd. His research focuses on large-scale bridge construction and design.

Liu Liang was born in Tianmen City, Hubei Province, China. He obtained his master’s degree from Chang’an University in 2013. Currently, he serves as the Deputy Chief Engineer of the Bridge Engineering Branch at Sichuan Highway and Bridge Construction Group Co. Ltd. His research focuses on bridge engineering construction and management.
ACES JOURNAL, Vol. 40, No. 8, 788–799
doi: 10.13052/2024.ACES.J.400811
© 2025 River Publishers