Optimization of Receiver Optics for Radio Astronomy
Kim Ho Yeap, Mey Chern Loh, Peh Chiong Teh, and Veerendra Dakulagi
1Faculty of Engineering and Green Technology
Universiti Tunku Abdul Rahman, Jalan Universiti, Bandar Barat, 31900 Kampar, Perak. Malaysia
yeapkh@utar.edu.my, mcloh.j@1utar.my, tehpc@utar.edu.my
2Department of Computer Science and Engineering (Data Science)
Guru Nanak Dev Engineering College, Bidar, Mailoor Road, Bidar 585403, Karnataka, India
vdakulagi@gndecb.ac.in
Submitted On: July 12, 2024; Accepted On: December 3, 2024
ABSTRACT
In a radio telescope, the sub-reflector is illuminated by a complex feed system, consisting of a feed horn and a pair of optics focusing elements which are usually a pair of mirrors. Although rigorous analysis of this system can be performed using Method of Moments (MoM) or physical optics (POs), design optimization using these methods may not be viable, since it requires lengthy computational time. In this paper, we describe an efficient optimization technique for the optics design which applies the quadratic on a pedestal distribution to compute the taper and aperture efficiencies. In our method, multimode Gaussian optics is employed to calculate the electromagnetic waves which scatter through the optical system. The edge taper associated with the optimum aperture efficiency is first identified. By setting the parameters of this edge taper and also the distance between mirror 2 and the antenna focus as the iteration targets, a root-searching routine is then applied to determine the distances of the optical paths between the mirrors and the feed. When an optimized feed design is established, the antenna performance indicators, such as the beam efficiency, co- and cross-polarization levels, and aperture efficiencies, are calculated using PO. In this way, we combine the accuracy of the quadratic function in determining the antenna efficiencies and the computational efficiency of Gaussian optics to optimize the design of the system with the rigor of PO to validate the final parameters of the antenna. The design procedure for the Atacama Large Millimeter/Submillimeter Array (ALMA) interferometric radio telescope’s feed optics system is used as an illustrative example. The results show that the co-polar beam efficiencies achieved with the proposed method are higher than those of the original method used for the ALMA feed optics system, while the cross-polar beam efficiencies are lower. This suggests a substantial improvement offered by the newapproach.
I. INTRODUCTION
The latest generation of ground-based radio telescopes are designed to accommodate multiple frequency bands [1]. The receivers for each band are therefore positioned off-axis relative to the parabolic antenna. A typical optics arrangement for an offset radio telescope is shown in Fig. 1. As can be observed from the figure, a pair of mirrors are usually employed to scatter the optical beam from the reflectors to the offsetfeeds.
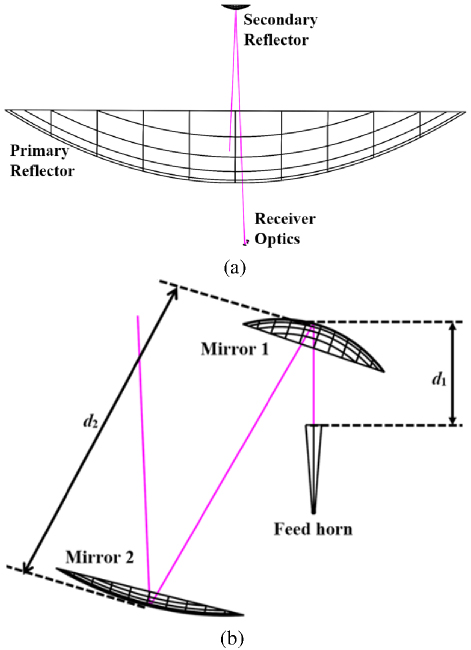
Figure 1: The antenna in a typical radio telescope comprising (a) receiver optics and a main and a sub-reflector. A detailed view of the receiver optics is provided in (b).
Designing these ground-based antennas presents exceptional computational challenge. This is due to the need for precise electromagnetic field calculations in high-performance antenna design. Since the dimensions of the optical elements are many times their operating wavelengths, full wave analysis of the antenna turns out to be laborious [2, 3]. The inclusion of additional focusing elements, such as mirrors, adds more design variables, further complicating the process of optimizing the design.
In [4], we presented a method based on Gaussian beam to determine the optimal variables for designing near frequency-independent receiver optics. The design parameters obtained from this method were adopted in constructing the receiver optics for the Atacama Large Millimeter/Submillimeter Array (ALMA) interferometer [5, 6]. Constituting 66 Cassegrain reflector antennas, ALMA is presently the state-of-the-art millimeter/sub-millimeter interferometer [7]. The telescope focal plane receivers cover 10 frequency bands that extend from 31 GHz to 950 GHz. Measurements carried out by the teams assigned to work on the different bands have validated the performance of the receiver optics and have found that the results were in good satisfaction [8–12]. Since its inception, significant discoveries have been made using ALMA. Recent research highlights include star formations [13–15], galaxies [16, 17], gas disks [18], cosmic rays [19], and supernova remnants [20].
It is to be noted that, the method in [4] adopts Gaussian distribution to compute the antenna efficiencies. In reality, however, the wave patterns scattered from an optimized feed horn resemble closer to that derived from the quadratic on a pedestal distribution, rather than the Gaussian shape [21]. To further improve the method used in the design of the ALMA receiver optics, we incorporate the quadratic function to calculate the taper and aperture efficiencies into the existing procedure. We shall demonstrate in this paper that, by doing so, the antenna exhibits better performance. For completeness, we also provide an outline of the optimization procedure from [4] for convenience.
II. OPTIMIZATION METHOD
The field emanated from a distant cosmic source propagates in the form of a plane wave. It is important to ensure that this field is coupled to the feed with maximum efficiency after it undergoes scattering and distortion by the off-axis mirrors. The coupling efficiency is determined by the amount of energy intercepted by the sub-reflector.
The size of the sub-reflector is designed for minimum blockage. Extreme care must be taken when designing the sub-reflector. Although a smaller diameter gives higher truncation of the field and therefore produces higher taper efficiency (i.e. more uniform illumination), it increases spillover at the same time. Because of this reason, a sub-reflector with a small diameter may not necessarily guarantee a good design for the antenna. A balance is to be taken between both taper and spillover efficiencies so as to obtain optimum aperture efficiency. This is to say that the aperture efficiency can be represented as a product of the taper efficiency and spillover efficiency :
| (1) |
The taper efficiency derived from the quadratic on a pedestal distribution can be expressed as [21]:
| (2) |
where T is the edge taper. The spillover efficiency is given as [22]:
| (3) |
Substituting (2) and (3) into (1), we obtain the following equation for the aperture efficiency:
| (4) |
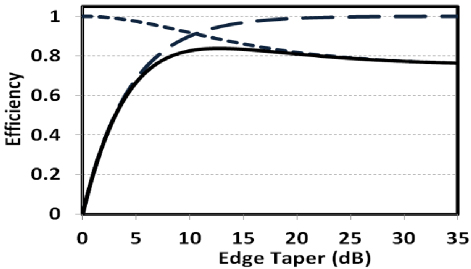
Figure 2: The spillover (dashed line), taper (dotted line), and aperture (solid line) efficiencies for an unblocked aperture.
For the ALMA antenna, the radii of the main reflector r and sub-reflector r are 6000 mm and 375 mm, respectively. Substituting these values into (2) to (4), we obtain the relationship of the antenna efficiency against edge taper T, as depicted in Fig. 2. It can be observed from the figure that the improvement in spillover efficiency is obtained at the expense of the taper efficiency , i.e. as increases, decreases correspondingly. The optimum aperture efficiency can be found at the point where both and intersect each other – which is 83.77 % at 12.74 dB. It could also be seen that the aperture efficiency at the vicinity, i.e. within 1 dB, of the crest is relatively unaffected by changes in the edge taper. The aperture efficiency falls to 83.66% at T 13.74 dB and 83.64% at T 11.74 dB. The fall is more gradual when the edge taper exceeds the optimum value than it is below. An optimization method that achieves this level of tolerance can be regarded as effective.
The optics system in Fig. 1 is considered for optimization. The distances imperative for achieving optimal performance are from the aperture of the horn to the center of mirror 1 (d), between mirrors 1 and 2 (d), and from mirror 2 to the beam waist (d) of its corresponding incident wave. To establish continuity in the propagation, the beam waist of this incident beam is to be located at the same position as the Cassegrain focus. Hence, the distance d is to be matched with the distance from mirror 2 to the Cassegrain focus . The values of and the optimum edge taper are therefore two fixed parameters for the optical system.
The aim is to find the combination of d, d and the corresponding mirror focal lengths f and f that together will collectively produce the desired values of and the edge taper .
III. COMPUTATIONAL IMPLEMENTATION
In a quasi-optical configuration, the beam parameters – radius of curvature (), beam radius (), and phase slippage () – fully describe the wave at every point along its travel path. Multimode Gaussian wave is propagated from the feed towards mirror 1 and is subsequently scattered from mirrors 1 and 2 to the sub-reflector. The beam parameters at the mirrors, beam waist after mirror 2, and the sub-reflector can be determined by solving the ray transfer matrix of the ABCD law [23]. According to [22], the complex beam parameter q for the input and output waves is defined as:
| (5) | ||
| (6) |
Here, the subscripted terms in and out denote the input and output of the optical system, respectively, while (r) and (i) represent the real and imaginary components of q. By applying the ray transfer matrix, q can be expressed in terms of q as [22]:
| (7) |
Parameters A, B, C, and D for the wave propagation in free space and through a thin lens are given by (8a) and (8b) below [22]:
| (8a) |
The phase slippage is given as [4]:
| (10) |
The beam continues its propagation from the beam waist at d to the sub-reflector. The value of the radius of curvature is used to locate the position of the sub-reflector. In this case, the search is for this position along the propagation path. For the ALMA antenna, the sub-reflector has radius of curvature 6000 mm. The value of the Gaussian beam radius at this position gives the edge taper T
To calculate the edge taper T, we employ a general solution of the paraxial wave equation which includes higher order modes. The normalized electric field distribution may be expanded in terms of Gauss-Laguerre polynomials as [22]:
| (11) |
where L is the generalized Laguerre polynomials, p and m are the radial and angular indices, respectively, the phase delay, and is the polar angle. The modal expansion method is a powerful tool in designing and analyzing the millimeter and submillimeter systems since it propagates the solution from one component to another (both in the near and far fields) using analytical expressions. It is also much more accurate than the fundamental Gaussian beam, both in predicting the main beam and the sidelobe levels of diffracted beams. Consequently, we shall use the modal expansion to predict the edge taper and other parameters of the system. Being a solution of the paraxial wave equation, the multimode Gaussian does not predict precisely the beam distortion and cross-polar scattering caused by the off-axis mirrors. However, the curves computed in Fig. 2 illustrate that this method is sufficiently accurate to be employed in conjunction with the optimization technique.
The optimization process is implemented by casting the optical system as a non-linear function. Within the constrained range, d and d are varied in regularincrement steps, starting from the lowest allowable value. The stepping is run at a two-level loop – for each value of d, d runs through the range. For each set of d and d, the focal lengths f and f are used as the two input variables in a root-searching algorithm. We have implemented the Powell hybrid method to search for the roots. The algorithm has been proven effective when applied in cases such as this. The Powell hybrid algorithm is highly effective for solving systems of nonlinear equations. It combines the Newton-Raphson method and the Davidon-Fletcher-Powell (DFP) update, enabling fast convergence when the initial guesses are sufficiently close to the solution (a characteristic of the Newton-Raphson method) while also progressing toward the roots in non-linear regions (an advantage of the DFP updates). Initial guess values for f and f are entered to start the search. The calculation returns the values of d and T. The deviations of these values from the target values are the residues of the optimization function. The deviation of d from the target value and T from , are given respectively as:
| (12) | ||
| (13) |
The values of f and f that achieve convergence in d and T for each pair of d and d are calculated first for the mid-band frequency. The corresponding sets of f, f and f, f are also calculated for the low- and high-band edge frequencies, respectively. The deviations of the focal lengths from the mid-band values can be expressed as:
| (14) | ||
| (15) |
where the subscripts l, h, and m represent the focal lengths at the low and high band edges and the mid-band, respectively, while the superscript r 1 or 2 refers to the mirrors. Only the combinations at the mid-band where the deviations are (or very close to) zero would be considered as the final design parameters.
IV. RESULTS AND DISCUSSION
The specifications for band 6 of the ALMA feed optics are utilized to illustrate the optimization process. The arrangement of the optics is as shown in Fig. 1. This band has its mid-band frequency at 243 GHz, its low band edge frequency at 211 GHz, and high band edge frequency at 275 GHz. The Cassegrain focus distance from the center of mirror 2 is 230 mm. As discussed in the preceding section, the optimum edge taper is 12.74 dB at the sub-reflector. The feed horn aperture features a radius of 3.54 mm and semi angle 4.35.
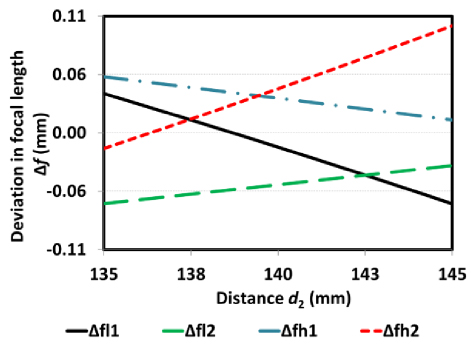
Figure 3: Variations of the focal lengths f and f from the mid-band values, represented by f (solid line), f (dashed-dotted line), f (dashed line), and f(dotted line) for d 46 mm.
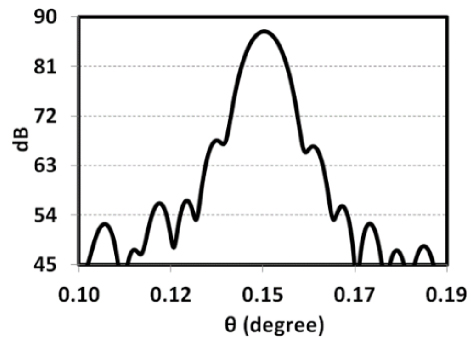
Figure 4: Radiation pattern at 211 GHz.
Figure 3 shows the plots for the deviations of the mirror focal lengths fs against a range of values for d at d 46 mm. For each value of d and with increasing d, fs from the mid-band values increase or decrease monotonically. Across the bandwidth, the spread of the deviation is bounded between the low- and high-edge frequency lines. The objective is to identify a common value for d where all four fs is close to 0. Since it is almost impossible for all fs to intersect simultaneously at 0, any point of d which gives deviations less than 0.1 mm is deemed acceptable. This results in more than one set of d, d, f, and f combination which satisfy the condition. The optimized combination of the design parameters that we have selected for the optical system is d 46 mm, d 137.45 mm, f 27.459 mm, and f 68.578 mm. In this case, the deviations in the focal lengths are all within 0.065 mm of the mid-band value. To validate our result, we design the antenna based on the set of parameters we obtain and calculate the radiation patterns using physical optics (PO). Figures 4 to 6 show the far field radiation patterns of the parabolic antenna measured using a feed horn operating with the HE11 mode.
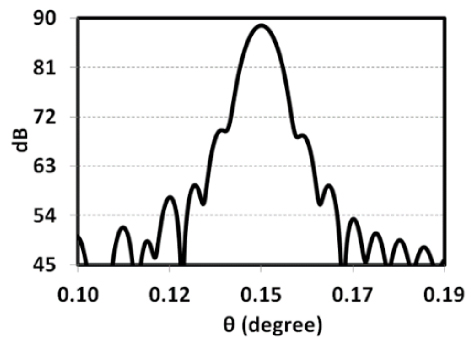
Figure 5: Radiation pattern at 243 GHz.
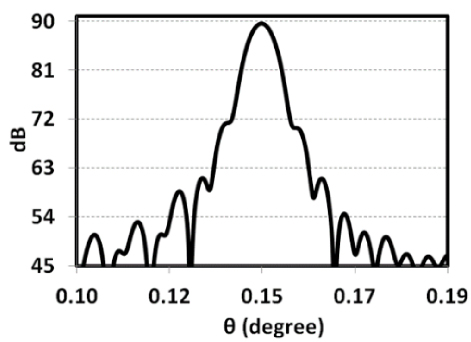
Figure 6: Radiation pattern at 275 GHz.
Table 1: Co-polar beam efficiency
| Level Below Peak (dB) | 211 GHz | 243 GHz | 275 GHz |
| 15 | 87.40% | 86.62% | 85.77% |
| 18 | 88.49% | 87.45% | 87.39% |
| 21 | 90.82% | 91.27% | 91.68% |
| 24 | 92.75% | 92.17% | 92.44% |
| 27 | 93.05% | 92.44% | 92.71% |
| 30 | 93.18% | 92.83% | 93.33% |
The beam efficiencies, computed within the area specified by the field contour level below the peak, is given in Tables 1 and 2. The low cross-polarization magnitudes indicate the high efficacy of the paired mirrors positioned opposite each other in suppressing the undesired radiation. Overall, the co-polarization beam efficiencies obtained from this method is relatively higher than those in [4].
Table 2: Cross-polar beam efficiency
| Level Below Peak (dB) | 211 GHz | 243 GHz | 275 GHz |
| 15 | 0.04% | 0.03% | 0.02% |
| 18 | 0.04% | 0.03% | 0.03% |
| 21 | 0.04% | 0.04% | 0.03% |
| 24 | 0.05% | 0.04% | 0.03% |
| 27 | 0.05% | 0.04% | 0.03% |
| 30 | 0.05% | 0.04% | 0.03% |
V. CONCLUSION
A simple, fast and sufficiently accurate optimization procedure for a receiver optics with multiple focusing elements is presented. The proposed method is developed further from that in [4]. It employs the quadratic on a pedestal distribution to compute the optimum antenna efficiency and its corresponding edge taper and implements the propagation of multimode Gaussian optics to numerically solve for the crucial design parameters. The final parameters of the receiver optics are validated using physical optics. The findings indicate that the proposed procedure is effective in achieving the optimal arrangement of design specifications within an acceptable level of tolerance.
ACKNOWLEDGMENT
This work was supported in part by the Fundamental Research Grant Scheme (project: FRGS/1/2024/STG01/UTAR/02/2).
REFERENCES
[1] K. H. Yeap and K. Hirasawa, Analyzing the Physics of Radio Telescopes and Radio Astronomy. Hershey, PA: Business Science Reference, pp. 33-55, 2020.
[2] C. Y. Tham, G. Yassin, and M. Carter, “Analysis techniques for the optics in millimeter/submillimeter wave radio telescope receivers,” Jurnal Fizik Malaysia, vol. 28, no. 1 & 2, pp. 49-53, 2007.
[3] K. H. Yeap and C. Y. Tham, “Receiver optics design for ALMA,” Wireless Personal Communications, vol. 134, pp. 1531-1549, Apr. 2024.
[4] K. H. Yeap and C. Y. Tham, “Optimization of an offset receiver optics for radio telescopes,” Journal of Infrared, Millimeter, and Terahertz Waves, vol. 39, no. 1, pp. 64-76, 2018.
[5] C. Y. Tham and S. Withington, “ALMA receiver optics design electromagnetic analysis: Second report (band 3, 6, 7 and 9),” University of Cambridge, 1 July 2003.
[6] C. Y. Tham and S. Withington, “ALMA receiver optics design electromagnetic analysis: Third report (band 4, 8 and 10),” University of Cambridge, 12 Dec. 2003.
[7] K. H. Yeap, K. Hirasawa, and H. Nisar, Analyzing the Physics of Radio Telescopes and Radio Astronomy. Hershey, PA: Business Science Reference, pp. 1-32, 2020.
[8] M. Carter, A. Baryshev, M. Harman, B. Lazareff, J. Lamb, S. Navarro, D. John, A.-L. Fontana, G. A. Ediss, C.-Y. Tham, S. Withington, F. Tercero, R. Nesti, G. H. Tan, Y. Sekimoto, M. Matsunaga, H. Ogawa, and S. Claude, “ALMA front end optics,” Proc. of SPIE, vol. 5489, pp. 1074-1084,2004.
[9] M. Naruse, T. Ito, Y. Sekimoto, H. Toba, N. Satou, M. Sugimoto, W. Shan, Y. Iizuka, T. Kamba, M. Kamikura, and Y. Serizawa, “Near-field beam pattern measurement of qualification model of ALMA band 8 (385-500 GHz) cartridge receiver,” Experimental Astronomy, vol. 24, no. 1-3, pp. 89-107, 2009.
[10] M. Naruse, Y. Sekimoto, M. Kamikura, M. Sugimoto, T. Ito, N. Satou, K. Kumagai, Y. Iizuka, and Y. Fujimoto, “Near-field beam pattern measurement of ALMA band 8 (385-500 GHz) first cartridge,” in Proceedings of the 3rd European Conference on Antennas and Propagation, Berlin, Germany, pp. 2437-2441, 23-27 Mar.2009.
[11] Y. Sekimoto, Y. Iizuka, N. Satou, T. Ito, K. Kumagai, M. Kamikura, M. Naruse, and W. L. Shan, “Development of ALMA band 8 (385-500 GHz) cartridge,” in Proceedings of the 19th International Symposium in Space Terahertz Technology, Groningen, Netherlands, pp. 253-257, 28-30 April 2008.
[12] A. Baryshev, R. Hesper, K. Wielinga, G. Gerlofsma, and M. Carter, “Design and verification of ALMA band 9 receiver optics,” in Proc. of the 15th International Symposium in Space Terahertz Technology, Northampton, Massachusetts, pp. 433-440, 27-29 April 2004.
[13] C. Gieser, H. Beuther, D. Semenov, A. Ahmadi, T. Henning, and M. R. Wells, “Physical and chemical complexity in high-mass star-forming regions with ALMA-I. Overview and evolutionary trends of physical properties,” Astronomy & Astrophysics, vol. 674, p. A160, 2023.
[14] H. S. Algera, H. Inami, P. A. Oesch, L. Sommovigo, R. J. Bouwens, M. W. Topping, S. Schouws, M. Stefanon, D. P. Stark, M. Aravena, and L. Barrufet, “The ALMA REBELS survey: The dust-obscured cosmic star formation rate density at redshift 7,” Monthly Notices of the Royal Astronomical Society, vol. 518, no. 4, pp. 6142-6157,2023.
[15] F. Rizzo, F. Roman-Oliveira, F. Fraternali, D. Frickmann, F. M. Valentino, G. Brammer, A. Zanella, V. Kokorev, G. Popping, K. E. Whitaker, and M. Kohandel, “The ALMA-ALPAKA survey-I. High-resolution CO and [CI] kinematics of star-forming galaxies at z=0.5-3.5,” Astronomy & Astrophysics, vol. 679, p. A129, 2023.
[16] E. Parlanti, S. Carniani, A. Pallottini, M. Cignoni, G. Cresci, M. Kohandel, F. Mannucci, and A. Marconi, “ALMA hints at the presence of turbulent disk galaxies at z5,” Astronomy & Astrophysics, vol. 673, p. A153, 2023.
[17] F. Rizzo, C. Bacchini, M. Kohandel, L. Di Mascolo, F. Fraternali, F. Roman-Oliveira, A. Zanella, G. Popping, F. Valentino, G. Magdis, and K. Whitaker, “The ALMA-ALPAKA survey-II. Evolution of turbulence in galaxy disks across cosmic time: Difference between cold and warm gas,” Astronomy & Astrophysics, vol. 689, p. A273, 2024.
[18] A. Pope, J. McKinney, P. Kamieneski, A. Battisti, I. Aretxaga, G. Brammer, J. M. Diego, D. H. Hughes, E. Keller, D. Marchesini, and A. Mizener, “ALMA reveals a stable rotating gas disk in a paradoxical low-mass, ultradusty galaxy at z=4.274,” The Astrophysical Journal Letters, vol. 951, no. 2, p. L46, 2023.
[19] G. Sabatini, S. Bovino, and E. Redaelli, “First ALMA maps of cosmic-ray ionization rate in high-mass star-forming regions,” The Astrophysical Journal Letters, vol. 947, no. 1, p. L18,2023.
[20] H. Sano, Y. Yamane, J. T. van Loon, K. Furuya, Y. Fukui, R. Z. E. Alsaberi, A. Bamba, R. Enokiya, M. D. Filipović, R. Indebetouw, and T. Inoue, “ALMA observations of supernova remnant n49 in the large magellanic cloud. II. Non-LTE analysis of shock-heated molecular clouds,” The Astrophysical Journal, vol. 958, no. 1, p. 53, 2023.
[21] J. W. Baars, The Paraboloidal Reflector Antenna in Radio Astronomy and Communication. New York: Springer, 2007.
[22] P. F. Goldsmith, Quasioptical Systems: Gaussian Beam, Quasioptical Propagation and Applications. New York: IEEE Press, 1998.
[23] K. Halbach, “Matrix representation of Gaussian optics,” American Journal of Physics, vol. 32, no. 2, pp. 90-108, 1964.
BIOGRAPHIES

Kim Ho Yeap received his Bachelor of Engineering (Honors) from Universiti Teknologi Petronas, Master of Science from Universiti Kebangsaan Malaysia, and Ph.D. from Universiti Tunku Abdul Rahman. He is currently an associate professor in Universiti Tunku Abdul Rahman.

Mey Chern Loh received both her Bachelor of Engineering (Honors) and Master of Engineering Science from Universiti Tunku Abdul Rahman. She is currently pursuing her doctorate degree in the same university.

Peh Chiong Teh received his Bachelor of Engineering (Honors) from University of Manchester Institute of Science and Technology and Ph.D. from University of Southampton. He is currently an associate professor in Universiti Tunku Abdul Rahman.

Veerendra Dakulagi earned his B.E. in electronics and communication engineering (E&CE) and MTech in power electronics from Visvesvaraya Technological University, Belagavi, India, in 2007 and 2011, respectively. He earned his Ph.D. degree in array signal processing from the same university in 2018. He is currently a professor in Guru Nanak Dev Engineering College, Bidar, India.
ACES JOURNAL, Vol. 39, No. 11, 1012–1018
doi: 10.13052/2024.ACES.J.391109
© 2024 River Publishers