Absorbed Power in Human Head Skin Due to Near-Field, Exposure up to 100 GHz
Fatih Kaburcuk1 and Atef Z. Elsherbeni2
1Department of Electrical and Electronic Engineering, Sivas University of Science and Technology, Sivas 58000, Turkey, fkaburcuk@sivas.edu.tr
2Department of Electrical Engineering, Colorado School of Mines, Golden 80401, USA, aelsherb@mines.edu
Submitted On: June 05, 2025; Accepted On: February 01, 2026
Abstract
To prevent excessive skin temperature rise from overexposure due to near-field sources for frequencies from 6 to 300 GHz, international safety guidelines and standards for limiting exposure to electromagnetic (EM) waves introduce an incident power density (IPD) as an exposure reference limit and an absorbed power density (APD) as a basic restriction. At frequencies above 6 GHz, the penetration depth of EM waves in the human body model is particularly less, since EM wave penetration is more superficial in tissues. Therefore, the thickness of outermost tissues such as skin, which has different thicknesses in different realistic regions of a three-dimensional (3D) realistic human body, is a critical factor for the accuracy of EM dosimetry analysis. In this paper, the effect of skin thickness in a 3D planar head model on the spatially averaged APD over 1 cm2 and 4 cm2 areas due to near-field sources are investigated for the frequency range from 10 to 100 GHz. These investigations are performed using the finite-difference time-domain (FDTD) method considering different separation distances from the near-field source to the model of the skin surface. Numerical results show that skin thickness is the primary parameter in evaluating EM field exposure and the accuracy of EM dosimetry analysis.
Keywords: Absorbed power density, electromagnetic dosimetry analysis, FDTD method, incident power density, millimeter wave exposure, planar head model..
1 INTRODUCTION
In electromagnetic (EM) dosimetry analysis, skin thickness of a human body directly affects how much EM power is absorbed by the tissues due to lower penetration depth of EM fields in tissues at frequencies above 6 GHz. Therefore, it is necessary to investigate the relationship between skin thickness and absorbed power by the skin tissue for the accuracy of the EM dosimetry analysis, especially for predicting potential thermal effects and evaluating EM safety standards in [1, 2]. These standards, called as IEEE International Committee on Electromagnetic Safety (ICES) [1] and the International Commission on Nonionizing Radiation Protection (ICNIRP) [2], provide basic restrictions such as specific absorption rate (SAR1g and SAR10g) averaged over 1g and 10g of tissues and absorbed power density (APD) for assessing human safety from EM radiation.
For frequencies below 6 GHz [3, 4, 5, 6, 7, 8, 9, 10], EM waves penetrate deep into tissues, therefore, SAR1g and SAR10g have been used as basic restrictions to prevent excessive temperature rise on the surface and internal tissues due to different types of EM sources. However, the penetration of the EM waves and resulting temperature rise for frequencies above 6 GHz becomes more significant in superficial tissues [1, 2], especially within the skin tissue. Therefore, APD over 1 cm2 and 4 cm2 averaging areas on the skin surface determined in [1, 2] is a useful exposure metric to evaluate EM dosimetry instead of SAR1g and SAR10g. The APD limits recommended in [1, 2] are 20 W/m2 over a 4 cm2 surface area in the 6–300 GHz frequency range and 40 W/m2 over a 1 cm2 surface area in the 30–300 GHz frequency range. The spatially averaged incident power densities (IPD) over 1 cm2 and 4 cm2 areas, calculated in the free space without the presence of the human body model, is defined as an exposure reference level (ERL) [1] or reference level (RL) [2].
Assessment of EM dosimetry analysis due to antenna sources above 6 GHz has been extensively studied in [11, 12, 13, 14, 15, 16, 17, 18, 19, 20, 21, 22, 23, 24, 25]. However, the relationship between the spatially averaged IPD/APD and resulting temperature rise due to different exposure types has been studied by only a few research groups in [14, 15] and [22]. The correlation between the spatially averaged IPD and resulting temperature rise in a homogeneous planar skin model [11, 12, 13, 14, 15, 16, 17, 18, 19] due to EM exposure from the antennas. Furthermore, the APD, which correlates well with the superficial temperature rise in the tissues compared to IPD, due to different antenna types has been calculated in [18, 19, 20, 21, 22, 23, 24, 25] for the frequencies above 6 GHz. An intercomparison study reported in [14] investigated the effect of the incident angle on the IPD and resulting temperature rise due to different types of array antennas with different body separation distances. In [15], another intercomparison study has been performed by six different research groups using the finite-difference time-domain (FDTD) method, Galerkin-Bubnov indirect boundary element method (GB-IBEM), and finite integration technique (FIT) to calculate the IPD and resulting temperature rise in a human body model due to different antenna sources operating at the frequencies from 10 to 90 GHz. Furthermore, the spatially averaged APD in planar human body models with a single skin tissue and three different tissues (skin, fat, and muscle) has been calculated due to a single dipole and array dipole antennas operating at frequencies from 10 to 90 GHz in [22]. The intercomparison study in [22] has been performed by 11 different research groups using the different numerical methods (i.e. FDTD method, finite element method (FEM), FIT, transmission line method (TLM), and GB-IBEM).
EM dosimetry evaluation of a three-dimensional (3D) realistic human body model at frequencies above 6 GHz requires huge computational time and large computer resources due to cell size restriction in FDTD method. Therefore, a 3D multi-layered planar human model, instead of the 3D realistic human model, has been analyzed [11, 12, 13, 14, 15, 16, 17, 18, 19, 20, 21, 22, 23, 24, 25] above 6 GHz. In most studies, the human body model was considered to have a skin tissue of 1.5 or 2 mm thick. However, thickness of skin tissue in different regions of a realistic human body is not the same [25, 26, 27, 28, 29] and is known to vary between roughly 0.5 mm and 2 mm, especially on different regions of the human head as seen in Table 1. The realistic skin thickness values [28, 29] on the different anatomical regions (forehead, eyelid, cheek, chin, neck) of the realistic human head are tabulated for male and female in Table 1. They can also vary significantly across age groups, races, and genders. Since, it is a well-known fact that most of the EM fields emitted by far-field and near-field sources are absorbed by the outer tissues in the human body, especially by skin tissue. Therefore, some studies in [25, 26, 27] showed that accuracy of EM dosimetry at frequencies up to 100 GHz has been significantly affected by the skin thickness in the human body model. In [25], the effect of the skin thickness of a head model on APD above 6 GHz was investigated when the dipole antenna was placed at 15- and 45-mm distance from the model. In [26, 27], EM dosimetry analysis of one-dimensional human body models with different skin thicknesses have been investigated up to 100 GHz. However, the effect of skin thickness of the 3D human body model on EM dosimetry analysis has not been investigated sufficiently up to 100 GHz when the antenna is placed very close to the head model.
In this paper, the effect of skin thickness in a 3D planar head model on the spatially averaged APD and IPD have been analyzed using a dispersive formulation of the FDTD method for the frequency range from 10 to 100 GHz. The electrical parameters of each tissue are accurately represented by a three-term Debye model to accurately access the tissues dispersiveness properties on the numerically obtained results. To verify the accuracy of our FDTD codes [30] for EM dosimetry analysis, the spatially averaged IPD and APD values obtained in this study are compared to the mean values of them obtained by different research groups using different numerical methods in the intercomparison studies [15, 22]. Finally, the effects of separation distances between the antenna and the planar head model on the spatially averaged APD over the skin surface of the model are investigated for each frequency of interest.
Table 1 Skin thickness in different regions of the realistic human head [28, 29]
| Regions | Male (mm) | Female (mm) |
| Forehead | 0.900 | 0.835 |
| Eyelid | 0.569 | 0.473 |
| Cheek | 1.237 | 1.044 |
| Chin | 0.891 | 0.746 |
| Neck | 1.561 | 1.255 |
| Postauricular | 0.766 | 0.657 |
| Temple | 1.795 | |
| Nasal Dorsum | 2.016 | |
| Malar | 1.086 | |
| Scalp | 1.383 | |
| Vertex | 0.957 |
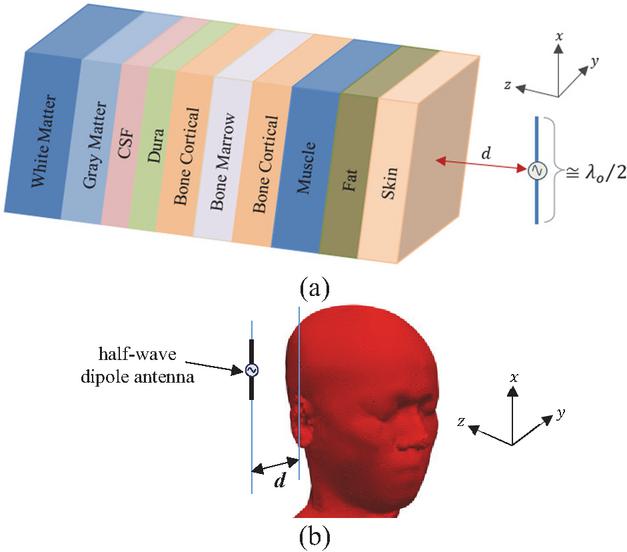
Figure 1 (a) a 3D planar head model and (b) a 3D realistic head model with a half-wave dipole antenna at the separation distance of d.
2 MODEL, METHOD, AND EXPOSURE METRICS
2.1 Multilayered planar head model
A 3D planar multi-layered head model shown in Fig. 1 is used for the EM dosimetry analysis in this study. This model contains nine different head tissues (skin, fat, muscle, bone cortical, bone marrow, dura, CSF, gray and white matter). The arrangement of these tissues in the planar head model is shown in Fig. 1, and their corresponding thickness values (Th) are provided in Table 2. The side length (L) and thickness (T) of the multi-layered planar head model are provided in Table 3 for each frequency of interest from 10 to 100 GHz.
Table 2 Thickness (Th) and three-term Debye coefficients of head tissues
| Th | ||||||||
| Tissues | (mm) | (ps) | (ps) | (ps) | ||||
| Skin | 1.5 | 4.03 | 0.12 | 32.41 | 22.83 | 1.44 | 7.23 | 160.7 |
| Fat | 1.5 | 2.56 | 0.33 | 1.18 | 1.42 | 1.32 | 4.98 | 16.94 |
| Muscle | 2.5 | 4.48 | 3.79 | 29.74 | 19.35 | 1.60 | 5.79 | 17.36 |
| Bone Cortical | 1.5 | 2.64 | 0.69 | 2.68 | 6.16 | 1.35 | 5.56 | 19.22 |
| Bone Marrow | 1.5 | 2.56 | 0.33 | 1.15 | 1.40 | 1.30 | 4.91 | 16.16 |
| Dura | 1 | 4.60 | 3.75 | 19.03 | 19.51 | 1.47 | 5.55 | 18.60 |
| CSF | 1 | 4.61 | 4.71 | 39.89 | 31.69 | 1.71 | 6.386 | 24.34 |
| Gray Matter | 3 | 4.42 | 3.12 | 2.58 | 2.03 | 1.62 | 6.12 | 18.66 |
| White Matter | 10 | 4.31 | 2.21 | 18.09 | 14.50 | 1.59 | 6.05 | 17.76 |
Table 3 Size and resolution of the planar head model and length of antennas operated between 10 and 100 GHz
| Frequency | Resolution | T | L | Antenna |
| (GHz) | (mm) | (mm) | (mm) | Length |
| (mm) | ||||
| 10 | 0.25 | 25 | 100 | 13 |
| 20 | 25 | 100 | 9 | |
| 30 | 25 | 100 | 6 | |
| 40 | 0.125 | 25 | 50 | 4 |
| 50 | 25 | 50 | 3 | |
| 60 | 25 | 50 | 2.3 | |
| 70 | 25 | 50 | 15 | |
| 80 | 0.0625 | 25 | 25 | 1.2 |
| 90 | 25 | 25 | 1 | |
| 100 | 25 | 25 | 0.8 |
The 3D planar multilayer head model in Fig. 1 (a) provides ease of computation and enables efficient EM dosimetry analysis. Furthermore, this planar model was chosen to ensure its applicability in FDTD analyses up to 100 GHz, where the required spatial cell size (0.1 mm) and time step constraints exist. The planar model can accurately represent EM field distributions and exposures across layered tissues; however, it cannot represent the detailed curvature and heterogeneous structure of a 3D realistic head model in Fig. 1 (b), which requires a very large computational domain and a very long computational time for EM dosimetry analysis at frequencies up to 100 GHz. Therefore, although the planar model is suitable for preliminary or comparative evaluations as in [15] and [22], anatomically detailed and realistic 3D head models could be used in future studies to provide higher spatial accuracy and better representation of realistic conditions.
2.2 Electrical properties of tissues
The electrical parameters (relative permittivity- and conductivity-) of the head tissues in Fig. 1 are frequency dependent. They can be obtained in (1) by using the three-term Debye coefficients of these tissues ( relative permittivity at infinite frequency, static relative permittivity, relaxation time at kth term). These three-term Debye coefficients, which are available for the frequency range between 20 and 100 GHz, are provided in [31] and given in Table 2.
| (1a) | ||
| (1b) |
2.3 Electromagnetic dosimetry analysis
EM dosimetry analysis of the human model exposed to a near-field source was performed using the dispersive formulation of the FDTD method in [9, 10] which is suitable for the EM analysis of inhomogeneous and complex structures such as the human body models. The FDTD problem domain, which includes the 3D planar head model, a near-field source, and 15-cell air layer, is truncated by a 10-cell convolution perfectly matched layer (CPML) [32]. The spatial resolution of the FDTD problem domain with the head model must be at least one-tenth of the minimum wavelength () in the tissues to satisfy the Courant-Friedrichs-Lewy (CFL) stability condition [30]. Therefore, the spatial resolutions different for all frequencies of interest between 10 and 100 GHz are given in Table 3.
2.4 Near field exposure
A single half-wave dipole used as a near-field source in the EM dosimetry analysis was designed at all frequencies of interest from 10 to 100 GHz. The lengths of the dipole antennas, which are half of the free-space wavelength () at the desired frequencies, were given in Table 3 and adjusted to have maximum radiation power emitted from the dipole antenna. The half-wave dipole antenna was placed at a separation distance of d from the skin surface of the head model as shown in Fig. 1. It would have been optimal to use a source antenna that covers the entire frequency band from 10 GHz to 100 GHz, then the FDTD simulation would have run only once. However, the design of such antenna is outside the scope of this paper. The use of the dispersive type FDTD formulation [9, 10] yields more accurate results even if one uses different dipole antenna centered at a specific frequency as the dipole antenna radiates at other frequencies but without the same strength, thus a dispersive type of analysis is warranted.
The total input power radiated by a single half-wave dipole antenna is set to 10 mW, which represents the typical input power of antennas used in common wireless consumer devices [33]. For example, smartphones and wearable electronic devices typically radiate between 5 and 20 mW during active transmission (Wi-Fi or Bluetooth modes). Therefore, the modeled level of 10 mW approximates an average realistic usage scenario, consistent with previous studies [15, 22, 34].
2.5 Exposure metrics for evaluation
The spatially averaged normal IPD (IPDn) and total IPD (IPDt) of the time-averaged power density on the evaluation plane at various distances from the antennas has been calculated in the absence of the head model using the complex electric (E) and magnetic (H) fields in equation (2).
| (2a) | ||
| (2b) |
where * shows the complex conjugate, A refers to the averaging areas over 1 cm2 and 4 cm2, shows the unit vector normal to the evaluation plane, denotes the norm symbol, and dA is the variable of integration. The spatially averaged APD on the skin surface of the head model placed at different separation distance of d from the antenna has been calculated in equation (3) which is recommended by ICNIRP guidelines [1] and written in the following form:
| (3) |
where shows the unit vector normal to the integral area of A on the skin surface of the planar head model.
3 NUMERICAL EVALUATION
In this study, assuming that the skin thickness in different regions of the head model given in Table 1 varies between 0.5 mm and 1.5 mm, peak spatially averaged APD values were calculated depending on the skin thickness of 0.5, 1, and 1.5 mm, the frequency of 10–100 GHz and the separation distance of 2.5–15 mm. Additionally, the peak spatially averaged IPDn and IPDt over averaged areas of 1 cm2 and 4 cm2 due to a half-wave dipole antenna are calculated as a function of frequency up to 100 GHz and separation distance, and compared with the results in [22].
3.1 Performance of the antenna with and without a planar head model
The input reflection coefficients (S11) of the half-wave dipole antennas operated at 20 and 60 GHz frequencies with and without a 3D planar head model are shown in Fig. 2. In the simulation with the planar head model, the separation distance of d between the antenna and the skin surface was assumed to be 5 mm, and the skin thickness (tskin) was assumed to be 0.5, 1, and 1.5 mm. As can be seen from Fig. 2, the S11 values are really affected by the presence of the planar head model and the change in its skin thickness, especially at the frequency of 20 GHz.
Table 4 Comparison of peak spatially averaged IPDn, IPDt, and APD over 1 cm2 and 4 cm2 areas with separation distances of 2, 5, 10, and 15 mm at frequency of 10, 30, and 90 GHz
| Dist. | Freq. | Ref. | IPD (W/m) | IPD (W/m) | APD (W/m) | |||
| (mm) | (GHz) | 1 cm2 | 4 cm2 | 1 cm2 | 4 cm2 | 1 cm2 | 4 cm2 | |
| 2 | 90 | [22] | 36.99 | 10.83 | 56.53 | 20.38 | 24.76 | 6.71 |
| This Work | 36.86 | 10.82 | 56.48 | 20.42 | 24.96 | 6.68 | ||
| 5 | 10 | [22] | 18.04 | 8.23 | 20.62 | 11.28 | 9.62 | 3.85 |
| This Work | 18.01 | 8.23 | 20.61 | 11.29 | 10.02 | 3.98 | ||
| 30 | [22] | 21.31 | 8.46 | 25.34 | 12.09 | 11.93 | 4.38 | |
| This Work | 21.05 | 8.42 | 25.02 | 12.04 | 11.46 | 4.23 | ||
| 90 | [22] | 21.92 | 8.55 | 26.30 | 12.31 | 14.29 | 5.24 | |
| This Work | 21.83 | 8.51 | 26.22 | 12.27 | 13.96 | 5.08 | ||
| 10 | 10 | [22] | 8.26 | 5.19 | 8.72 | 6.09 | 2.34 | 1.40 |
| This Work | 8.27 | 5.19 | 8.73 | 6.10 | 2.38 | 1.36 | ||
| 30 | [22] | 9.36 | 5.43 | 9.99 | 6.51 | 4.91 | 2.79 | |
| This Work | 9.23 | 5.39 | 9.85 | 6.46 | 4.78 | 2.68 | ||
| 90 | [22] | 9.55 | 5.49 | 10.23 | 6.62 | 6.25 | 3.54 | |
| This Work | 9.49 | 5.46 | 10.14 | 6.56 | 6.28 | 3.49 | ||
| 15 | 10 | [22] | 4.53 | 3.37 | 4.66 | 3.70 | 1.57 | 1.16 |
| This Work | 4.52 | 3.36 | 4.65 | 3.70 | 1.65 | 1.18 | ||
| 30 | [22] | 4.91 | 3.52 | 5.08 | 3.91 | 2.53 | 1.81 | |
| This Work | 4.84 | 3.49 | 5.00 | 3.87 | 2.38 | 1.72 |
3.2 Comparison of the results obtained with existing studies
In order to satisfy the accuracy of our FDTD code, the values of peak spatially averaged IPDn, IPDt, and APD over 1 cm2 and 4 cm2 areas obtained in the intercomparison study [22] due to a half-wave dipole antenna are compared to the results obtained in this study. In [22], the mean values of peak spatial averaged IPDn, IPDt, and APD over areas of 1 cm2 and 4 cm2 obtained by 11 different research groups have been calculated for the frequencies of 10, 30, and 90 GHz. These research groups used different numerical methods for the EM dosimetry analysis of the planar single and three-layered models. In Table 4, the mean values of peak spatial averaged IPDn, IPDt, and APD calculated in [22] for the three-layered model with the skin thickness of 1.5 mm are compared to the results obtained in this study. The results in Table 4 show good agreement.
3.3 IPD as a function of frequency
The peak values of spatially averaged IPD (IPDn and IPDt) over 1 cm2 and 4 cm2 areas due to a half-wave dipole antenna are calculated on an evaluation plane and they are shown in Fig. 3 as a function of frequencies from 10 to 100 GHz when the separation distance of d is 2, 5, and 10 mm. As can be seen from Fig. 3, IPDn and IPDt over 1 cm2 and 4 cm2 areas gradually increase up to 30 GHz, then their increase slows down and reaches steady-state values. As expected, the peak values of IPDt are higher than those of IPDn for both each frequency of interest and each separation distance, and these values also decrease as the separation distance of d increases.
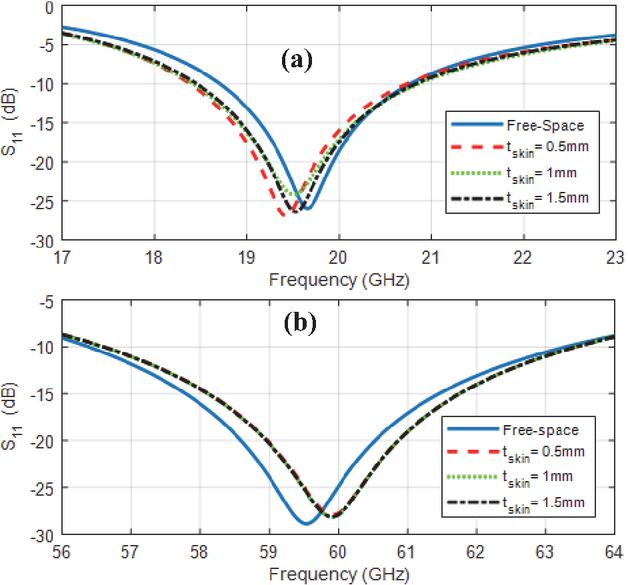
Figure 2 S11 of the antenna operated at (a) 20 and (b) 60 GHz with and without the 3D planar head model.
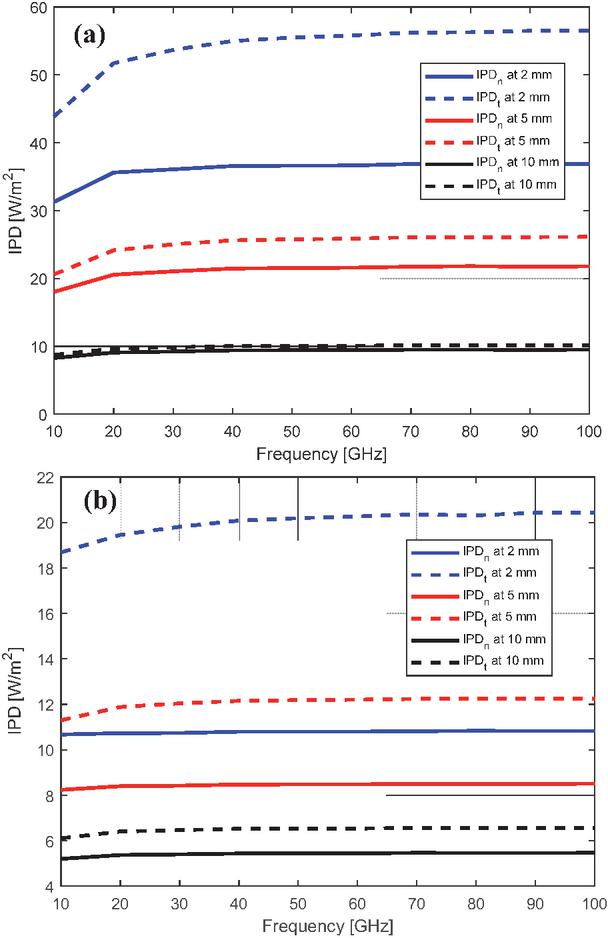
Figure 3 IPDn and IPDt values [W/m2] over (a) 1 cm2 and (b) 4 cm2 averaged areas as a function of frequency with the separation distance of 2, 5, and 10 mm.
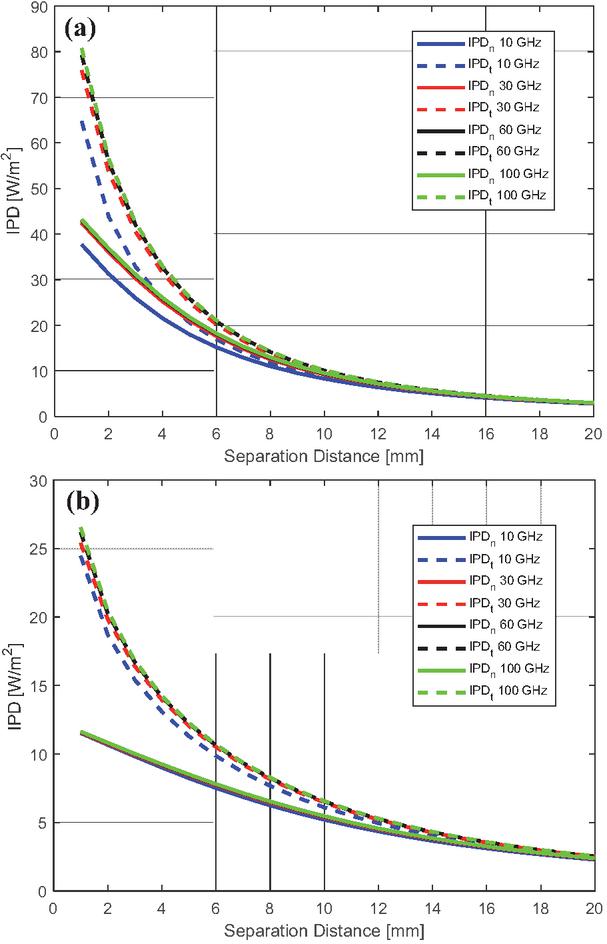
Figure 4 IPDn and IPDt values [W/m2] over (a) 1 cm2 and (b) 4 cm2 averaged areas as a function of separation distance at 10, 30, 60, and 100 GHz.
3.4 IPD as a function of separation distance
The peak values of spatially averaged IPDn and IPDt over areas of 1 cm2 and 4 cm2 shown in Fig. 4 are calculated as a function of separation distance from 1 to 20 mm for the frequencies of 10, 30, 60, and 100 GHz. As seen in Fig. 4, since EM radiation decreases with distance from the source, the IPDn and IPDt values decrease exponentially as the separation distance increases.
3.5 APD as a function of frequency and skin thickness
To show the effect of skin thickness on the spatially averaged APD values over 1 cm2 and 4 cm2 areas, the planar head model with the adjacent half-wave dipole antenna operated at frequencies from 10 to 100 GHz is analyzed using the FDTD method. Figure 5 shows the APD values as a function of frequency from 10 GHz to 100 GHz when the skin thickness is 1.5, 1, and 0.5 mm and the separation distance is 5 and 10 mm. The compared results show that APD values are affected by the changes in skin thickness of the human head, operating frequency of the antenna, and the separation distance between the human body and antenna. As expected, APD values decrease as the separation distance from the antenna increases. There is a relationship between APD values and operating frequency, but it would be difficult to make an inference between the operating frequency of the antenna in the 20–100 GHz range and the APD values. However, it can be observed that APD tends to increase as frequency increases, especially from 20 GHz to 90 GHz. This is expected because the energy of the EM wave increases with frequency. The APD values over 1 cm2 averaging area generally shows higher than those over 4 cm2 averaging area, especially at higher frequencies, because smaller averaging areas lead to local hotspots or more localized absorption.
As can be seen from Fig. 5, thinner skin leads to higher APD values, especially at 10 GHz, because it allows more EM waves to penetrate deeper tissues and causes higher energy absorption in superficial tissues. However, thicker skin resulting in lower APD allows EM waves to penetrate less deeply into tissues because the energy is attenuated more when reaching deeper tissues. Furthermore, the penetration depth at frequencies of 30 and 60 GHz is less than 1 mm and 0.5 mm [1], respectively. Therefore, APD values are more affected by skin thickness changes from 1.5 mm to 1 mm at 30 GHz and from 1.5 mm to 0.5 mm at 60 GHz. As the separation distance between the antenna and the skin surface increases from 5 mm to 10 mm, the APD values decrease because the power density of the antenna decreases as the separation distance increases due to the inverse square law of EM radiation.
Figure 6 shows the relative percentage change rate (RPCR) in APD values as a function of frequency for skin thickness of 1.5 mm and 0.5 mm at the separation distance of 5 mm. In RPCR calculation, the APD values of 1.5 mm and 0.5 mm skin thickness are compared with the APD values of 1 mm skin thickness when d is 5 mm. As seen in Fig. 5, changes in skin thickness can cause significant changes in APD values in the frequency range of 10–100 GHz, especially at frequencies up to 30 GHz for 1.5 mm skin thickness and up to 60 GHz for 0.5 mm skin thickness. Furthermore, it can be realized that APD is more sensitive to frequency changes for 1.5 mm skin thickness at frequency below 30 GHz and for 0.5 mm skin thickness at frequency below 60 GHz.
| (4) |
3.6 APD as a function of separation distance and skin thickness
In Fig. 7, the peak spatially averaged APD values at 20 and 60 GHz are shown as a function of the separation distance from 2.5 mm to 20 mm. The APD values decrease as the separation distance increases from 2.5 mm to 20 mm. This follows the inverse square law of EM radiation. As seen in Fig. 7, APD values decrease sharply, especially at short distances between 2.5–5 mm, and gradually decrease at long distances between 10–20 mm. As expected, the APD averaged over 1 cm2 is significantly higher than that averaged over 4 cm2 at short separation distances. Moreover, as the separation distance increases, the influence of skin thickness on the APD values becomes negligible.
3.7 APD normalized by skin thickness
APD values normalized to skin thickness in equation (5) allow comparison of how absorbed power scales per unit skin thickness. This is useful for comparing absorption behavior over 1 cm2 and 4 cm2 areas with different skin thicknesses. Figure 8 shows the absorbed power density (NAPD) normalized to skin thickness (0.5 mm, 1 mm, and 1.5 mm) over 1 cm2 and 4 cm2 averaged areas at four operating frequencies (10, 30, 60, and 90 GHz). At both averaging areas, the NAPD decreases with increasing skin thickness and frequency, indicating stronger EM wave attenuation and reduced penetration depth at higher frequencies.
| (5) |
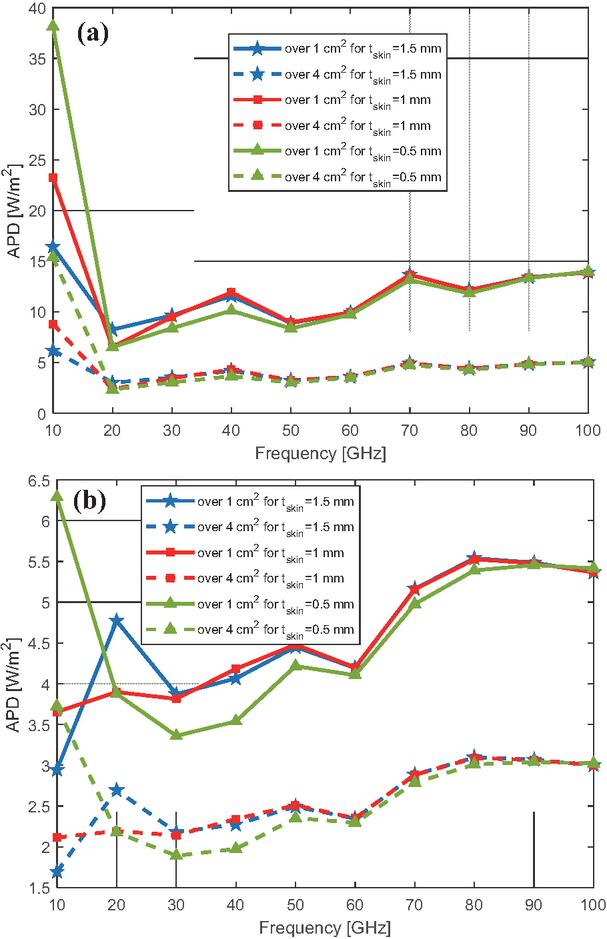
Figure 5 APD over 1 cm2 and 4 cm2 averaged areas as a function of frequency with the skin thickness of 0.5, 1, 1.5 mm for (a) mm and (b) mm.
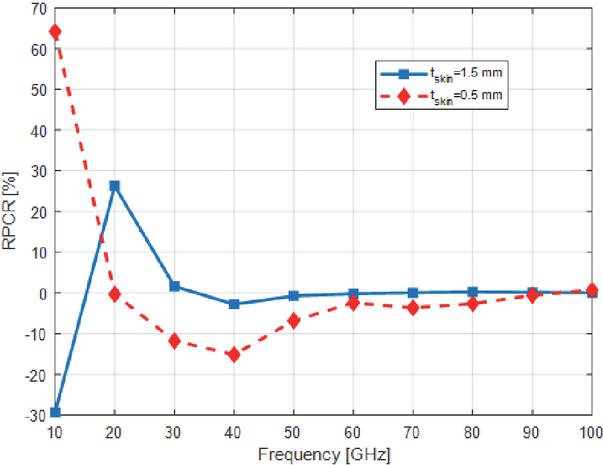
Figure 6 RPCR values based on the APD results for a skin thickness of 1 mm.
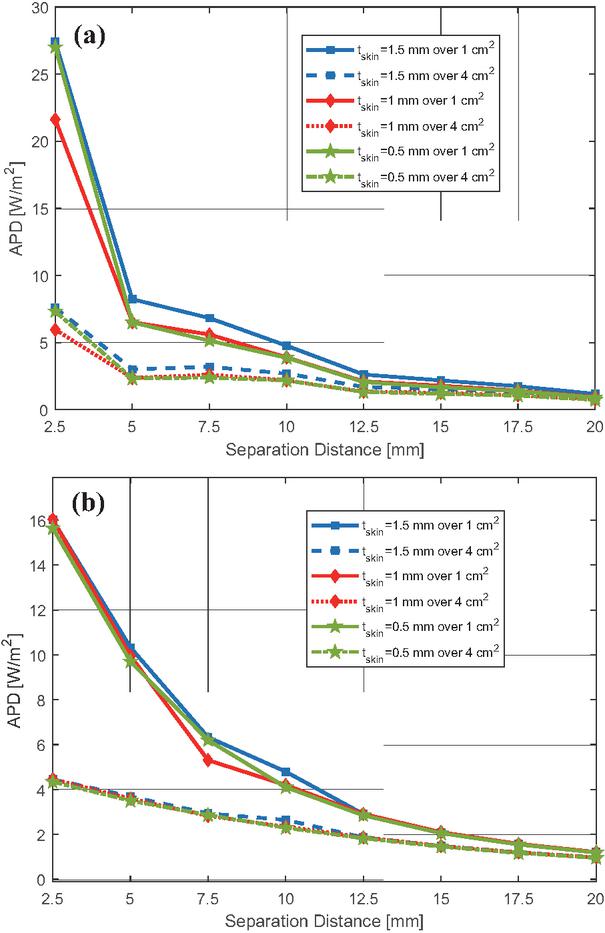
Figure 7 APD over 1 cm2 and 4 cm2 averaged areas at frequencies of (a) 20 and (b) 60 GHz as a function of the separation distance for 0.5, 1, and 1.5 mm skin thickness.
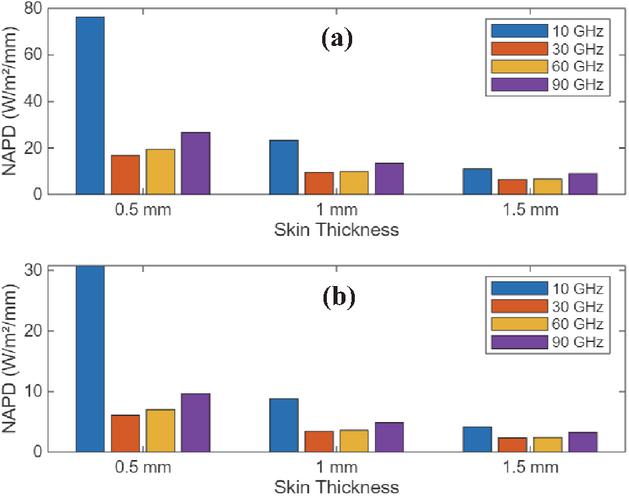
Figure 8 NAPD as a function of skin thickness (0.5 mm, 1.0 mm, and 1.5 mm) at four frequencies (10, 30, 60, and 90 GHz) over averaging areas of (a) 1 cm2 and (b) 4 cm2.
Although this study focuses on EM analysis of the planar head model due to the dipole antenna to show the effect of skin thickness on APD values, it is crucial to recognize its potential biological implications such as local tissue heating and thermal effect on tissues not investigated in this work. It is well known from [1, 2] that APD values correlate well with surface temperature rise and are an indicator of maximum skin temperature rise at frequencies above 10 GHz. Therefore, it can be concluded that skin thickness has a significant impact on APD values and may also have an impact on the temperature increase resulting from APD values.
The results obtained from this study can help understand the effect of skin thickness on APD levels due to wearable devices such as smartwatches, headsets, or smart glasses. For wearable devices, understanding the skin thickness effect on APD distributions helps assess the thermal safety of the device, ensuring that users are not exposed to harmful levels of EM radiation. Various factors such as bone structure, vascularity, hair and ambient temperature can change the electrical parameters of tissues and these changes can affect the EM dosimetry analysis of the human body, however the effect of these factors was not considered in this study. It can be realized from the numerical results that the APD values over 1 cm2 and 4 cm2 averaged areas for skin thickness between 0.5 mm and 1.5 mm obtained from this study are lower than the safety limits recommended by [1, 2] for assessing the significance for public health and regulatory compliance.
4 CONCLUSION
In this paper, the effects of skin thickness in the planar head model on the spatially averaged APD values over 1 cm2 and 4 cm2 areas have been investigated using the FDTD method due to a half-wave dipole antenna at operating frequencies from 10 to 100 GHz. It has been realized from the numerical results in this study that the APD values over areas of 1 cm2 and 4 cm2 are not only affected by the changes in skin thickness on the 3D human head, but also by changing the operation frequency of the antennas and the separation distance between the antenna and the human body model. As skin thickness decreases from 1.5 to 0.5 mm in the human head, APD values increase significantly at 10 GHz and then decrease at frequencies above 10 GHz. Consequently, since the skin is the most exposed organ to EM waves, skin thickness becomes the primary parameter affecting EM power absorption. Therefore, accurate skin thickness modeling is crucial for EM dosimetry evaluation. In addition, spatially averaged IPD values calculated on the evaluation plane placed at a certain distance from the antenna have been investigated at all frequencies of interest. This work clarifies EM safety limitation assessments by presenting a comprehensive parametric study investigating the dependence of APD values on skin thickness, frequency up to 100 GHz, and distance from the antenna to the skin surface. Future studies could investigate EM dosimetry analysis of a realistic 3D head model, rather than a 3D planar head model, to better model anatomical complexity and validate results. Additionally, the effects of skin thickness on APD, resulting temperature increase, and other exposure metrics due to different EM exposure scenarios from 5G/6G technologies up to 100 GHz can be investigated.
References
[1] Safety Levels with Respect to Human Exposure to Electric, Magnetic and Electromagnetic Fields, 0 Hz to 300 GHz, IEEE Standard C95.1, 2019.
[2] International Commission on Non-Ionizing Radiation Protection, “Guidelines for limiting exposure to electromagnetic fields (100 kHz to 300 GHz),” Health Phys., vol. 118, no. 5, pp. 483–524, May 2020.
[3] J. Wang and O. Fujiwara, “FDTD computation of temperature rise in the human head for portable telephones,” IEEE Trans. Microwave Theory Tech., vol. 47, pp. 1528–1534, Aug. 1999.
[4] P. Bernardi, M. Cavagnaro, S. Pisa, and E. Piuzzi, “Specific absorption rate and temperature increases in the head of a cellular-phone user,” IEEE Trans. Microwave Theory Tech., vol. 48, no. 7, pp. 1118–1126, July 2000.
[5] A. Hirata, S. Matsuyama, and T. Shiozawa, “Temperature rise in the human eye exposed to EM waves in the frequency range 0.6–6 GHz,” IEEE Trans. Electromag. Compat., vol. 42, no. 4, pp. 386–393, Nov. 2000.
[6] A. Hirata, M. Morita, and T. Shiozawa, “Temperature increase in the human head due to a dipole antenna at microwave frequencies,” IEEE Trans. Electromag. Compat., vol. 45, no. 1, pp. 109–116, Feb. 2003.
[7] A. Hirata and O. Fujiwara, “The correlation between mass averaged SAR and temperature elevation in the human head model exposed to RF near-fields from 1 to 6 GHz,” Phys. Med. Biol., vol. 54, no. 23, pp. 7227–7238, Dec. 2009.
[8] A. Hirata, I. Laakso, T. Oizumi, R. Hanatani, K. H. Chan, and J. Wiart, “The relationship between specific absorption rate and temperature elevation in anatomically based human body models for plane wave exposure from 30 MHz to 6 GHz,” Phys. Med. Biol., vol. 58, no. 4, pp. 903–921, 2013.
[9] F. Kaburcuk and A. Z. Elsherbeni, “Temperature rise and SAR distribution at wide range of frequencies in a human head due to an antenna radiation,” Applied Computational Electromagnetics Society (ACES) Journal, vol. 33, no. 4, pp. 367–372, Apr. 2018.
[10] F. Kaburcuk and A. Z. Elsherbeni, “Efficient computation of SAR and temperature rise distributions in a human head at wide range of frequencies due to 5G RF field exposure,” Applied Computational Electromagnetics Society (ACES) Journal, vol. 33, no. 11, pp. 1236–1242, Nov. 2018.
[11] Y. Hashimoto, A. Hirata, R. Morimoto, S. Aonuma, I. Laakso, K. Jokela, and K. R. Foster, “On the averaging area for incident power density for human exposure limits at frequencies over 6 GHz,” Phys. Med. Biol., vol. 62, no. 8, pp. 3124–3138, Apr. 2017.
[12] D. Funahashi, T. Ito, A. Hirata, T. Iyama, and T. Onishi, “Averaging area of incident power density for human exposure from patch antenna arrays,” IEICE Trans. Electron., vol. E101.C, no. 8, pp. 644–646, Aug. 2018.
[13] T. Nakae, D. Funahashi, J. Higashiyama, T. Onishi, and A. Hirata, “Skin temperature elevation for incident power densities from dipole arrays at 28 GHz,” IEEE Access, vol. 8, pp. 26863–26871, 2020.
[14] Y. Diao, K. Li, K. Sasaki, S. Kodera, I. Laakso, W. E. Hajj, and A. Hirata, “Effect of incidence angle on the spatial-average of incident power density definition to correlate skin temperature rise for millimeter wave exposures,” IEEE Trans. Electromagn. Compat., vol. 63, no. 5, pp. 1709–1716, Oct. 2021.
[15] K. Li, Y. Diao, K. Sasaki, A. Prokop, D. Poljak, V. Doric, J. Xi, S. Kodera, A. Hirata, and W. E. Hajj, “Intercomparison of calculated incident power density and temperature rise for exposure from different antennas at 10–90 GHz,” IEEE Access, vol. 9, pp. 151654–151666, 2021.
[16] A. L. Kapetanoviæ and D. Poljak, “Assessment of incident power density on spherical head model up to 100 GHz,” IEEE Trans. Electromagn. Compat., vol. 64, no. 5, pp. 1296–1303, Oct. 2022.
[17] R. Morimoto and A. Hirata, “Assessment of incident power density in different shapes of averaging area for radio-frequency exposure above 6 GHz,” Phys. Med. Biol., vol. 67, no. 21, Oct. 2022, Art. no. 215014.
[18] D. Funahashi, A. Hirata, S. Kodera, and K. R. Foster, “Area-averaged transmitted power density at skin surface as metric to estimate surface temperature elevation,” IEEE Access, vol. 6, pp. 77665–77674, 2018.
[19] Y. Diao and A. Hirata, “Exposure assessment of array antennas at 28 GHz using hybrid spherical near-field transformation and FDTD method,” IEEE Trans. Electromagn. Compat., vol. 63, no. 5, pp. 1690–1698, Oct. 2021.
[20] D. Funahashi, A. Hirata, S. Kodera, and K. R. Foster, “Area-averaged transmitted power density at skin surface as metric to estimate surface temperature elevation,” IEEE Access, vol. 6, pp. 77665–77674, 2018.
[21] K. Li, K. Sasaki, K. Wake, T. Onishi, and S. Watanabe, “Quantitative comparison of power densities related to electromagnetic near-field exposures with safety guidelines from 6 to 100 GHz,” IEEE Access, vol. 9, pp. 115801–115812, 2021.
[22] K. Li, S. Kodera, D. Poljak, Y. Diao, K. Sasaki, A. Susnjara, A. Prokop, K. Taguchi, J. Xi, S. Zhang, M. Yao, G. Sacco, M. Zhadobov, W. E. Hajj, and A. Hirata, “Calculated epithelial/absorbed power density for exposure from antennas at 10–90 GHz: Intercomparison study using a planar skin model,” IEEE Access, vol. 11, pp. 7420–7435, 2023.
[23] N. Miura, S. Kodera, Y. Diao, J. Higashiyama, Y. Suzuki, and A. Hirata, “Power absorption and skin temperature rise from simultaneous near-field exposure at 2 and 28 GHz,” IEEE Access, vol. 9, pp. 152140–152149, 2021.
[24] Y. Diao, E. A. Rashed, and A. Hirata, “Assessment of absorbed power density and temperature rise for nonplanar body model under electromagnetic exposure above 6 GHz,” Phys. Med. Biol., vol. 65, no. 22, Art. no. 224001, 2020.
[25] K. Taguchi, S. Kodera, A. Hirata, and T. Kashiwa, “Computation of absorbed power densities in high-resolution head models by considering skin thickness in quasi-millimeter and millimeter wave bands,” IEEE J. Electromagn. RF Microw. Med. Biol., vol. 6, no. 4, pp. 516–523, Dec. 2022.
[26] S. Kodera, K. Taguchi, Y. Diao, T. Kashiwa, and A. Hirata, “Computation of whole-body average SAR in realistic human models from 1 to 100 GHz,” IEEE Trans. Microwave Theory Tech., vol. 72, no. 1, pp. 91–100, Jan. 2024.
[27] F. Kaburcuk, “Effect of skin thickness on electromagnetic dosimetry analysis of a human body model up to 100 GHz,” International Journal of Microwave and Wireless Technologies, vol. 18, no. 8, pp. 1373–1380, 2024.
[28] E. A. Rashed, J. Gomez-Tames, and A. Hirata, “Human head skin thickness modeling for electromagnetic dosimetry,” IEEE Access, vol. 7, pp. 46176–46186, 2019.
[29] Y. Lee and K. Hwang, “Skin thickness of Korean adults,” Surg. Radiol. Anat., vol. 24, pp. 183–189, 2002.
[30] A. Z. Elsherbeni and V. Demir, The Finite-Difference Time-Domain Method for Electromagnetics with MATLAB Simulations, 2nd ed. Edison, NJ: SciTech Publishing, an Imprint of IET, 2016.
[31] R. Lumnitzer, A. Tanner, and A. Z. Elsherbeni, “Debye coefficients for biological tissues from 100 MHz to 100 GHz,” in 2020 International Applied Computational Electromagnetics Society Symposium (ACES), pp. 1–2, 2020.
[32] J. Roden and S. Gedney, “Convolution PML (CPML): An efficient FDTD implementation of the CFS-PML for arbitrary media,” Microwave and Optical Technology Letters, vol. 27, no. 5, pp. 334–339, 2000.
[33] IEEE Guide for the Definition of Incident Power Density to Correlate Surface Temperature Elevation, IEEE Std 2889TM, Dec. 2021.
[34] IEEE Guide for the Definition of Incident Power Density to Correlate Surface Temperature Elevation, IEEE Std 2889-2021.
Biographies

Fatih Kaburcuk received the M.Sc. and Ph.D. degrees in electrical engineering from Syracuse University, Syracuse, NY, USA, in 2011 and 2014, respectively. In 2014, he was a Visiting Research Scholar with the Department of Electrical Engineering at Colorado School of Mines, Golden, CO, USA. He joined Erzurum Technical University in 2015 and Sivas Cumhuriyet University in 2019. In August 2024, he joined the Department of Electrical and Electronics Engineering at Sivas University of Science and Technology, Sivas, Turkiye, where he is currently serving as a Full Professor. Dr. Kaburcuk is an Associate Editor of the Applied Computational Electromagnetics Society (ACES) Journal. His research interests include numerical methods in electromagnetics, biological effects of electromagnetic radiation, and finite-difference time-domain analysis of antennas and RF devices.

Atef Z. Elsherbeni received his Ph.D. degree in Electrical Engineering from Manitoba University, Winnipeg, Manitoba, Canada, in 1987. He started his engineering career as a part time Software and System Design Engineer from March 1980 to December 1982 at the Automated Data System Center, Cairo, Egypt. From January to August 1987, he was a Post-Doctoral Fellow at Manitoba University. Elsherbeni joined the faculty at the University of Mississippi in August 1987 as an Assistant Professor of Electrical Engineering and progressed to the full professor and the Associate Dean of the College of Engineering for Research and Graduate Programs. He then joined the Electrical Engineering and Computer Science (EECS) Department at Colorado School of Mines in August 2013. Elsherbeni is an IEEE Life Fellow and ACES Fellow. He is the Editor-in-Chief for Applied Computational Electromagnetics Society (ACES) Journal, and a past Associate Editor to the Radio Science Journal. He was the Chair of the Engineering and Physics Division of the Mississippi Academy of Science, the Chair of the Educational Activity Committee for IEEE Region 3 Section, and the past President of ACES Society. He received the 2023 IEEE APS Harington-Mittra Award for his contribution to computational electromagnetics with hardware acceleration and the ACES 2025 Computational Electromagnetics Award.
ACES JOURNAL, Vol. 41, No. 01, 64–73
DOI: 10.13052/2026.ACES.J.410107
© 2026 River Publishers