High-Frequency Performance Analysis and Verification of Twinax Cable Structures
Wei-Hsiu Tsai1, Ding-Bing Lin1, Cheng-Hsun Ho1, and Tzu-Fang Tseng2
1Department of Electronic and Computer Engineering
National Taiwan University of Science and Technology, Taipei 10607, Taiwan
D10802006@mail.ntust.edu.tw, dblin@mail.ntust.edu.tw, M11002248@gapps.ntust.edu.tw
2Department of CTO Office
BizLink International Corporation, New Taipei 23533, Taiwan
tzufang_tseng@optiworks.com
Submitted On: July 14, 2025; Accepted On: September 30, 2025
ABSTRACT
The most commonly used cables in device-to-device communication, such as USB, HDMI, DP, or PCI-e cables, as well as the MCIO cables currently used in artificial intelligence (AI) servers, has a differential Twinax configuration. The use of differential transmission aims to mitigate the impact of external interference. The Twinax structure consisted of a twin-core cable with an outer copper foil shielding. Achieving perfect symmetry in the Twinax cable is a challenge. This work investigated whether the asymmetrical structure and material impacted the production yield rate. The focus was on the mixed-mode analysis of the asymmetric Twinax cable. By utilizing mixed-mode S-parameters, we aimed to determine whether the cable designs met industry standards and complied with data rate requirements. Due to intense market competition and short development cycles, 3D full-wave simulations were time-consuming because of the high mesh count. Moreover, modeling was challenging because the center of each segment of an actual cable underwent slight variations. To expedite the design process, a method was developed to extract Twinax cable RLGC (Resistance, Inductance, Conductance, Capacitance) parameters, calculate mixed-mode S-parameters, and perform analysis and evaluations. Our approach not only enables efficient signal quality assessment across cables of varying lengths by simply connecting each small segment to account for continuous manufacturing variations but also significantly reduces product development time to under one hour. Furthermore, this work investigated the impact of common manufacturing imperfections, ensuring robust and reliable designs for real-world applications.
Keywords: Mixed-mode scattering parameters, RLGC parameters, transmission line analysis, Twinax cable, vector network analyzers.
I. INTRODUCTION
Whether it is 5G/6G, artificial intelligence (AI), high-performance cloud computing (HPC) systems, or quantum computing, future technologies all involve handling vast amounts of data and information. The demand for data rates continuously increases, and interface components for transmitting and receiving data face numerous challenges in maintaining signal integrity during high-speed transmissions. The Peripheral Component Interconnect Express (PCIe) interface standard is the most common in high-performance computing systems and data centers [1]. Since PCI-SIG introduced PCIe 1.0 in 2003, it has evolved continually, with the PCIe 6.0 standard released in 2021, boosting transmission capability from 2.5 GT/s to 64 GT/s. Increasing the frequency enables support for higher data rates. For high-speed digital signals, differential transmission with Twinax cables is commonly used because it effectively eliminates external noise.
The production process involves two methods: separate extrusion [2] as shown in Fig. 1 (a) and co-extrusion [3] as shown in Fig. 1 (b). The separate extrusion structure is inhomogeneous due to air gaps between the shielding and the dielectric insulator, resulting in an inhomogeneous dielectric in copper Twinax cables. The time domain time skew in Twinax cables is typically used as an indicator for testing the signal integrity (SI) performance of the cables [4]. However, time skew cannot accurately reflect the performance of the product in actual applications, as delay decreases at higher frequencies [5].
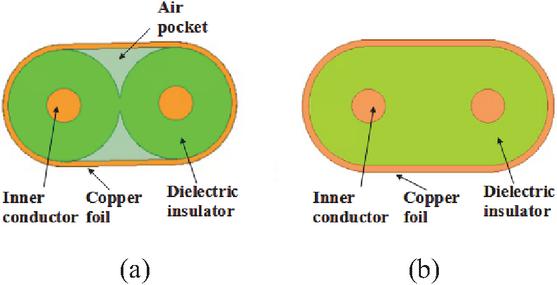
Figure 1: Cross-section of Twinax cables. (a) Separately extruded cable. (b) Co-extruded cable.
Moreover, compared to co-extruded cables, separately extruded cables typically have lower manufacturing costs but are believed to have greater skew-induced differential insertion loss resonance [6]. Time skew causes differential insertion loss to resonate at a frequency equal to 1/(2-time skew) [7], thereby minimizing unnecessary resonance in differential insertion loss at operating frequencies under lower time skew. Contrary to common belief, in separately extruded cables, dielectric non-uniformity helps reduce skew caused by structural asymmetry at high frequencies and eliminates the resonance due to differential insertion loss skew.
Studies indicate that dielectric non-uniformity could cause modulation behavior in scattering parameters (S-parameters) [8]. This phenomenon is like microstrip lines [9], where the phase velocity of odd and even modes varied due to dielectric non-uniformity [10]. Dielectric non-uniformity also causes relatively minor changes in capacitance [11], leading to modulation between propagation constants and significantly altering S-parameters [12]. Since the changes in the capacitance matrix are relatively minor, this variation was generally referred to as capacitance disturbance.
Non-uniformity and asymmetry are considered disturbances to the RLGC parameters, preventing accurate signal level interpretation and increasing bit error rates (BER) [13]. Furthermore, the characteristic modes of asymmetric coupled transmission lines are not limited to odd or even modes, necessitating transformations for the required mixed-mode S-parameter analysis.
In practice, analyzing the impact of dielectric non-uniformity and asymmetry on the signal integrity performance of Twinax cables, analytical equations for calculating S-parameters based on RLGC parameters can be derived. Calculating S-parameters from the RLGC parameters of multi-conductor transmission lines typically requires computing the hyperbolic function of matrices [14]. The hyperbolic matrix function can be calculated through infinite series summation, which increases the complexity of perturbation analysis [15]. Therefore, perturbation analysis based on solving eigenvalues and eigenvectors was proposed [16]. S-parameters can be calculated based on elements of the RLGC parameters without needing to compute matrix hyperbolic functions or any other infinite series. This assumes the cables are ideal transmission lines, with no variation along the transmission direction.
Our method employs an Ansys 2D extractor to extract S-parameters and derive R, L, G, and C parameters. We performed measurements on PCIe Twinax cables comparing the measurement results with the mathematical calculations. The results validated the accuracy of the mathematical calculation method, which could be applied to cable design. Additionally, because the concept was applicable to microstrip lines, the calculation method could be extended to printed circuit board assembly (PCBA) design.
There is already substantial research on symmetric transmission lines, but studies on asymmetric transmission lines only saw theoretical analysis starting in the 1990s [17, 18]. Research in this area is categorized under multiconductor transmission lines, primarily focusing on those based on conductive substrates. By measuring the S-parameters and applying curve fitting, the RLGC parameters of the transmission lines are obtained. It is important to note that this analysis needed to ignore the effects of other higher-order modes; otherwise, the extracted RLGC parameters will have significant errors.
This work is an extension of [19], providing a more comprehensive description of the structure, materials, and methods for actual cable measurements. In section II., we present a method to calculate the R, L, G, C, and asymmetric S-parameters of coupled transmission lines. Section III. simulates and calculates the S-parameters for four different Twinax cable scenarios when non-ideal conditions are considered, discussing whether the mixed-mode S-parameters meet industry standards. In section IV., we compare the measured S-parameters of Twinax cables produced with the calculated results to confirm their consistency. In section V., we conclude the paper.
II. CALCULATING R, L, G, C, AND S-PARAMETERS FOR TWINAX CABLE
A. Transmission line theory analysis for Twinax cable
The coupled two-dimensional transmission line model assumes that the two wires are symmetrical, as shown in Fig. 2. This structure ignores the influence of higher-order modes and assumes that the voltage propagation direction is along the x-axis. The magnetic field generated by the current in the first wire divides the interior of the wire into infinitely many concentric circles with negligible thickness. Each circle experiences different magnetic flux, resulting in varying eddy current strengths, with the strongest eddy currents near the center. Consequently, the current tends to concentrate on the surface of the wire. The proximity effect is caused by the eddy currents induced within the second wire, which resist changes in magnetic flux generated by the current in the first wire. Because the magnetic field strength is inversely proportional to the distance from the first wire, the magnetic field is stronger in areas of the second wire closer to the first wire, leading to larger opposing eddy currents. Conversely, areas of the second wire closer to the surrounding ground experience weaker magnetic fields, resulting in smaller opposing eddy currents.
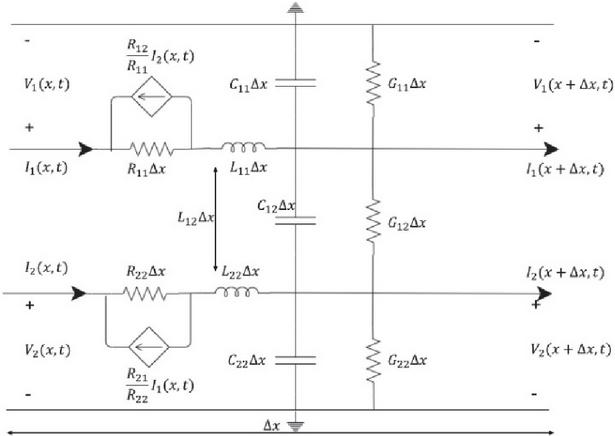
Figure 2: Equivalent circuit of two-dimensional transmission line.
The two-dimensional transmission line can be expressed as:
| (1) | |
| (2) | |
| (3) | |
| (4) |
Where:
is the series impedance of the first wire, is the series impedance of the second wire, (or ) is the mutual impedance between them, is the shunt admittance of the first wire, is the shunt admittance of the second wire, (or ) is the mutual admittance between them, is the self-inductance of the first wire, is the mutual inductance of the second wire, is the self-capacitance of the first wire, is the mutual capacitance between the two wires, is the AC resistance of the first wire, is the mutual resistance within the second wire, is the self-conductance of the first wire, is the mutual conductance between the two wires.
By substituting (3) into (1) and (2), and (4) into (1) and (2), the voltage propagation equations are derived. Observing equations (5) and (6) as a system of coupled differential equations, it is challenging to solve for the voltage propagation behavior of and in this scenario. Therefore, the application of eigenvalue decomposition is necessary. The procedure involves representing (5) and (6) as matrix equations, as shown in (13). Decomposing the 2x2 matrix in (13) into eigenvalues and with corresponding eigenvectors and , considering the infinite solutions for eigenvectors, set and as 1. Proceed with the calculations:
| (5) | |
| (6) | |
| (13) | |
| (20) | |
| (27) |
Taking (34) into (13) yields (53). Next, by differentiating as a linear operator, the differential operator can be factored out, resulting in (63). Let be a new variable representing , leading to a decoupled system of simultaneous differential equations. Finally, after solving for and , substituting back into yields the propagation equations for and in (74) and (A.). As for the current propagation behavior of and , substituting and back into (3) and (4) provides the expressions for and in (A.) and (A.). C and represent characteristic orthogonal basis modes for asymmetric transmission lines, analogous to even and odd modes for symmetric transmission lines, differing only in symbol representation. Here, and denote the ratio of and under C and mode scenarios:
| (34) | |
| (43) | |
| (53) | |
| (63) | |
| (71) | |
| (72) | |
| (73) | |
| (74) | |
| (75) | |
| (76) | |
| (77) |
Here and represent the propagation constants for the c and modes, respectively, and , , , and denote the characteristic admittances for the second and first wires of the C and modes, respectively.
For C mode:
| (80) | ||
| (81) |
The RLGC parameters of the asymmetric line can be calculated from the C mode (80) and (81) and mode (84) and (85) equations, yielding expressions (89)–(112):
| (89) | ||
| (93) | ||
| (94) | ||
| (95) | ||
| (96) | ||
| (97) | ||
| (98) | ||
| (99) | ||
| (100) | ||
| (101) |
The simultaneous equations (94) to (101) can be used to derive the values of (102) to (112):
| (102) | |
| (103) | |
| (104) | |
| (105) | |
| (106) | |
| (107) | |
| (108) | |
| (109) | |
| (110) | |
| (111) | |
| (112) | |
| (113) |
B. Extraction of S-parameters for asymmetric cables
Figure 3 depicts the model of an asymmetric transmission line. Coefficients for the C and modes, as well as the transmission system’s ABCD matrix, are given by (113), where , and are 2x2 matrices. , , , , , and each represent 2x2 matrices.
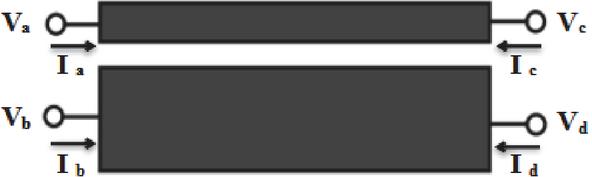
Figure 3: Model of an asymmetric cable.
Finally, the S-parameters for the asymmetric transmission line are obtained from the ABCD matrix. The 4-port network is simplified to a 2-port network through vector representation, with the matrices A, B, C, and D represented as:
| (120) | ||
| (125) | ||
| (128) | ||
| (133) | ||
| (138) | ||
| (143) | ||
| (150) | ||
| (153) | ||
| (158) |
The relationship between the ABCD matrix and S-parameters is:
| (163) | ||
| (166) |
Here
in the matrix, ports 1 and 2 are on the same side, while ports 3 and 4 are on the other side. We first calculate the RLGC parameters from the S-parameters of a short segment of the cable obtained using 2D extractor. Then, using the ABCD matrix, we cascade the segment to model cables of any desired length. Through derivation, it is shown that the S-parameters for cables of different lengths can be obtained. Based on the above equations, we can write a program for future design use, utilizing this numerical analysis to create a calculation program for convenient future applications.
III. CALCULATE S-PARAMETERS FOR NON-IDEAL TWINAX CABLES
A. Mathematical model verification
Due to the significant time demands of 3D full-wave simulations in the design process, particularly for cable lengths exceeding 1 meter, we have adopted a more efficient approach. First, the S-parameters obtained from the 2D extractor are converted into ABCD parameters using (163). Next, eigenmode decomposition and sorting are performed to derive the characteristic impedances and propagation constants. To determine and , eigenvalue decomposition is performed on the A-matrix of the ABCD matrix by (125). The eigenvectors yield . To obtain and , the eigenvalues of the A-matrix are extracted, resulting in . The diagonal elements are then processed using . For , , , and , the B-matrix of the ABCD matrix is used. By substituting the previously determined , , , and , the characteristic impedances can be derived. Finally, the RLGC values are calculated using (94)–(112).
To validate our methodology, we confirmed the consistency of the RLGC parameters calculated using our approach with those directly extracted from the Ansys 2D extractor. We chose to compare the inductance and capacitance values, as these parameters are fixed, making them easier to compare and clearly demonstrating their origin from the Ansys 2D extractor. Figure 4 shows the parameter settings of Twinax cables.
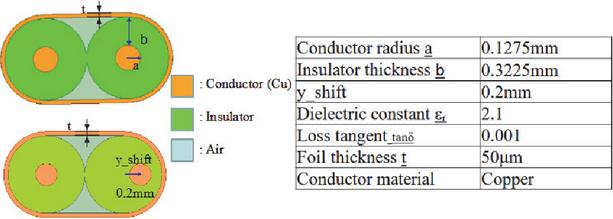
Figure 4: Parameter settings of Twinax cables.
Figure 5 shows a comparison of capacitance matrices (L). Figure 6 compares the inductance matrices (C). Results demonstrate that all the values are very close, verifying the accuracy of our calculation program.
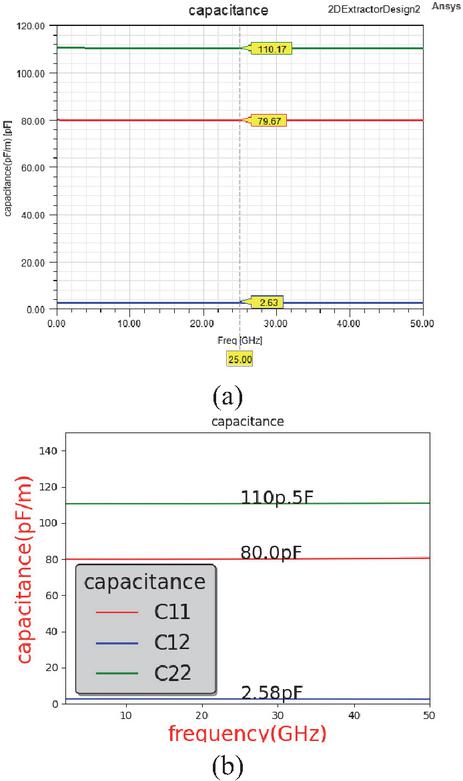
Figure 5: Capacitance matrices. (a) 2D extractor output. (b) By calculation.
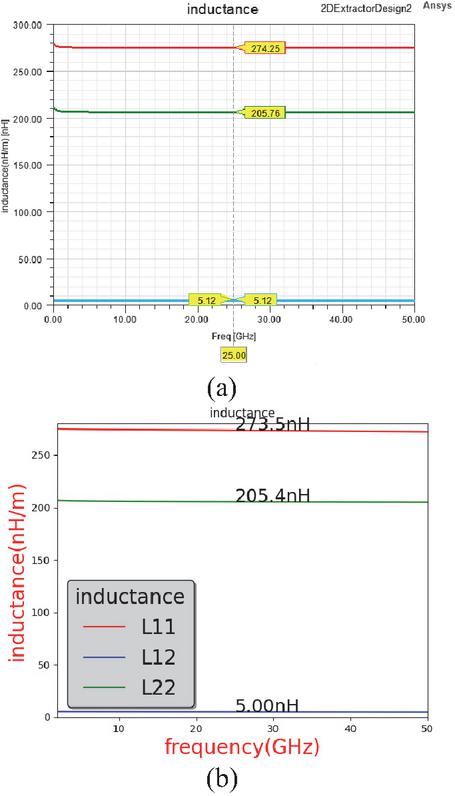
Figure 6: Inductance matrices. (a) 2D extractor output. (b) By calculation.
B. Calculating the parameters of non-ideal Twinax cables
Taking the most used server cable, the Twinax cable, as an example, the characteristic impedance is 100 ohms. Parameters are set as follows: copper conductor radius a 0.1275 mm, insulator thickness b 0.3225 mm, copper foil thickness t 50 m, , and . First, we observe the characteristics of a 1-meter cable when the conductor position is asymmetrically offset. Conceptually, when the two conductors move in opposite directions by equal amounts, the system is still considered symmetric. In this case, the cable only exhibits odd and even mode characteristics, with minimal variation in .
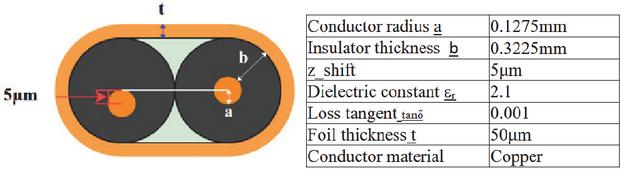
Figure 7: Cross-section of the cable when conductor is offset.
However, when one conductor is fixed at the center while the other is offset in any direction, the mode characteristics are no longer limited to odd or even modes. As shown in Fig. 7, when the left conductor is shifted downward by 5 m, the modes are no longer purely odd or even. Figure 8 shows that with a 5 m offset on one side of the conductor, there is no significant change in the RLGC parameters, whether it is self or mutual RLGC; the curves are nearly overlapping. Figure 9 illustrates the mixed-mode parameters under conductor offset, where SCD21 exhibits periodic fluctuations, approximately at 75 dB.
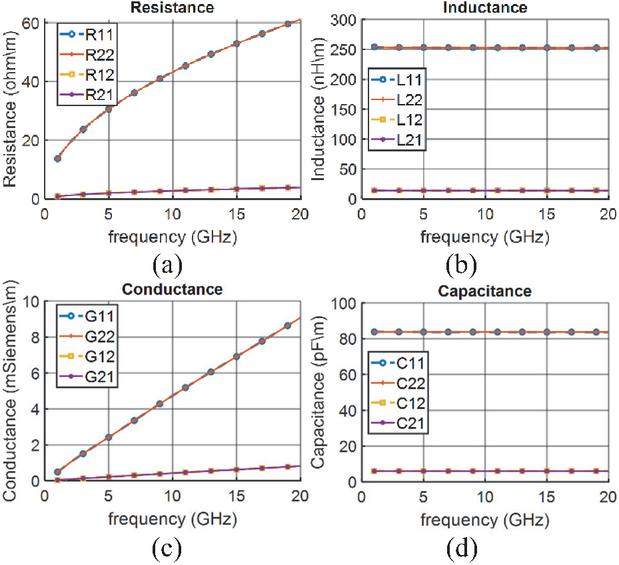
Figure 8: RLGC parameters from calculation when the left-side conductor is downwardly offset by 5 m. (a) Resistance. (b) Inductance. (c) Conductance. (d) Capacitance.
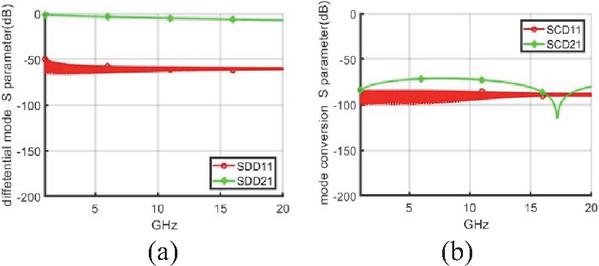
Figure 9: Left-side conductor is downwardly offset by 5 m for a 1-m cable. (a) SDD. (b) SCD.
The copper conductors inside the cable are produced through a drawing process. During production, variations in temperature and extrusion pressure can cause changes in the conductor diameter, potentially resulting in different diameters for the left and right conductors.
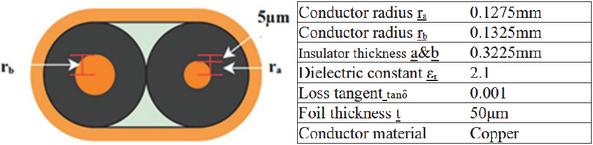
Figure 10: Diameter difference of the copper conductor is rb–r m.
As shown in Fig. 10, with current precision machinery, the diameter difference can be controlled within 5 m. This is assuming both conductors are centered with no positional offset.
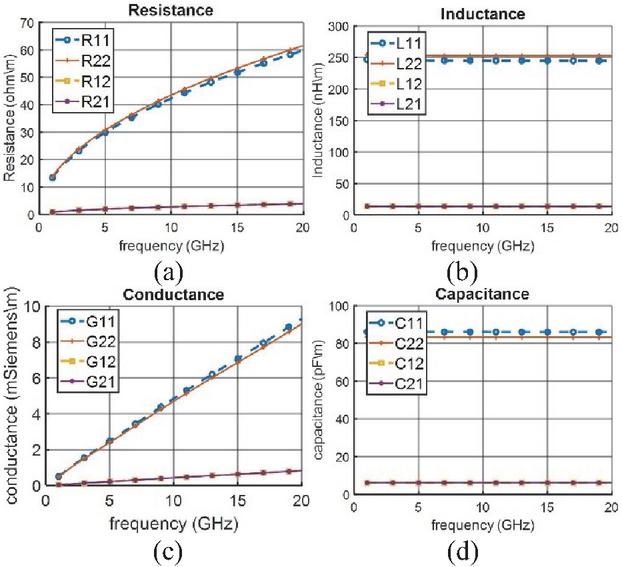
Figure 11: RLGC parameters from the diameter difference of the copper conductor by 5 m. (a) Resistance. (b) Inductance. (c) Conductance. (d) Capacitance.
Figure 11 shows that the RLGC parameters exhibit noticeable differences and are no longer overlapping. In Fig. 12, when calculating a 1-meter cable, the differential mode conversion S-parameter reaches 50 dB, which is within acceptable range in the industry.
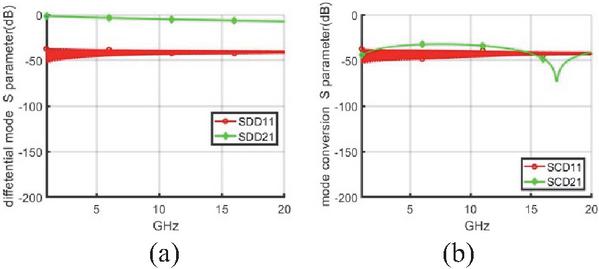
Figure 12: Diameter difference of the copper conductor by 5 m for a 1-m cable. (a) SDD. (b) SCD.
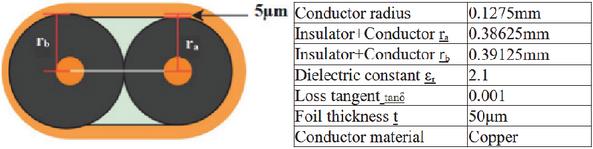
Figure 13: Difference in insulator thickness rb–r m.
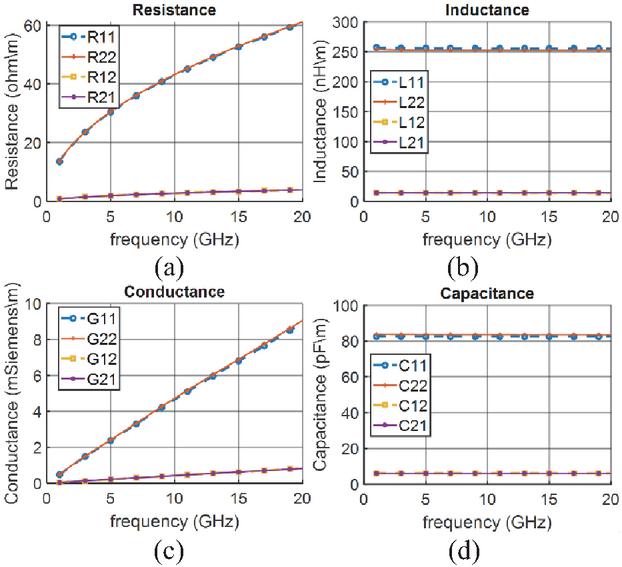
Figure 14: RLGC parameters from difference in insulator thickness by 5 m. (a) Resistance. (b) Inductance. (c) Conductance. (d) Capacitance.
Analyzing the thickness variation in the left and right insulation layers, the insulation is primarily formed through either physical or chemical foaming processes followed by extrusion. Due to differences in ambient temperature during production batches, variations in thickness may occur. The thickness is related to capacitance, and stray capacitance in the cable can slow down discharge rates, causing signal pulses to take longer to rise to a recognizable voltage. As a result, cables with lower capacitance exhibit more complete pulse waveforms, leading to better signal transmission performance. Additionally, the amount of air in the foam dielectric is related to the dielectric constant. For this discussion, we assume the dielectric constant is constant. Assuming a low dielectric constant of 2.1 for foamed EPE (expanded polypropylene), which is typically used in high-speed cables, we studied the impact when both conductors are the same size, but the insulation thickness differs by 5 m, as shown in Fig. 13.
In Fig. 14, minimal resistance variation was observed, along with lower capacitance values. In Fig. 15, SCD11 is observed at 50 dB, which is within the acceptable range.
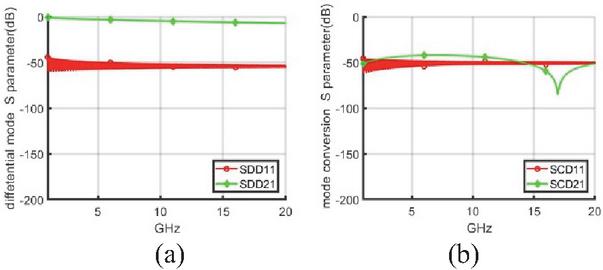
Figure 15: Difference in insulator thickness by 5 m for a 1-m cable. (a) SDD. (b) SCD.
C. Impact from the skin effect
When the cable manufacturing process achieves high symmetry, there remains a difference between the measured and simulated insertion loss. Typically, after 10 GHz, the skin depth becomes very shallow, and surface characteristics begin to affect signal loss. Signal transmission might fall within the range of surface roughness, which could worsen standing waves and reflections, elongating the signal path and increasing loss. In practice, the demand for low insertion loss copper continues to grow. In design, it is necessary to establish more realistic models.
Commercial software typically uses standard formulas to account for roughness, which represent a few traditional methods. As shown in Fig. 16, the surface features sharp peaks and valleys.
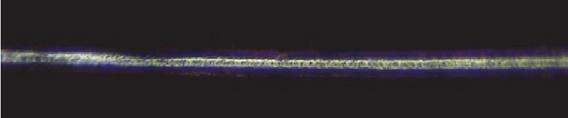
Figure 16: Copper conductor surface under a microscope.
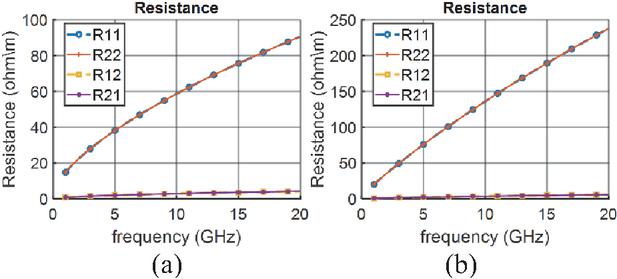
Figure 17: The roughness of different copper conductors in resistance. (a) 1.4 m. (b) 7.5 m.
The simulation adopts the Huray model, which defines surface roughness by the number of spheres in each hexagon and their arrangement. The actual roughness value of the conductor can be calculated based on the manufacturer’s parameters or measured data. Using HVLP2 copper roughness of 1.4 m and STD copper roughness of 7.5 m, we computed RLGC parameters. Comparison results are shown in Figs. 17–20.
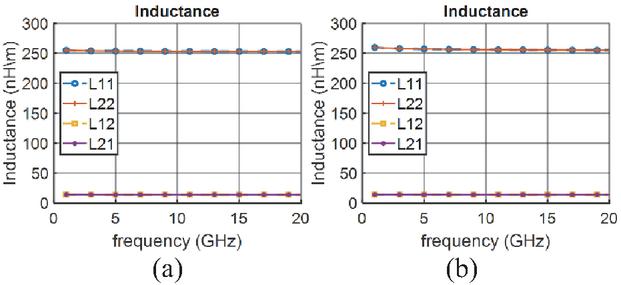
Figure 18: Surface roughness of different copper conductors in inductance. (a) 1.4 m. (b) 7.5 m.
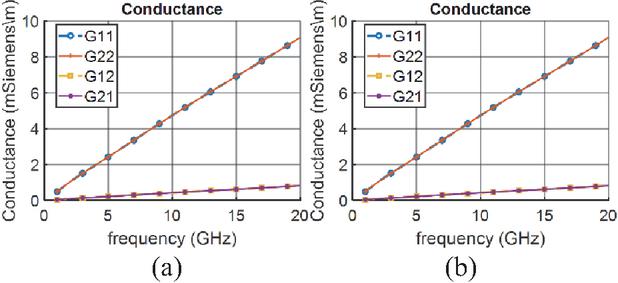
Figure 19: Surface roughness of different copper conductors in conductance. (a) 1.4 m. (b) 7.5 m.
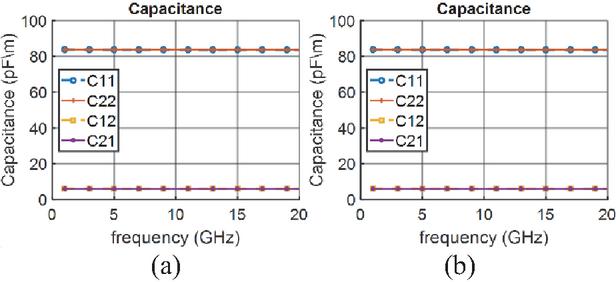
Figure 20: Surface roughness of different copper conductors in capacitance. (a) 1.4 m. (b) 7.5 m.
By observing the resistance parameters, it is evident that the resistance changes with different surface roughness levels. The higher the roughness, the greater the resistance. For high-frequency signals, the roughness of the metal surface becomes a significant factor in signal loss, as shown in Fig. 21. The impact on differential-to-differential mode S-parameters () is significant, while the impact on mode conversion S-parameters () is relatively minor, as illustrated in Fig. 22.
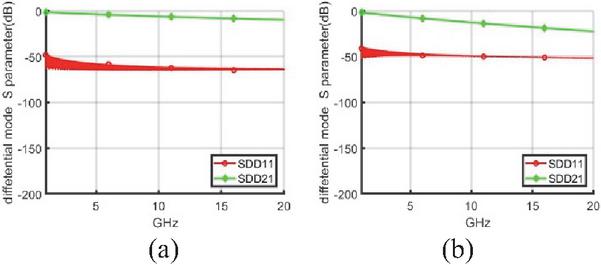
Figure 21: Differential mode S-parameter (SDD). (a) 1.4 m. (b) 7.5 m.
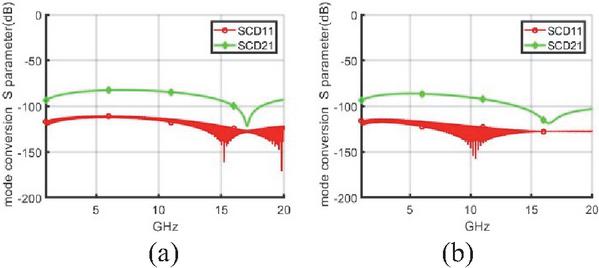
Figure 22: Mode conversion S-parameter (SCD). (a) 1.4 m. (b) 7.5 m.
IV. MEASUREMENT RESULTS OF TWINAX CABLE
We were unable to intentionally fabricate a worst-case Twinax cable with a 5 m eccentric asymmetry for the purpose of comparing measurement and calculation results. Instead, we reverse-engineered the cross-sectional dimensions of a randomly selected, real Twinax cable from the production line. As shown in Fig. 23, the measured dimensions and contours were imported into the Ansys 2D extractor. Using these reverse-engineered dimensions, we obtained the S-parameters, calculated the RLGC parameters, and derived the S-parameters for a Twinax cable sample.
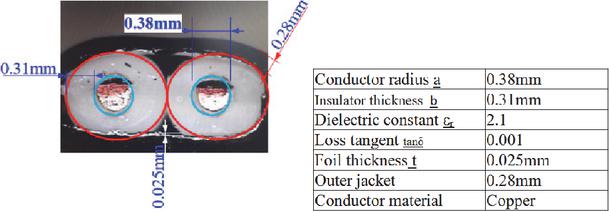
Figure 23: Cross-section of the Twinax cable.
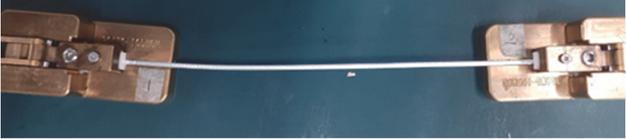
Figure 24: Device for 100-ohm cable measurement.
The sample was taken from a high-speed Twinax cable commonly used in AI server systems, with an original length of approximately 11 cm. An 8 cm section was cut for measurement. To verify our method, we compared the calculated results with VNA measurements of the 8 cm Twinax cable. The experimental setup is illustrated on Fig. 24.
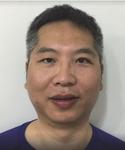
Since direct measurement of the Twinax cable is not possible, fixtures were added on both sides to enable testing of the DUT. The measured S-parameters include the characteristics of the fixtures. We used the 2X-thru de-embedding technique [20, 21] to obtain the DUT’s S-parameters. The results show a good agreement between the mixed-mode S-parameters calculated from the cross-sectional dimensions and the measured results, as seen in Fig. 25.
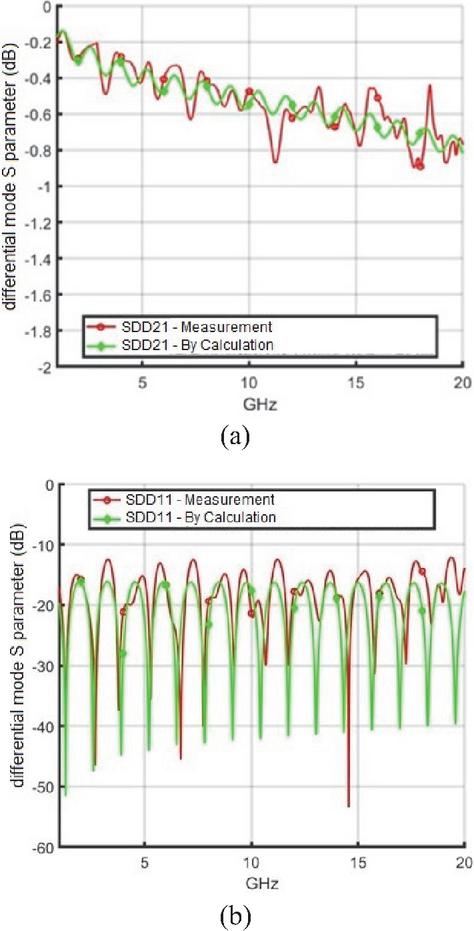
Figure 25: Calculation and measurement comparison of 8 cm cable. (a) SDD21. (b) SDD11.
From these results, we can see that the cross-sectional dimensional differences in Twinax cables are a combination of various manufacturing tolerances. In production, improving precision is essential to enhance signal transmission quality.
V. CONCLUSION
In this paper, we propose a computational method that extends the fundamental theory of odd and even modes to calculate RLGC parameters and obtain the S-parameters of asymmetric Twinax cables. We also evaluate the impact of copper conductor surface roughness on signal transmission. For transmission line losses, we estimate resistance and conductance parameters. Additionally, we examine mixed-mode S-parameters to ensure product quality. A server cable was physically measured, reverse-engineered, and its cross-sectional dimensions were compared with the S-parameters calculated using our method. The results demonstrate a strong agreement between the calculations and actual measurements. This computational approach is highly efficient and can be used to define future product standards. Our method addresses the time-consuming nature of 3D full-wave simulations for longer cables, providing the cable industry with an effective way to quickly assess production quality.
ACKNOWLEDGMENT
This work was supported by BizLink International Corporation.
REFERENCES
[1] Physical layer specifications and management parameters for 100 Gb/s operation over backplanes and copper cables, IEEE standard 802.3bj-2014 (amendment to IEEE standard 802.3-2012 as amended by IEEE standard 802.3bk-2013) 2014.
[2] E. Mayevskiy and J. Huffaker, Limitations of the intra-pair skew measurements in gigabit range interconnects [Online]. Available: https://www.te.com/content/dam/te-com/documents/medical/global/TE_WhitePaper_Limitations_of_Intra-Pair_Skew_Meas_061016.pdf
[3] Z. Chen, M. Prasad, D. O’Connor, P. Bond, and A. Muszynski, “Differential Twinax cable modeling by measured 4-port S-parameters,” in Proc. IEEE 14th Topical Meeting Elect. Perform. Electron. Packag., pp. 87–90, 2005.
[4] T. Sugiyama, H. Nonen, I. Fukasaku, H. Ishikawa, and T. Kumakura, “High-speed transmission copper cable for 25Gbit/s/lane,” in 2013 3rd IEEE CPMT Symposium Japan, Kyoto, Japan, pp. 1–4, 2013.
[5] D. Nozadze, A. Koul, K. Nalla, M. Sapozhnikov, and V. Khilkevich, “Effective channel budget technique for high-speed channels due to differential P/N skew,” in 2017 IEEE International Symposium on Electromagnetic Compatibility & Signal/Power Integrity (EMCSI), Washington, DC, USA, pp. 34–39, 2017.
[6] D. N. de Araujo, G. Pitner, M. Commens, B. Mutnury, and J. Diepenbrock, “Full-wave, TwinAx, differential cable modeling,” in 2008 58th Electronic Components and Technology Conference, Lake Buena Vista, FL, USA, pp. 1684–1689,2008.
[7] A. Talebzadeh, K. Koo, and P. Vuppunutala, “SI and EMI performance comparison of standard QSFP and flyover QSFP connectors for 56+ Gbps applications,” in 2017 IEEE International Symposium on Electromagnetic Compatibility & Signal/Power Integrity (EMCSI), Washington, DC, USA, pp. 776–781, 2017.
[8] Y. Liu, “Far-end crosstalk analysis for stripline with inhomogeneous dielectric layers (IDL),” in 2021 IEEE International Joint EMC/SI/PI and EMC Europe Symposium, Raleigh, NC, USA, pp. 825–830, 2021.
[9] Y. Liu, S. Yong, Y. Guo, and J, He, “An empirical modeling of far-end crosstalk and insertion loss in microstrip lines,” IEEE Transactions on Signal and Power Integrity, vol. 1, pp. 130–139, 2022.
[10] E. J. Denlinger, “Frequency dependence of a coupled pair of microstrip lines (correspondence),” IEEE Transactions on Microwave Theory and Techniques, vol. 18, no. 10, pp. 731–733, 1970.
[11] S. Yong, K. Cai, B. Sen, J. Fan, V. Khilkevich, and C. Sui, “A comprehensive and practical way to look at crosstalk for transmission lines with mismatched terminals,” in 2018 IEEE Symposium on Electromagnetic Compatibility, Signal Integrity and Power Integrity (EMC, SI & PI), Long Beach, CA, USA, pp. 538–543, 2018.
[12] S. Yong, Y. Liu, and V. Khilkevich, “Dielectric loss tangent extraction using modal measurements and 2-D cross-sectional analysis for multilayer PCBs,” IEEE Transactions on Electromagnetic Compatibility, vol. 62, no. 4, pp. 1278–1292, Aug. 2020.
[13] Y. Liu, S. Bai, C. Li, V. S. De. Moura, B. Chen, and X. Wang, “Inhomogeneous dielectric induced skew modeling of Twinax cables,” IEEE Transactions on Signal and Power Integrity, vol. 2, pp. 94–102, 2023.
[14] N. Dikhaminjia, J. Rogava, M. Tsiklauri, M. Zvonkin, J. Fan, and J. L. Drewniak, “Fast approximation of sine and cosine hyperbolic functions for the calculation of the transmission matrix of a multiconductor transmission line,” IEEE Transactions on Electromagnetic Compatibility, vol. 57, no. 6, pp. 1698–1704.
[15] A. A. Bhatti, “A computer-based method for computing the N-dimensional generalized ABCD parameter matrices of N-dimensional systems with distributed parameters,” in Proceedings of the Twenty-Second Southeastern Symposium on System Theory, Cookeville, TN, USA, pp. 590–593, 1990.
[16] W. I. Bowman and J. M. McNamee, “Development of equivalent Pi and T matrix circuits for long untransposed transmission lines,” IEEE Transactions on Power Apparatus and Systems, vol. 83, no. 6, pp. 625–632, 1964.
[17] U. Arz, D. F. William, D. K. Walker, and H. Grabinski, “Asymmetric coupled CMOS lines: An experimental study,” IEEE Transactions on Microwave Theory and Techniques, vol. 48, no. 12, pp. 2409–2414, 2000.
[18] K.-H. Tsai and C.-K. C. Tzuang, “Mode symmetry assessment of structurally non-uniform asymmetric coupled lines meandered for CMOS passive component design,” in 2009 IEEE MTT-S International Microwave Symposium Digest, Boston, MA, USA, pp. 285–288, 2009.
[19] W.-H. Tsai, D.-B. Lin, T.-F. Tseng, and C.-H. Ho, “Analysis of electrical characteristics of Twinax cable with asymmetric structures,” in 2024 IEEE Joint International Symposium on Electromagnetic Compatibility, Signal & Power Integrity: EMC Japan / Asia-Pacific International Symposium on Electromagnetic Compatibility (EMC Japan/APEMC Okinawa), Ginowan, Okinawa, Japan, pp. 342–345, 2024.
[20] J.-Y. Ye, J. Fan, X. Cao, Q.-M. Cai, Y. Zhu, and Y. Zhu, “A 2x-thru standard de-embedding method of surface components in high-speed PCBs,” in 2022 IEEE USNC-URSI Radio Science Meeting (Joint with AP-S Symposium), Denver, CO, USA, pp. 58–59, 2022.
[21] W.-H. Tsai, D.-B. Lin, P.-J. Lu, and T.-F. Tseng, “De-embedding technique for extraction and analysis of insulator properties in cables,” Applied Computational Electromagnetics Society (ACES) Journal, vol. 40, no. 6, pp. 550–563, 2025.
BIOGRAPHIES
Wei-Hsiu Tsai received a B.S. degree in Mathematics from the Fu Jen Catholic University, New Taipei, Taiwan, in 1999, and an M.B.A. degree in industrial management from the National Taiwan University of Science and Technology (Taiwan Tech), Taipei, in 2019. He is pursuing a Ph.D. degree in the department of electronic and computer engineering from the National Taiwan University of Science and Technology (Taiwan Tech) under the supervision of Prof. Ding-Bing Lin. He is currently an Engineer with BizLink International Corporation, New Taipei. His research interests include high-speed transmission techniques and high-frequency measurement techniques.

Ding-Bing Lin (S’89-M’93-SM’14) received the M.S. and Ph.D. degrees in electrical engineering from National Taiwan University, Taipei, Taiwan, in 1989 and 1993, respectively. From August 1993 to July 2016, he has been on the faculty of the Electronic Engineering Department, National Taipei University of Technology, Taipei, where he was Associate Professor, Professor and Distinguished Professor in 1993, 2005, and 2014, respectively. Since August 2016, he had been with National Taiwan University of Science and Technology, Taipei, where he is currently Professor in the Electronic and Computer Engineering Department. His research interests include wireless communication, antennas, high-speed digital transmission, and microwave engineering. From 2015 to 2018, he served as the Taipei Chapter Chair, IEEE EMC society. He has served as the Taipei Chapter Chair, IEEE AP society since 2022. He also serves as Associate Editor of IEEE Transactions of Electromagnetic Compatibility since 2019 and serves on the Editorial Board of the International Journal of Antennas and Propagation since 2014. He has published more than 250 papers in international journals and conferences. Lin was the recipient of the Annual Research Outstanding Award of the College of Electrical Engineering and Computer Science in 2004, 2006, and 2008. After he received these three awards, the College of Electrical Engineering and Computer Science awarded him the College Research Outstanding Award to highlight his research achievements. He was also the recipient of the Taipei Tech Annual Outstanding Research Award in 2008. Lin is the recipient of the Annual Research Outstanding Award of the National Taiwan University of Science and Technology in 2024.

Cheng-Hsun Ho received the B.S. degree from Department of Electronic and Computer Engineering, National Taiwan University of Science and Technology (NTUST), Taipei, Taiwan, in 2021, and the M.S. degree in Electronic and Computer Engineering from the National Taiwan University of Science and Technology (Taiwan Tech), Taipei, in 2023. His research includes high-frequency measurement and cable model design.

Tzu-Fang Tseng received the B.S. degree in electrical engineering from National Taiwan University, Taipei, Taiwan, in 2009, and the Ph.D. degree in photonics and opto-electronics from National Taiwan University, Taipei, in 2015. She started working in industry in 2015. Her research interests include MMW signal transmission, signal integrity in high-speed cables and connectors, and optical planar lightwave circuit design and applications.
ACES JOURNAL, Vol. 40, No. 11, 1133–1144
DOI: 10.13052/2025.ACES.J.401110
© 2025 River Publishers