Effect of the Inner Shape on the Scattering Cross-Section of an Aperture on an Electrically Large High-Q Cavity
Feng Tian1, Feng Fang1, Bo Peng2, Yongjiu Zhao1, and Qian Xu1,*
1College of Electronic and Information Engineering Nanjing University of Aeronautics and Astronautics, Nanjing 211106, China
Tianfeng1010@126.com, fangfeng@nuaa.edu.cn, yjzhao@nuaa.edu.cn, emxu@foxmail.com
∗Corresponding Author
2Beijing Institute of Radio Metrology and Measurement Beijing 100854, China
amazingpbcjf@126.com
Submitted On: October 09, 2025; Accepted On: December 22, 2025
ABSTRACT
This paper presents the effect of the inner shape on the statistical properties of the scattering cross-section of an aperture on a high-Q cavity. By combining the full-wave method and Monte Carlo simulations, the mean scattered far-field pattern of the aperture on a high-Q cavity can be obtained accurately. We show that the cosine roll-off distribution for the scattered far-field pattern is only an approximation for ideal cases, while the thickness and the inner shape of the aperture can affect the scattered far-field pattern significantly. Different models are used to demonstrate this phenomenon and the results are compared against the ideal cosine roll-off.
Keywords: Cavity scattering, Monte Carlo simulation, scattering cross-section.
1 INTRODUCTION
Efficient simulation of electromagnetic scattering from an aperture on a high-Q cavity is always a challenging problem, as it involves the full-wave (FW) simulation of the electromagnetic field integral [1, 2, 3]. The existing computer electromagnetic (CEM) methods for calculating the scattering cross-section have developed for many years, including the finite-difference time-domain (FDTD) method [4, 5, 6], method of moments (MoMs) [7, 8, 9, 10], multi-level fast multipole method (MLFMM) [11], shooting and bouncing rays (SBR) [12], and physical optics (PO) [13, 14]. The algorithms are applied choicely according to the target size of wavelength, simulation accuracy and time.
Early research on aperture scattering can be traced back to Bethe’s small-hole theory [15], in which a subwavelength hole in a perfectly conducting (PEC) plane is represented by equivalent electric and magnetic dipoles, providing quantitative relationships for the transmitted fields and powers in terms of aperture size and wavelength. Based on this foundation, Butler et al. [16] systematized the general integral-differential equations and numerical solution techniques for electromagnetic penetration (EMP) through apertures in PEC surfaces, providing numerical results for electrically small apertures of practical EMP engineering.
Harrington and Mautz [17] subsequently introduced a generalized network formulation in which the two regions separated by an aperture can be modeled via independent aperture admittance matrices. Within the same framework, Harrington [18] later analyzed the resonant behavior of electrically small apertures backed by conducting bodies, demonstrating that appropriate loading can drive “aperture–conductor resonance” and increase the transmission cross-section up to in the lossless limit.
In complex engineering environments, such as inlet ducts, open waveguides, and partially open cavities, aperture scattering is coupled with multimode cavity resonances and high-frequency effects. Anastassiu et al. [19] provided a comprehensive survey of the aperture scattering calculation methods for these structures, covering PO, modal expansions, and FW hybrid algorithms, highlighting their respective advantages, limitations, and computational trade-offs. From studies above, an evolution of the aperture-scattering research from simple small aperture models toward integrated modeling of aperture–cavity systems can be observed. However, most existing works address apertures on electrically small cavities. For apertures on electrically large high-Q cavities, the statistical scattering characteristics have not been systematically analyzed and concluded.
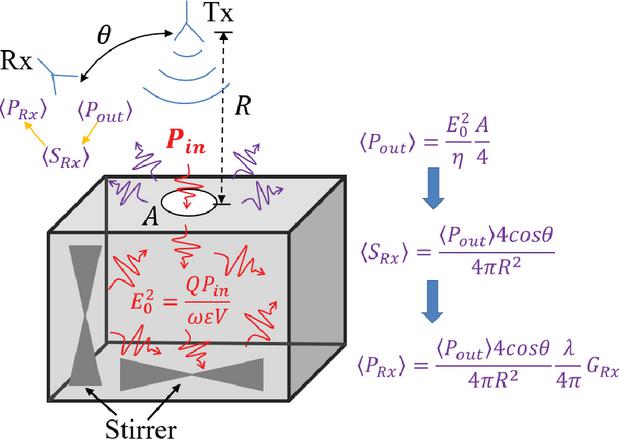
Figure 1 Schematic of the incident and scattered waves of an aperture on a high- cavity.
In an electrically large high-Q cavity, the EM wave propagation is described by the Hill’s equation [21], which is related to the Q-factor and volume of the cavity. Therefore, in the previous work of [22], by combining Hill’s equation with the Friis equation of free space, both the theoretical deviation and numerical verification for the scattering cross-section of an ideal aperture on a high-Q cavity were carried out. It was concluded that the average scattering cross-section of the ideal aperture with surface area (projected in normal direction) on a high-Q cavity can be approximated by
| (1) |
where and are the incident and observation angles of the transmitting (Tx) and receiving (Rx) ports outside the cavity, respectively.
However, when the aperture has depth with a certain thickness, the results will deviate from the ideal case. Besides, practical apertures have some inner shapes, such as the air intakes of aircrafts and vents for large ships. The inner shapes of the apertures are significant factors in determining the scattered far field, as they constrain the plane wave spectrum into a limited region.
To further investigate the aperture scattering on an electrically large high-Q cavity, this paper estimates the scattered far-field pattern of apertures with different inner shapes. Because of the chaotic properties of high-Q cavities [20], the field results exhibit strongly statistical behaviors. The fields inside a high-Q cavity are reflected many times, thus the fields can be modeled as the superposition of random plane waves. When the Q-factor is low, the number of incident waves decreases, and the random plane wave model is no longer valid. Similar modeling approaches have been adopted for reverberation chambers (RC) in [21]. Since the analysis in this paper relies on the random plane wave model, the results are applicable only to high-Q cavities.
Considering that conventional FW simulations for electrically large cavities are time-consuming, this paper proposes an efficient approach that combines the FW simulations with Monte Carlo methods [23, 24, 25, 26, 27] to accurately obtain the statistical properties of the scattered far-field pattern, greatly accelerating the computational process. Based on the full-wave Monte Carlo (FWMC) method, the effect of the inner shape on the scattered far field is evaluated. This nonideal effect could be interesting and we examine this in detail in the following sections. An actual RC is also modeled and simulated for comparison with the FWMC method-based results.
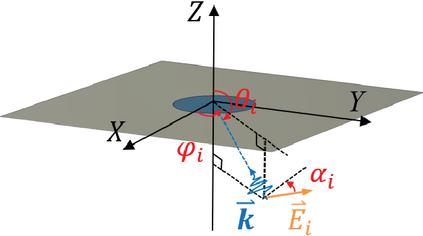
Figure 2 Schematic of a plane wave inside the cavity incident on an ideal aperture (zero thickness).
The theoretical derivation is detailed in section 2 and the numerical validations are given in section 3. Conclusions are summarized in section 4.
2 THEORY
A schematic plot is illustrated in Fig. 1, an electrically large aperture with surface area (projected in normal direction) is on an electrically large high-Q cavity. Stirrers inside the cavity are used to redistribute the EM field. We evaluate the scattering cross-section of the aperture in the far-field region under illumination by an EM wave propagating into the cavity along the z-axis. The radiated power of the Rx antenna is , the gain of the Rx antenna is . Assuming the high-Q cavity is well stirred, the E-field is statistically uniform and isotropic. For the incident power , the mean E-field [21] is
| (2) |
where represents the average value of E-field over all polarizations in the high-Q cavity, denotes the mean value of the ensemble E-fields, Q is the Q-factor of the cavity, is the angular frequency, is the permittivity of the dielectric in the cavity, and is the volume of the cavity.
It can be seen that the becomes the radiated source for the scattered far field of the aperture in Fig. 1. However, FW simulations of the within the electrically large high-Q cavity costs much time and occupies large computing resources. To efficiently obtain the scattered far field, multiple random plane waves are used to simulate the random scattering environment for the aperture of the high-Q cavity. Each plane wave is
| (3) |
where i denotes the index of the plane wave, is a complex vector whose initial amplitude and phase have Rayleigh and uniform distribution respectively, is the wave vector of the plane wave (k is the wave number and denotes the unit direction vector of the plane wave), and represents the position vector pointing from the origin (or the source reference point) to the observation point in space. For N plane waves, we have
| (4) |
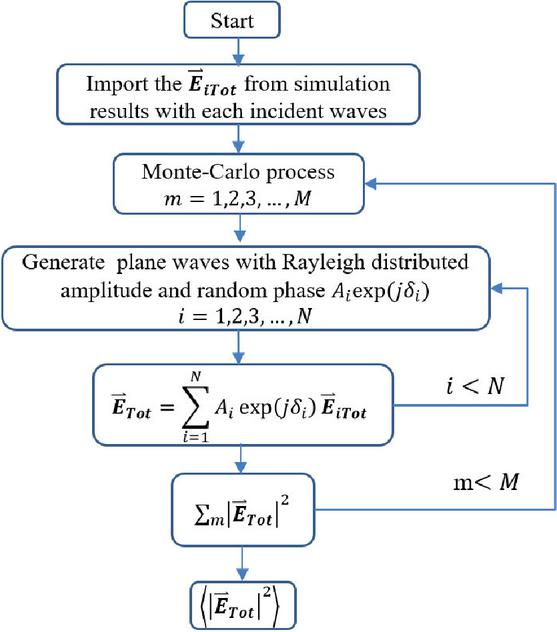
Figure 3 Workflow of the Monte Carlo simulation.
For each plane wave, according to the angular definitions in Fig. 2, the EM wave propagation direction can be expressed as
| (5) | |
| (6) | |
| (7) |
and the unit direction vector of E-field can be expressed as
| (8) | |
| (9) | |
| (10) |
where is the polar angle, is the azimuth angle, is the polarization angle of E-field, and and represents the TE and TM waves, respectively. Based on the descriptions above, the mean E-field in (2) can also be written as .
When each plane wave is incident on the aperture, the total field for the aperture of the high-Q cavity, including the scattered field and incident field, can be simulated using the FDTD method in CST (normalized to 1 V/m incident wave). When multiple plane waves are incident on the aperture simultaneously, the total E-field in the scattered far-field region for the aperture can be calculated by [19]
| (11) |
where is Rayleigh distributed amplitude, is uniform distributed phase, and N is the number of the plane waves.
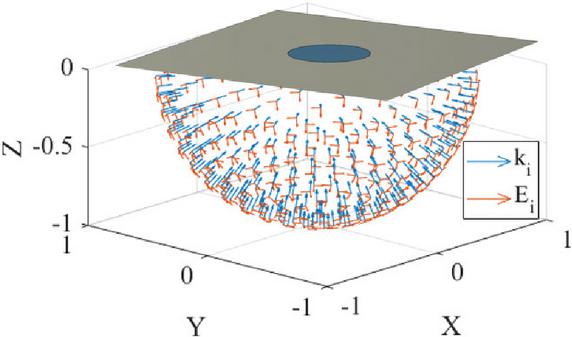
Figure 4 Schematic of the plane wave sources in an ideal aperture.
After finishing the FW simulation for each incident wave, the total field data in the scattered far-field region are saved in the memory. To estimate the scattered far field of the aperture on the high-Q cavity accurately and quickly, the simulated results are imported into Monte Carlo simulations. The Monte Carlo simulation is performed to simulate a well-stirred high-Q cavity, as illustrated in Fig. 3. The number of Monte Carlo iterations is denoted as M, which corresponds to the number of independent stirrer positions. According to the statistical field distributions described in [21], the magnitude of any E-field component inside a well-stirred cavity, such as , follows a Rayleigh distribution and its squared magnitude follows a Gamma distribution. To reproduce the EM environment inside a well-stirred cavity, the amplitudes of the random incident plane waves in the Monte Carlo process are generated using a Rayleigh distribution. In the next section, the scattered far-field patterns of the different apertures are shown and compared with the theoretical values.
3 SIMULATION RESULTS AND COMPARISONS
In FWMC simulations, 610 plane wave sources, shown in Fig. 4, are used to generate plane waves over and . Each plane wave contains two polarizations with and . Therefore, a total of plane waves are simulated to obtain scattered near field and far field (the magnitude of the plane waves is normalized to 1 V/m). In this paper, only a single frequency point at 1 GHz is considered, which corresponds to a wavelength of 300 mm. The simulation frequency ranges from 0.7 GHz to 1.3 GHz so that the frequency of interest lies at the center of simulated frequency band.
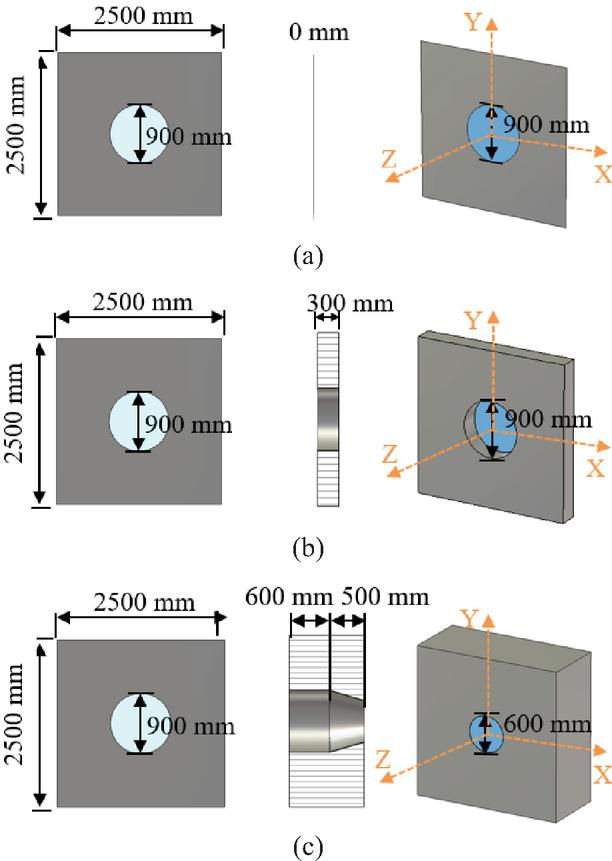
Figure 5 (a) Ideal aperture, (b) aperture with tubular inner shape, (c) aperture with conical inner shape.
After FW simulations, a Monte Carlo simulation is performed with to emulate a well-stirred cavity, as illustrated in Fig. 3. In each iteration, a new sequence of and is generated. To obtain the scattered results based on the normalized squared magnitude, we set to 3, yielding . Considering the superposition of the power density for N plane waves, the amplitude in (11) is randomly generated by [22]
| (12) |
where . The are uniform distributed over . Upon completing the Monte Carlo simulations, the mean scattered near field and scattered far field of the aperture on an electrically large high-Q cavity can be obtained.
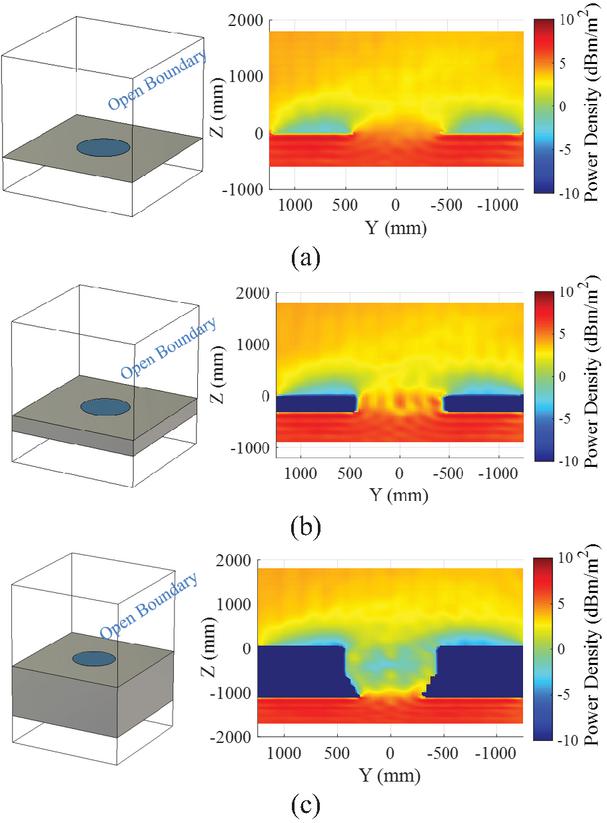
Figure 6 Simulated setting and average power density of the scattered near field at 1 GHz on the yoz plane for the aperture with (a) ideal, (b) tubular and (c) conical inner shape.
3.1 Simulated results
Considering the inner shape of the aperture on the high-Q cavity, the three models shown in Fig. 5 are simulated to obtain the scattered far field, which includes an ideal aperture, an aperture with tubular inner shape and an aperture with conical inner shape, respectively. The dimension of the aperture metal ground is . As shown in Fig. 6, open boundaries (perfectly matched layers) are attached to the edge of the planar model. Thus, the simulation boundaries can be approximated as an infinite plane, which reduces the influence of reflected waves on the scattered field. The simulated region is limited to . The diameter of the ideal aperture is , which is . For the aperture with tubular inner shape, the depth of the tubular inner shape is 300 mm. The other aperture has a conical inner shape, whose depth is 500 mm and bottom diameter is 600 mm ().
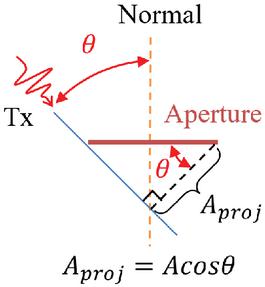
Figure 7 Schematic of the aperture’s projected area.
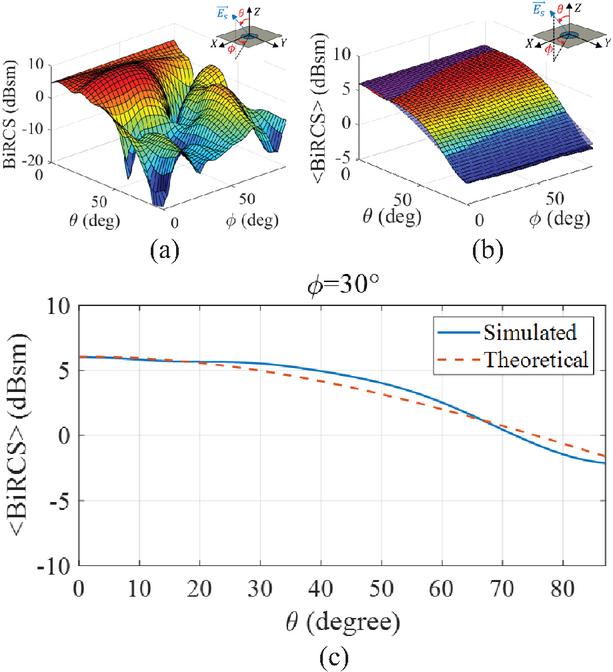
Figure 8 (a) Typical 3D pattern of the scattered far field at one stirrer position, (b) 3D pattern of the mean scattered far field, (c) simulated and theoretical BiRCS over at 1 GHz from the ideal aperture.
To estimate the effect of the apertures’ inner shape on the incident wave, the scattered near fields at 1 GHz on the yoz plane of the different apertures are simulated under all incident plane waves. Figures 6 (a)–(c) show the average power density of the scattered near field calculated using the FWMC method. It can be seen that the scattered near field within the working volume of the RC is uniform. Although the apertures are geometrically symmetrical, the scattered near fields shown in Fig. 6 are not fully symmetrical because of the numerical discretization in simulation.
The average power density distributions surrounding the ideal apertures differ significantly from those for apertures with various inner geometries. In the case of an aperture with a tubular inner shape, the propagation of EM waves through the aperture is marginally affected. In contrast, the aperture with a conical inner shape significantly impacts EM wave propagation. The average power density in the central region of the aperture decreases from with a tubular inner shape to with a conical inner shape. Furthermore, the conical geometry causes the electric field to concentrate near the metal boundary, thereby limiting the propagation of electromagnetic waves toward the edge of the aperture.
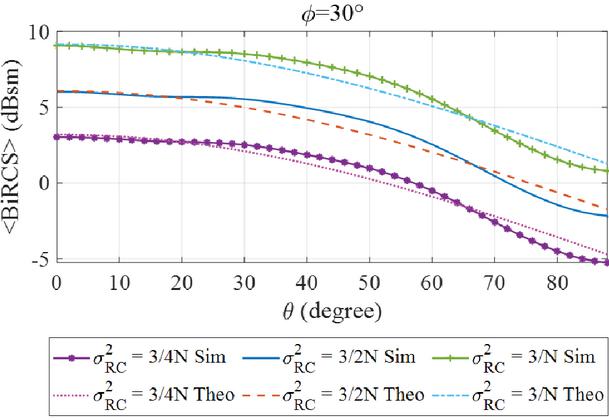
Figure 9 BiRCS of the ideal aperture for different over .
In the far-field region, when the aperture is observed from different directions, its projected area varies with the observation angle of Rx port, as can be seen in Fig. 7. Because the projected area of the aperture varies according to a cosine function, the energy radiates or scatters in different directions also following this cosine pattern. As a result, the scattered far field over the hemispherical surface exhibits a cosine distribution. As mentioned in section II, the incident wave from Tx port propagates into the cavity along the z-axis, thus and (1) can be simplified as
| (13) |
where is the observation angle for the Rx antenna.
Figure 8 (a) illustrates the 3D pattern of the scattered far field at a single stirrer position from the ideal aperture. The 3D pattern of the mean scattered far field is shown in Fig. 8 (b). It can be observed that the patterns at a single rotation position exhibit variations with respect to the angle . Moreover, these variations are more pronounced than those of the mean pattern. The average bistatic RCS at is compared with the theoretical prediction, as depicted in Fig. 8 (c). It can be seen that the simulated closely approximates the theoretical prediction () over to . As for ranging from to , the estimated value exhibits minor fluctuations around the theoretical value.
Because the scattered far-field pattern of an aperture illuminated by light is sensitive to the statistical field, the sensitivity of the average scattered far field for an aperture on a high-Q cavity is also evaluated. Figure 9 compares simulated and theoretical of the ideal aperture for three different values of and . As expected, the value of increases with larger , since the magnitude of E-field inside the cavity depends on . Meanwhile, the overall distribution shape remains unchanged for different values of , which can be attributed to the uniformity of the field inside the high-Q cavity.
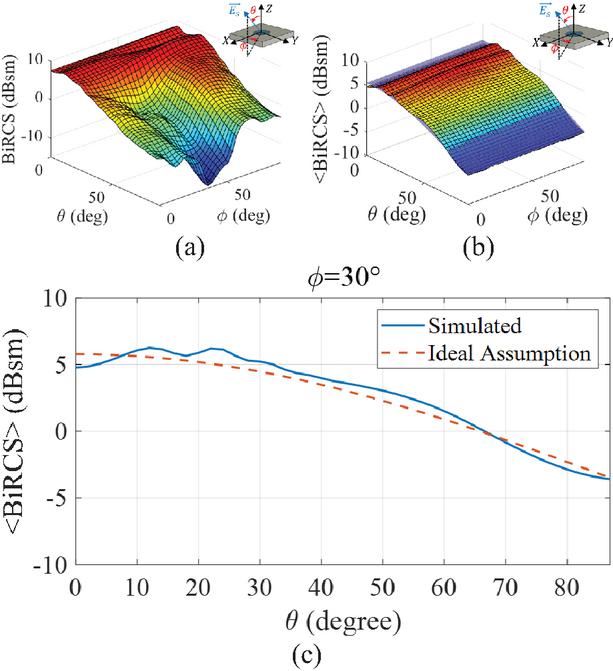
Figure 10 (a) Typical 3D pattern of the scattered far field at one stirrer position, (b) 3D pattern of the mean scattered far field, (c) simulated and ideal assumption BiRCS over at 1 GHz from the aperture with a tubular inner shape.
Figure 10 (a) presents the 3D pattern of the scattered far field from an aperture with a tubular inner shape at a single stirrer position. The 3D pattern of the mean scattered far field is shown in Fig. 10 (b). It can be observed that the tubular structure leads to a high in the center region of the aperture, indicating a concentration of mean scattered far-field energy in this area. As illustrated in Fig. 10 (c), exceeds the ideal assumption () within the range to , while it falls below the ideal assumption over to .
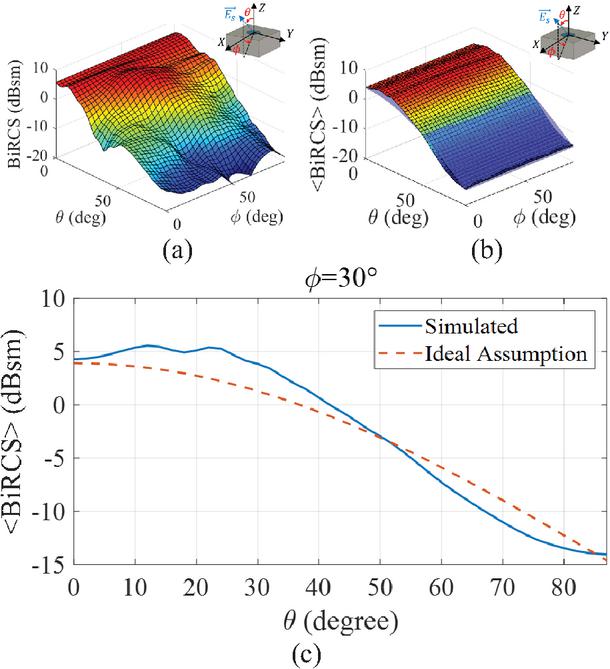
Figure 11 (a) Typical 3D pattern of the scattered far field at one stirrer position, (b) 3D pattern of the mean scattered far field, (c) simulated and ideal assumption BiRCS over at 1 GHz from the aperture with a conical inner shape.
For the aperture with a conical inner shape, the 3D patterns of the scattered far field at a single stirrer position and mean scattered far field are shown in Figs. 11 (a) and 11 (b). It can be found that the overall are less than those of other apertures, especially for the values over to . This phenomenon indicates that the reduction of the inner cross-section diameter from 900 mm to 600 mm has resulted in a decrease of the mean scattered far field. Additionally, this finding also corroborates the simulated scattered near field results presented in Fig. 6 (c). Figure 11 (c) shows a comparison between the simulated values and ideal assumption at . It can be seen that the mean scattered far field in the edge region of the aperture (approximately ) with a conical inner shape is lower than the ideal assumption. For ranging from to , the simulated value is higher than ideal assumption, while for from to , it is lower than the ideal assumption.
From the results, the underlying physical mechanisms can be explained from several perspectives. First, for the ideal aperture, the energy distributed over the hemispherical surface follows a cosine pattern because the effective projected area of the aperture varies with the outside incident angle, as discussed previously. Second, for the tubular aperture, the finite thickness behaves like a short waveguide section. This waveguide-like structure alters the cosine-shaped projection effect and forces the EM wave inside the cavity to propagate through the tube, resulting in a scattered far field that is concentrated on the center region of the aperture. Third, for the conical aperture, the reduced inner diameter further concentrates the scattered far field towards the aperture center. In addition, the free space originally located at the aperture peripheral region is replaced by the metallic wall, which enhances shielding effects and suppresses radiation from the edge of the aperture. As a result, the scattered far-field pattern amplitude decreases significantly in the range of approximately to .
3.2 Comparisons
An RC with different apertures is simulated to verify the calculated results using the proposed method. The RC model with dimensions is shown in Fig. 12 (a). Two stirrers are applied to redistribute the E-field inside the RC; the frequency of interest is set at 1 GHz. An aperture of 900 mm in diameter is hollowed on the metal wall. The schematic of the incident and scattered waves is illustrated in Fig. 12 (b).
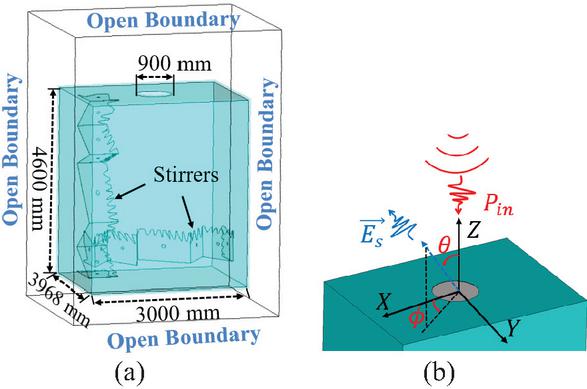
Figure 12 (a) Simulated setup of the RC model with an ideal aperture, (b) Schematic of the incident and scattered waves for RC with an ideal aperture.
In this paper, the scattered far field is considered to originate from the leakage E-field of an electrically large cavity. Therefore, the proposed method is applied to a metallic cavity with internally stored energy, under the assumption that no surface currents exist outside the cavity. Figure 12 (b) shows the schematic of the incident and scattered waves for the RC with an ideal aperture. It can be observed that incident plane waves propagate along the z-axis to excite resonant electric fields inside the cavity. To eliminate the influence of reflective waves on the scattered far field, radio absorbing materials (RAM) are coated on the top metal surface of the RC.
Table 1 Comparison of simulated requirements between FW simulations and FWMC method
| Method | Scenarios | Total Time | Peak |
| Memory | |||
| FW | RC with apertures | 63 hours | 29.8 GB |
| FWMC | Apertures | 23.91.5 hours | 0.6 GB |
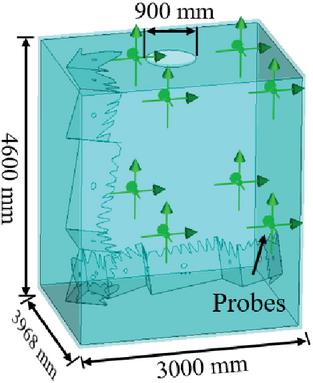
Figure 13 FU simulated setup of the RC with an ideal aperture.
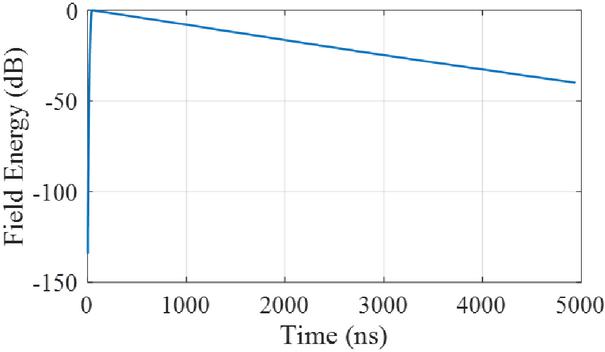
Figure 14 Simulated field energy in the RC at 1 GHz.
The MLFMM in CST is applied to simulate the scattered near field and far field. Twelve stirrer positions with a step of are used to generate a uniform field distribution. FW simulation with MLFMM is repeated for each stirrer position. The iterative stopping criterion of the simulation is set as 40 dB, meaning the simulation terminates only when the residual error converges below this threshold. The lower bound of the cell number per wavelength is higher than 10 and the edges have been refined. The number of total cells is 554,771. Since the simulation results have been verified for the ideal cases, when the same settings are applied to similar scenarios, the results should also be reliable. The boundaries are set to open boundary, as shown in Fig. 12 (a). The simulations for the RC with different apertures are accelerated using an NVIDIA GPU 4060Ti (8 GB). The computer is equipped with an Intel Core (TM) i5-13600KF CPU and 32 GB of running memory.
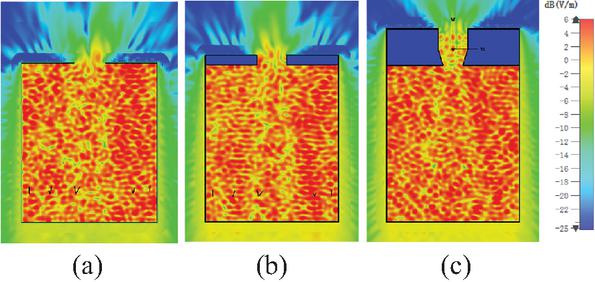
Figure 15 Simulated scattered near field of the RC with (a) ideal, (b) tubular and (c) conical aperture at a typical stirring position.
Based on the identical simulation conditions described above, Table 1 summarizes the total processing time (including both FW simulation and Monte Carlo post-processing) and the peak memory requirements for the three apertures using conventional FW simulation and the proposed FWMC method. It can be observed that the FWMC method accelerates overall simulation process and significantly reduces the required peak memory. Moreover, as the number of stirring position increases, the computational burden of the FW simulations grows rapidly. Consequently, the proposed FWMC approach provides an efficiency and accurate alternative for estimating the scattered far field of apertures on electrically large cavities.
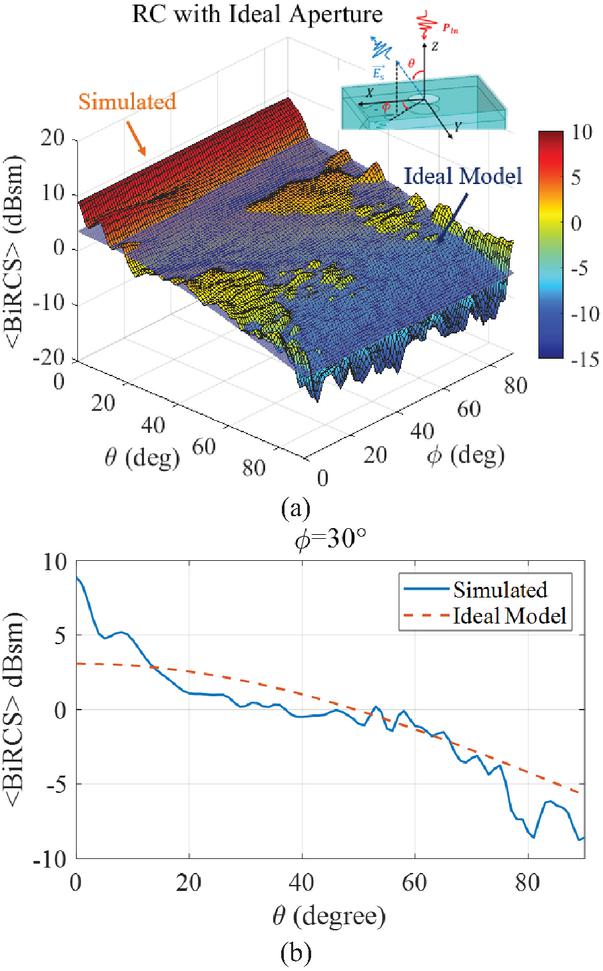
Figure 16 (a) 3D patterns of simulated BiRCS and ideal model over the ; (b) simulated BiRCS and ideal model over at 1 GHz from RC with an ideal aperture.
To validate the FU (field uniformity) of the RC, the simulation setup is configured according to IEC 61000-4-21 [28], as shown in Fig. 13. Eight E-field probes are placed on the perimeter of the working volume to measure the , and components. The working volume is defined as the region located at least away from the stirrers and chamber walls. The FU can be calculated by
| (14) | |
| (15) |
where is the simulated E-field at probe location m (ranging from 1 to 8) along isotropic axis n (ranging from 1 to 3, corresponding to the x, y, and z directions, respectively). is the arithmetic mean of the maximum E-field (in V/m) across all probe axes and stirrer positions. Using the simulated E-field data from 12 stirrer positions and applying (14)–(15), the FU of the RC with an ideal aperture at 1 GHz is calculated to be 1.588 dB, which satisfies the FU limit of 3 dB at 1 GHz as required by IEC-61000-4-21. Besides FU, the field energy in the RC at 1 GHz is simulated and shown in Fig. 14. According to [29], the Q-factor and time constant of the RC can be calculated from the field energy
| (16) | |
| (17) |
where is the slope of the field energy decay. Based on the simulated results in Fig. 13, ns and at 1 GHz.
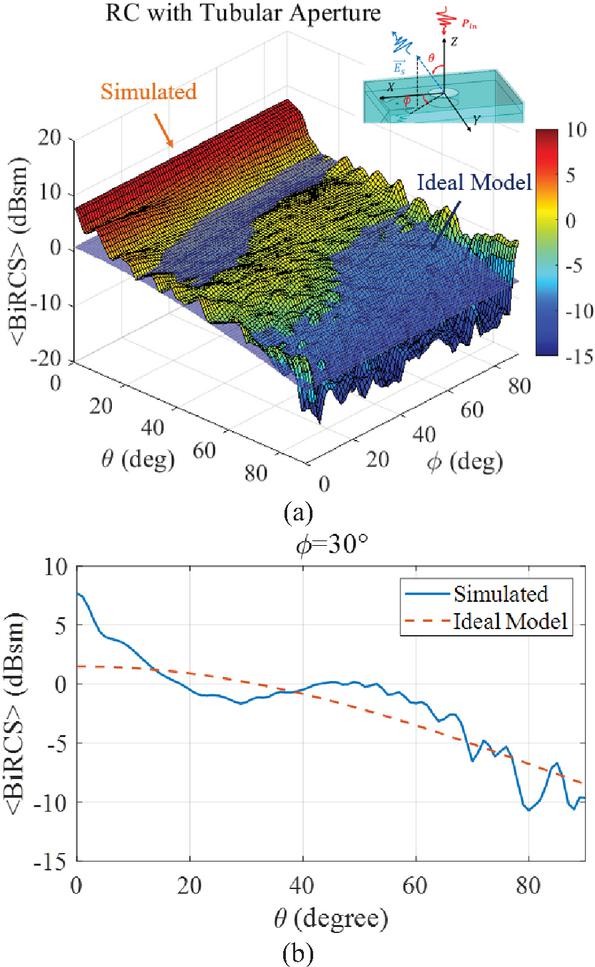
Figure 17 (a) 3D patterns of simulated BiRCS and ideal model over the ; (b) simulated BiRCS and ideal model over at 1 GHz from the RC with a tubular aperture.
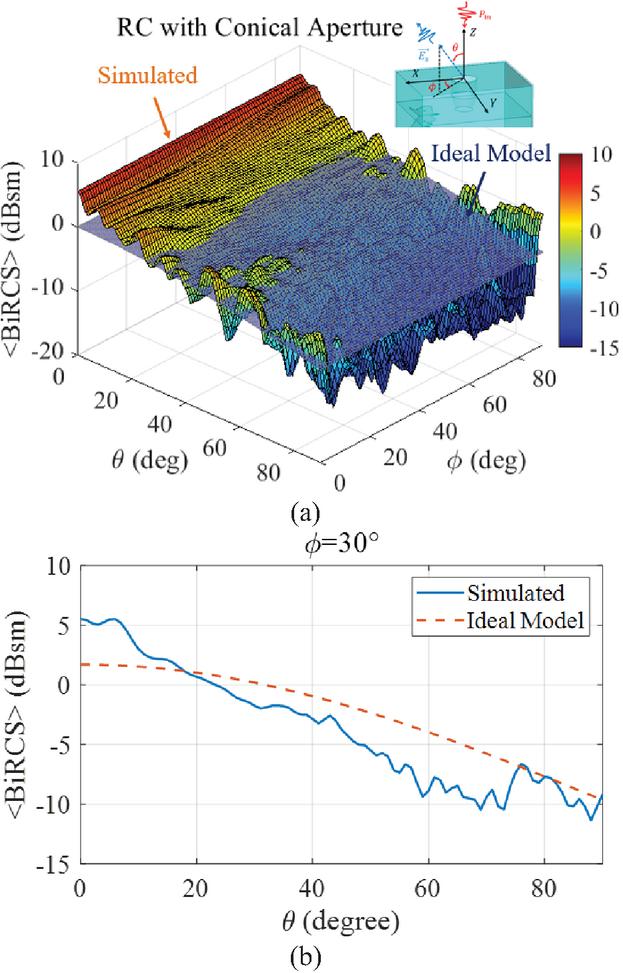
Figure 18 (a) 3D patterns of simulated BiRCS and ideal model over the ; (b) simulated BiRCS and ideal model over at 1 GHz from the RC with a conical aperture.
The scattered near fields at a typical stirring position of the RC with three inner shapes are shown in Fig. 15. It can be observed that the inner shape has a significant effect on the EM waves propagation through the aperture. from 12 stirrer positions for different apertures are illustrated in Figs. 16–18. Although the outer surface of the RC is coated with RAM, reflections from bottom metal surface of the RC cannot be completely eliminated. These reflections enhance the scattered far field over . For , the RAM effectively reduces the scattered near field strength, as shown in Fig. 15, resulting in a scattered far field lower than the ideal model () in section 3.1. With the increase of the aperture’s depth, it can be found that exhibits scattered far-field concentrations compared with the ideal model. Meanwhile, the overall scattered level of decreases due to the reduction in the aperture’s inner cross-section diameter. These variations are consistent with the results presented in section 3.1, verifying the feasibility of the proposed method. Furthermore, compared with the conventional RC model method, the proposed method significantly reduces the simulation time, which improves the efficiency for evaluating the scattering cross-section of different apertures in actual applications.
4 CONCLUSIONS
Based on the statistical properties of the high-Q cavity and the full-wave simulation results, we have obtained the mean scattered far-field pattern of apertures with different inner shapes on a high-Q cavity by using the FWMC method. The mean scattered far-field pattern of the ideal aperture of the high-Q cavity agrees with the theoretical values well.
However, for general cases, the apertures of the cavity have different inner shapes, which will limit the incident wave directions (plane-wave spectrum) from the cavity and will affect propagation of the EM waves. Therefore, we estimated the scattered far field of the different apertures as shown in Fig. 5. From the analysis, it can be concluded that the cosine roll-off is only an approximation for ideal cases. For apertures with specific shapes, the scattered far fields exhibit distribution characteristics distinct from the cosine roll-off, such as energy concentration at the center and attenuation at the edges of the aperture. As for the different apertures, the general FWMC simulation can give a numerical description of the distribution of the scattered far field. A comparison of simulation time between the proposed method and conventional RC model method verifies the efficiency of the proposed method.
ACKNOWLEDGMENT
This work was supported in part by the Foundation of National Key Laboratory of Science and Technology on Space Microwave under Grant 2018SSFNKLSMT-09 and in part by the Beijing Institute of Radio Metrology and Measurement under Grant JLKG2024001A002.
REFERENCES
[1] X. Mei, Y. Zhang, and H. Lin, “A new efficient hybrid SBR/MoM technique for scattering analysis of complex large structures,” in IEEE International Conference on Computational Electromagnetics, Hong Kong, China, pp. 306–308, 2015.
[2] E. F. Knott, Radar Cross-Section Measurements. Berlin: Springer Science & Business Media, 2012.
[3] M. H. Ahmad and D. P. Kasilingam, “Spectral domain fast multipole method for solving integral equations of electromagnetic wave scattering,” Progress in Electromagnetics Research, pp. 121–131, 2019.
[4] N. Oswald and D. R. Monismith, “Radar cross-sections of objects with simulated defects using the parallel FDTD method,” in IEEE Symposium on Electromagnetic Compatibility, Signal Integrity and Power Integrity (EMC, SI & PI), Long Beach, CA, USA, pp. 12–17, 2018.
[5] S. Stewart, S. Moslemi-Tabrizi, T. J. Smy, and S. Gupta, “Modified explicit finite-difference time-domain method for nonparaxial wave scattering from electromagnetic metasurfaces,” IEEE Antennas and Wireless Propagation Letters, vol. 18, no. 6, pp. 1238–1242, 2019.
[6] Y. Wu, Z. Chen, W. Fan, J. Wang, and J. Li, “A wave-equation-based spatial finite-difference method for electromagnetic time-domain modeling,” IEEE Antennas and Wireless Propagation Letters, vol. 17, no. 5, pp. 794–798, 2018.
[7] H. Zhao and Z. Shen, “Fast wideband analysis of reverberation chambers using hybrid discrete singular convolution-method of moments and adaptive frequency sampling,” IEEE Transactions on Magnetics, vol. 51, no. 3, pp. 1–4, 2015.
[8] D. Dault and B. Shanker, “An interior penalty method for the generalized method of moments,” IEEE Transactions on Antennas and Propagation, vol. 63, no. 8, pp. 3561–3568, 2015.
[9] X. Cao, M. Chen, X. Wu, M. Kong, J. Hu, and Y. Zhu, “Dual compressed sensing method for solving electromagnetic scattering problems by method of moments,” IEEE Antennas and Wireless Propagation Letters, vol. 17, no. 2, pp. 267–270, 2018.
[10] S. M. Rao, “A true domain decomposition procedure based on method of moments to handle electrically large bodies,” IEEE Transactions on Antennas and Propagation, vol. 60, no. 9, pp. 4233–4238, 2012.
[11] T. F. Eibert and T. B. Hansen, “Propagating plane-wave fast multipole translation operators revisited – standard, windowed, gaussian beam,” IEEE Transactions on Antennas and Propagation, vol. 69, no. 9, pp. 5851–5860, 2021.
[12] H. Ling, R. C. Chou, and S. W. Lee, “Shooting and bouncing rays: Calculating the RCS of an arbitrarily shaped cavity,” IEEE Transactions on Antennas and Propagation, vol. 37, no. 2, pp. 194–205, 1989.
[13] J. Li, Y. Pan, L. Guo, Z. Ren, and K. Li, “A bi-iterative model electromagnetic scattering from a ship floating on sea surface,” in International Symposium on Antennas, Propagation and EM Theory (ISAPE), Hangzhou, China, pp. 1–4, 2018.
[14] H. Zhou, X. H. Wang, L. Xiao, and B. Z. Wang, “Efficient EDM-PO method for the scattering from electrically large objects with the high-order impedance boundary condition,” IEEE Transactions on Antennas and Propagation, vol. 70, no. 9, pp. 8242–8249, 2022.
[15] H. A. Bethe, “Theory of diffraction by small holes,” Physic Review, vol. 66, no. 7, pp. 163–182, 1944.
[16] C. Butler, Y. Rahmat-Samii, and R. Mittra, “Electromagnetic penetration through apertures in conducting surfaces,” IEEE Transactions on Antennas and Propagation, vol. AP-26, no. 1, pp. 82–93, 1978.
[17] R. F. Harrington and J. R. Mautz, “A generalized network formulation for aperture problems,” IEEE Transactions on Antennas and Propagation, vol. AP-24, no. 6, pp. 870–873, 1976.
[18] R. F. Harrington, “Resonant behavior of a small aperture backed by a conducting body,” IEEE Transactions on Antennas and Propagation, vol. AP-30, no. 2, pp. 205–212, 1982.
[19] H. T. Anastassiu, “A review of electromagnetic scattering analysis for inlets, cavities and open ducts,” IEEE Antennas and Propagation Magazine, vol. 45, no. 6, pp. 27–40, 2003.
[20] K. Selemani, J. B. Gros, E. Richalot, O. Legrand, O. Picon, and F. Mortessagne, “Comparison of reverberation chamber shapes inspired from chaotic cavities,” IEEE Transactions on Electromagnetic Compatibility, vol. 57, no. 1, pp. 3–11, 2015.
[21] D. A. Hill, Electromagnetic Fields in Cavities: Deterministic and Statistical Theories. Hoboken, NJ: Wiley-IEEE Press, 2009.
[22] Q. Xu, F. Tian, X. Chen, L. Xing, Y. Zhao, and Y. Huang, “Estimating the scattering cross-section of an electrically large aperture on a high-Q cavity,” IEEE Antennas and Wireless Propagation Letters, vol. 22, no. 12, pp. 2960–2964, 2023.
[23] Q. Xu, K. Chen, X. Shen, and Y. Huang, “Simulating boundary fields of arbitrary-shaped objects in a reverberation chamber,” Applied Computational Electromagnetics Society (ACES) Journal, vol. 36, pp. 1132–1138, 2021.
[24] J. M. Ladbury, “Monte Carlo simulation of reverberation chambers,” in Gateway to the New Millennium. 18th Digital Avionics Systems Conference. Proceedings, pp. 10.C.1–10.C.1, 1999.
[25] B. Plaum, “Estimation of the effects of spurious modes in linear microwave systems using a Monte Carlo algorithm,” IEEE Journal of Microwaves, vol. 3, no. 3, pp. 1061–1067, 2023.
[26] P. Wijesinghe, U. Gunawardana, and R. Liyanapathirana, “Combined flat histogram Monte Carlo method for efficient simulation of communication systems,” IEEE Communications Letters, vol. 16, no. 1, pp. 80–82, 2012.
[27] R. Yuan, J. Ma, P. Su, Y. Dong, and J. Cheng, “Monte Carlo integration models for multiple scattering based optical wireless communication,” IEEE Transactions on Communications, vol. 68, no. 1, pp. 334–348, 2020.
[28] IEC 61000-4-21, Electromagnetic compatibility (EMC) – Part 4-21: Testing and measurement techniques – Reverberation chamber test methods, IEC Standard, Ed 2.0, 2011-01.
[29] Q. Xu and Y. Huang, Anechoic and Reverberation Chambers: Theory, Design, and Measurements. Hoboken, NJ: Wiley-IEEE Press, 2018.
BIOGRAPHIES

Feng Tian received the B.Eng. degree from University of Electronic Science and Technology of China, Chengdu, China, in 2008, and received M.Eng. degree from CETC 14th Institute, Nanjing, in 2011. He is currently a Ph.D. student at the College of Electronic and Information Engineering, Nanjing University of Aeronautics and Astronautics, China. His research interests include power amplifier, EMC, and antennas.

Feng Fang received the B.Eng. and M.Eng. degrees in microwave technology from the Nanjing University of Aeronautics and Astronautics, Nanjing, China, in 2020 and 2023, respectively. He is currently working toward the Ph.D. degree in electromagnetic field and microwave technology from Nanjing University of Aeronautics and Astronautics. His main research interests include patch antenna, antenna array, reverberation chamber, computational electromagnetics and statistical electromagnetics, Over-the-Air (OTA) testing and electromagnetic compatibility (EMC).

Bo Peng received the master’s degree in physical electronics from the Institute of Electrics, Chinese Academy of Sciences, Beijing, China, in 2012. He is currently with the Beijing Institute of Radio Metrology and Measurement, Beijing. His research interests mainly include electromagnetic field and microwave technology.

Yongjiu Zhao received the M.Eng. and Ph.D. degrees in electronic engineering from Xidian University, Xi’an, China, in 1990 and 1998, respectively. Since March 1990, he has been with the Department of Mechano-Electronic Engineering, Xidian University, where he was a professor in 2004. From December 1999 to August 2000, he was a Research Associate with the Department of Electronic Engineering, The Chinese University of Hong Kong. His research interests include antenna design, microwave filter design, and electromagnetic theory.

Qian Xu received the B.Eng. and M.Eng. degrees in electrical engineering and electronics from the Department of Electronics and Information, Northwestern Polytechnical University, Xi’an, China, in 2007 and 2010, and the Ph.D. degree in electrical engineering from the University of Liverpool, UK, in 2016. He was as an RF engineer in Nanjing, in 2011, an Application Engineer with CST Company, Shanghai, in 2012. He is currently an Associate Professor with the College of Electronic and Information Engineering, Nanjing University of Aeronautics and Astronautics, Nanjing. His work at University of Liverpool was sponsored by Rainford EMC Systems Ltd (now part of Microwave Vision Group) and Centre for Global Eco-Innovation. He has designed many chambers for the industry and has authored the book Anechoic and Reverberation Chambers: Theory, Design, and Measurements (Wiley-IEEE, 2019). His research interests include statistical electromagnetics, reverberation chamber, EMC, and over-the-air testing.
ACES JOURNAL, Vol. 40, No. 12, 1186–1197
DOI: 10.13052/2025.ACES.J.401206
© 2026 River Publishers