Numerical Analysis on the Equivalent Physical Temperature Estimation for Pyramidal Microwave Calibration Targets Based on Infrared Imagery
Ming Jin1, Jiacheng Qian2, and Miaomiao Peng1
1College of Information Science and Technology
Beijing University of Chemical Technology, Beijing 100029, China
jinming@mail.buct.edu.cn, 3120256108@bit.edu.cn
2 College of Mathematics and Physics
Beijing University of Chemical Technology, Beijing 100029, China
jcqian99@qq.com
Submitted On: October 13, 2025; Accepted On: March 16, 2026
Abstract
Pyramidal microwave calibration targets (MCT) are widely applied in on-orbit and pre-launch radiometric calibrations due to its compact size. However, it is well known that array-shaped MCT suffers from the temperature gradient at tips that leads to radiating brightness temperature () bias. Therefore, it is vital to estimate the equivalent physical temperature of the MCT given the tip temperature gradient for the bias correction. In this work, the authors numerically investigate the estimation based on possible temperature measurement techniques, specifically considering a combination configuration of platinum resistor temperature (PRT) detector at the metal base and the infrared camera detector for the tipbottom temperature difference. By considering the possible variation of coating material parameters and thermal measurement errors, it is possible to evaluate estimation accuracy. Numerical results indicate that this temperature measurement configuration can lead to accurate estimation at the level of 0.1 K . Factors that notably impact on the estimation accuracy are discussed. This investigation can be a direct reference for MCT correction applications in the pre-launch calibration process.
Index Terms: Brightness temperature estimation, microwave calibration target, pre-launch calibration.
I. INTRODUCTION
The microwave calibration target (MCT), specifically the array-shaped coated sharp pyramidal target, is widely applied in radiometric payloads [1, 2, 3]. The array-shaped MCT has the advantage of compactness in size and weight, which is beneficial for space-borne or air-borne applications [2, 3, 4], compared to other types of MCT such as cavity MCT [5, 6]. However, the key problem of the array-shaped MCT in calibration application is that a temperature gradient exists at the tip region, and it leads to radiated brightness temperature () bias.
As the function of the MCT is to provide an accurate referencing , efforts has been made on estimating and determining the radiation performance of the MCT. After a lot of investigations were performed upon the emissivity issue of the MCT, such as wide-band reflectivity spectrum properties [7], wideband high-emissivity design strategy [8, 9], and emissivity measurement methodology [10, 11, 12, 13, 14], research focus has been altered towards the overall performance considering temperature gradient at tips. In [15], Schröder et al. proposed a numerical framework to calculate the radiated from the arrayshaped MCT for space-borne application. In [16], Virone et al. calculated the radiated for a cold source in the vacuum-thermal calibration scenario. It is evidenced in numerous works that the temperature gradient becomes the primary source of bias in general cases over the residual reflectivity from the array-shaped MCT. In [17, 18], Jin et al. proposed a BTbias suppressed unit kernel design of array-shaped MCT based on the numerical framework in [15].
In [15, 16, 17], numerical frameworks are established for numerically estimating the -bias, which offers rich information and deep understanding of -bias properties in space-borne platform deployment and prelaunch thermal-vacuum (T/V) tests. However, the key concepts of those works are estimations based on numerical simulations as a reference for practical application. For practical pre-launch tests, it is desired that the -bias can be obtained based on measurable values other than fully based on simulations. In the earlier studies in which the temperature gradient phenomenon of the array-shaped MCT was presented, infrared imagery was applied, showing the ability to capture the temperature difference between the MCT unit tips and unit valley bottoms [2, 19]. Based on the recent progress of modeling methodology, it is highly applicable to use infrared imagery to obtain temperature gradient information and to estimate -bias with numerically concluded electromagnetic information.
In this work, the authors investigate such a possibility. Specifically, the accuracy of the BT-bias estimation is investigated considering the uncertainty of MCT coating material properties, as well as the measurable temperature difference between tips and valley bottoms. The results can be a direct reference for -bias estimation in ground radiometer tests such as pre-launch T/V tests.
II. METHODOLOGY FOR ESTIMATION
Due to the typical MCT structure of 2-D array of coated sharp pyramids, the dominating factor for BTbias is the temperature gradient in the coating layers in the height dimension (along the -axis). Therefore, the simulation study for the estimation, is focused on the temperature gradient in the height dimension.
A. Theoretical description for equivalent temperature estimation
In [15, 17], it is concluded that the directional radiated from the MCT can be calculated by a crossintegration of temperature and electromagnetic absorption distribution:
| (1) |
where is temperature distribution in the coating layer and is normalized absorption rate distribution in the coating layer:
| (2) |
Here, is total reflectivity of the MCT to normal incident electromagnetic waves and is the background brightness temperature and is considered as uniform in this investigation.
Based on the former studies, it is known that the most important temperature gradient phenomenon is the tip-bottom gradient (along -direction), due to the difference of the bottom temperature of MCT and the background . Equation (1) can be simplified as:
| (3) |
Specifically, considering numerical investigations, shall be calculated by thermal simulations, and shall be calculated by electromagnetic simulations. Equation (3) can be simplified as:
| (4) |
where can be defined as the equivalent physical temperature taking count of the temperature gradient in the coating layer:
| (5) |
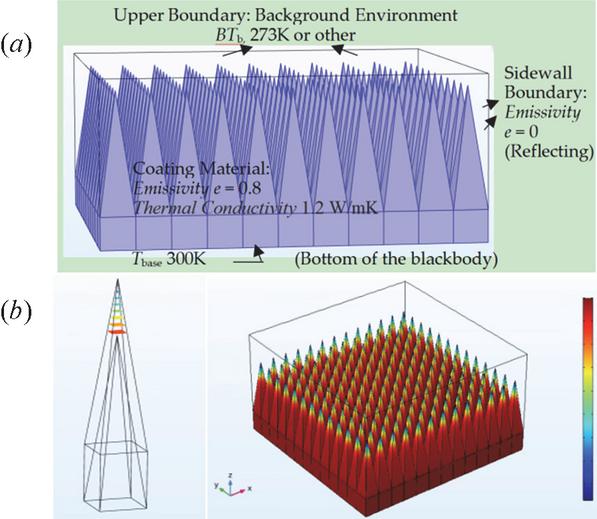
Figure 1 Simulated temperature gradient of MCT array (in front of a colder background) showing notable temperature gradient at tips.
As the accuracy of radiated from the MCT is now a research focus for the microwave radiometer calibration, it was concluded that the difference between and the ideal is the key factor for the bias, as it generates the bias ( in equation 6) notably larger than that by the reflectivity factor (), especially at current stage that the emissivity of the MCT can be above 0.9995 even 0.9999 [4, 14]. Although is a key factor for bias, unfortunately it cannot be directly measured based on current techniques. Therefore, it is important to develop estimation methodology according to the physical properties of impacting factors such as and .
| (6) |
In former studies, it was found that is proportional to the maximum temperature gradient at the tip () [15], as expressed in equation (7), and the corresponding proportionality factor can be numerically concluded. Also, it should be noted that, as the is frequency-dependent, thus so as the , then the shall be frequency dependent. Further, based on the above acknowledgement, the authors view the temperature measurements realizable in cases of ground radiometer calibration, as shown in Fig. 2, can be a practical path to estimate the with help of numerical concluded values. It is specifically suggested to measure the using the platinum resistor temperature (PRT) detector (), which is a widely-applied contact measurement technique with excellent precision. It is suggested to use an infrared imaging camera to capture the difference between the tip temperature and the bottom temperature () as the maximum temperature gradient. Based on this configuration, the aim of this study is to investigate and conclude the achievable accuracy of this potential methodology.
| (7) |
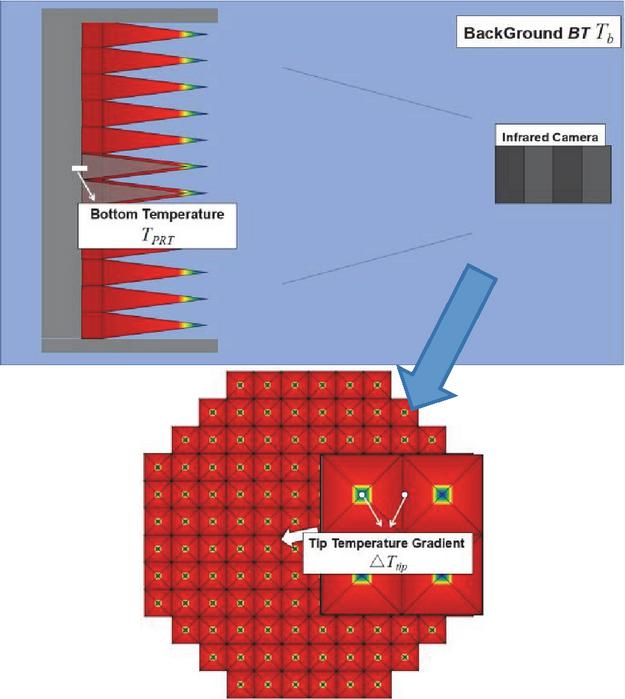
Figure 2 Configuration for MCT temperature measurement.
It should be noted that estimating the (equivalent physical temperature of the MCT) has been done in former studies based on comprehensive fullroutine numerical computations, resulting in the acknowledgement of important conclusions such as is proportional () to the maximum temperature gradient, and the proportional factor is frequency dependent. Based on that, the key aim of this work is to investigate the estimating accuracy for based on measurable temperature values. This work is an update of the measurementnumerical routine from the stage of full-numerical estimation routine. The authors believe such an update is an important reference for practical applications, showing how a good estimating accuracy can be achieved.
B. Discussion of thermal simulations
Before the estimating methodology is investigated, it is important to review the thermal simulation for the temperature distribution, as shown in Fig. 1 (a). The temperature gradient in the coating layers is due to difference between the base temperature and background BT, and it can be simulated based on a finite element software package (such as COMSOL). It should be noted that clearly different input thermal parameters, such as the background or the emissivity of the coating layer, will lead to different temperature distribution results. However, it was found that, after normalization, the average temperature distribution results are nearly the same [20], as shown in Fig. 3. This may be because of the structure of the MCT unit, where the coating layer with low thermal conductivity and high emissivity is located above the highly thermal conducting metal kernel, and such a combination of parts with opposite thermal properties leads to a stable normalized temperature distribution in the coating layer. Based on this important phenomenon, it can be inferred that as one can obtain the maximum temperature difference between the tip and the bottom, one gets the overall temperature distribution and will be able to calculate . This is the key reason that the infrared temperature camera is used for high-accuracy estimations, as the most important information is the temperature difference between the tip and bottom, as a relative value, other than the absolute temperature value at each position. The accuracy of the absolute temperature value can be counted on the PRT measurement, which is found to be promising in practical experiences.
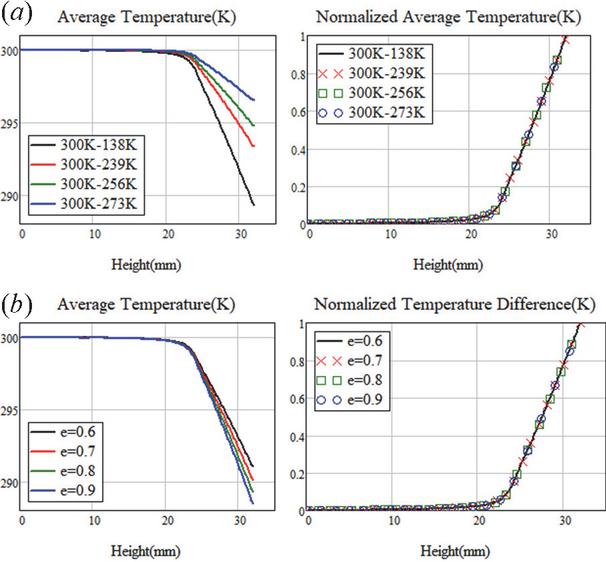
Figure 3 Calculated distributions considering different thermal parameters: (a) and (b) temperature parameters of 300 K (MCT)-138K (Environment).
Before further investigations, it is also interesting to check the possible temperature gradient at the tip. As shown in Fig. 4, the tip-bottom temperature difference results in cases of different background plotted. Considering the applications in ground T/V tests, where 300 K hot MCT is in front of a colder background or an 80 K cold MCT is in front of a warmer background, the range of 30–160 K base-background temperature difference will leads to the range of 3–11 K base-tip temperature difference, showing a non-linear projection relationship. The considered upper-range of the base-tip temperature difference is 12 K, which is sufficient for the reference purpose.
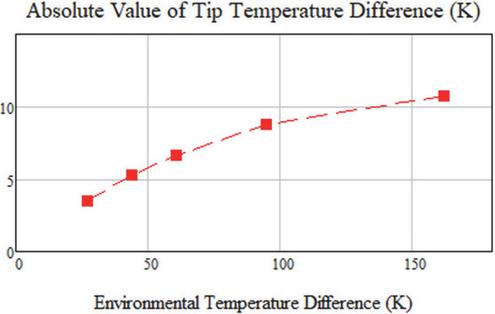
Figure 4 Calculated tip-bottom temperature difference versus environmental temperature difference (K).
C. Discussion of electromagnetic simulations
Electromagnetic simulations are conducted in the unit level to obtain the local absorption rate distribution of . Specifically, based on the periodic boundary condition, one single unit is included in the computation domain of Finite Difference Time Domain (FDTD), where a plane-wave excitation is illuminating toward the unit along the z -direction and the total reflectivity and local absorption rate can be recorded [17, 18]. It should be noted that is very hard to actually measure, and numerical calculation is necessary. The electromagnetic parameters of the coating layer material, such as the dielectric constant (), and the magnetic permeability (), will directly impact on the pattern of . In practical applications, the uncertainty of the measurement, as well as the heterogeneity in the coating layer, will have negative impact on the accuracy of the calculated in the process of estimation. Therefore, before the overall investigation of estimation accuracy can be performed, the uncertainty of due to the uncertainty of shall be investigated.
III. ACCURACY ASSESSMENT FOR ESTIMATION
In this section, the numerical results are presented and discussed for the assessment of the estimation accuracy.
A. Uncertainty of due to electromagnetic parameter variation
Uncertainty of the of the coating layer material will lead to variation of the then the counted . For this issue, the authors set up the randomly distributed at different levels of standard derivation error, and performed 10 rounds of simulations to count the resulted . For each random sample, is calculated and integrated with for , then as in equation (8). The authors considered other factors such as different frequency and different unit size, as in Tables 1 and 2. The considered frequencies, , , are the most popular frequency channels applied in the radiometer payloads, and the performance of the MCT at those frequency points are favored by radiometer developers:
| (8) |
Table 1 Geometry parameters for MCT
| Case | Period | Height | Coating |
| to Period | Thickness | ||
| Case 1 | 6.0 mm | 1.0 mm | |
| Case 2 | 7.5 mm | 1.0 mm |
Table 2 Considered coating material electromagnetic parameters at different frequencies
| Frequencies | Dielectric | Magnetic |
| Constant | Permeability | |
| 10.65 GHz | ||
| 18.7 GHz | ||
| 36.5 GHz | ||
| 89 GHz | ||
| 183.31 GHz | ||
| Note: The parameters are from the MF114 description based on the measured data in [20]. | ||
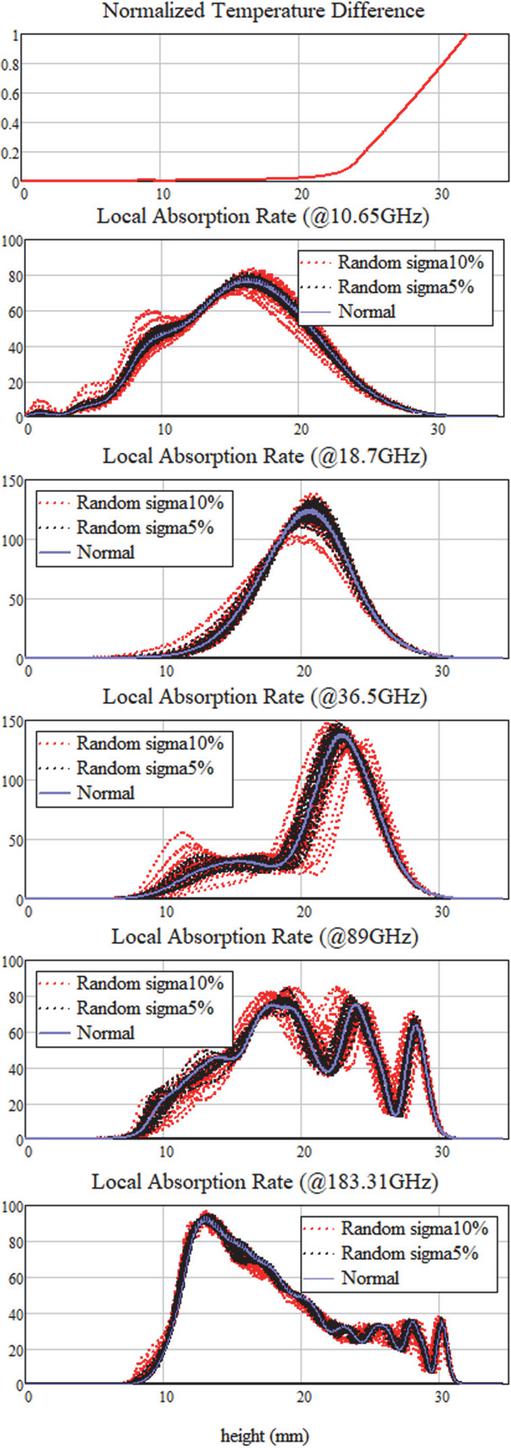
Figure 5 Calculated local absorption distribution results in cases of different frequency, considering random samples, and referenced to the average temperature distribution in the coating layer. Unit period size mm, considering random samples with 5% std in and with 10% std in .
Based on the initial parameters, the calculated results are presented in Figs. 5–7. In Figs. 5 and 6, the calculated local absorption rates are presented in cases of different unit size and at different frequencies. It is clear that is highly frequency dependent. A higher absorption rate in the tip region will lead to a higher . At 36.5 GHz and 89 GHz the counted will be relatively higher. In Figs. 5 and 6, the curves for random samples are also plotted. One can intuitively observe the influence of the uncertainty of the material , upon the which directly affects the .
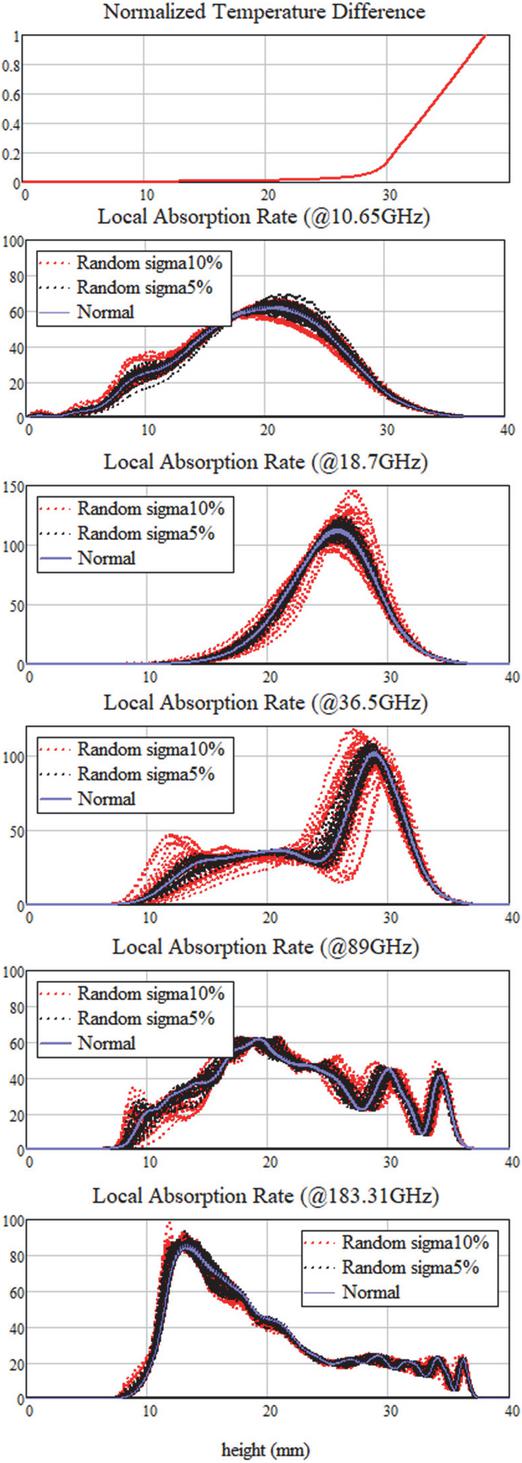
Figure 6 Calculated local absorption distribution results in cases of different frequency, considering random samples, and referenced to the average temperature distribution in the coating layer. unit period size mm, considering random samples with 5% std in and with 10% std in .
In Fig. 7, the calculated and counted standard deviation (std for short) are plotted and compared. The data set contains the comparison between the two cases with different unit size, mm and mm. In Figs. 7 (a) and (b), one can see that the calculated in case of is clearly larger than that of at every frequency. When , the highest is found at 89 GHz. When , the highest is found at 36.5 GHz . Thus, the -frequency relationship is variable versus the geometry size. For std, the counted value for when is generally larger than when , but not at every frequency point. When and , the largest counted std is found at 36.5 GHz.
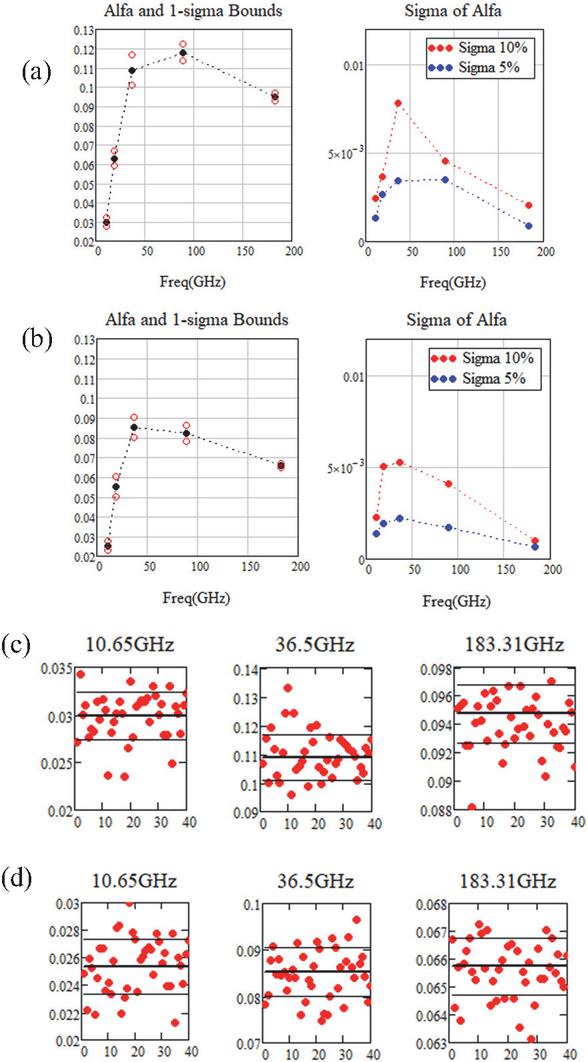
Figure 7 Counted values based on 40 random samples: (a) , counted at different frequencies, and counted std values in cases of std at and ; (b) , counted at different frequencies, and counted std values in cases of () std at and ; (c) , counted at each random sample at and 183.31 GHz ; (d) , counted at each random sample at and 183.31 GHz.
In these set of results, another important fact is that a smaller std leads notably smaller std, which can be anticipated. The comparison between different std level is for further investigation upon the , showing the importance of the error control. For obtaining the statistical std information, 40 random samples are calculated for each frequency and each sigma configuration. The calculations were implemented on one workstation with EPYC 32-core CPU and took more than 10 minutes for each sample. In running each sample, most of the computation time was consumed on performing Fourier transform at each cell for storing local fields at the specific frequency, which were then used for obtaining the local absorption distribution.
B. Uncertainty evaluation for estimation
Based on the counted and its std results, it is further possible to evaluate estimation accuracy. As discussed in the previous section, there are several obstructions for accurate thermal simulation. In this case, one may not expect an accurate bias estimation based on simulated results. However, it is important that the relative temperature distribution across the pyramidal unit is fixed, and it can be inferred that the key issue of temperature measurement is to obtain the maximum value of thermal gradient, which is the bottom-tip difference .
Considering the bias of the , as described in (9), then it is possible to estimate the overall (std) based on Monte Carlo evaluation:
| (9) |
Specifically, the is considered as the absolute value, and:
(1) is the measurable base temperature by the PRT detector, a at the level of 0.03 K is considered. Actually, the PRT temperature measurement has been proven to be accurate and reliable in practical MCT application.
(2) is the temperature difference between the unit tip and the bottom, measurable by the infrared camera detection. Actually, the sensitivity for temperature magnitude measurable by the infrared camera can be at the level of 0.1 K. Also, accurate infrared camera detection will rely on accurate estimation of surface emissivity, therefore, the shall be notably larger than 0.1 K. In this work, is set to be 0.5 K.
(3) is the std for the calculated because of the uncertainty of the coating material electromagnetic parameters, which is frequency dependent and calculated in the former section.
With the above factors considered, the counted estimation accuracy results are presented and discussed based on Monte Carlo analysis.
In Fig. 8, a set of estimated bias results are plotted at specific parameters considering tip . As can be observed, bias varies versus frequency with a considerable large range. The bias is generally larger in magnitude around the frequency , than in high frequency range ( is notably larger than ). bias gets smaller as frequency gets higher. Considering the comparison of unit period, a larger unit with the same coating parameter and height to period ratio generally leads to smaller bias.
Considering the above uncertainty factors, the std results for the estimated bias are also plotted. Several sets of comparisons are plotted in Figs. 9–11.
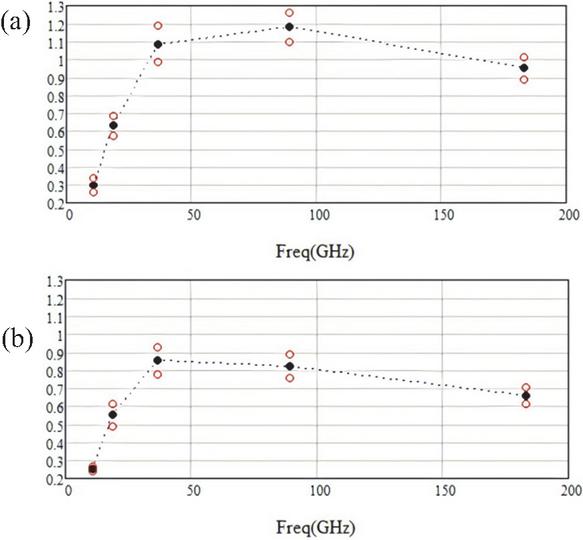
Figure 8 Estimated bias (absolute value of ) and std at different frequencies: (a) and (b) , .
In Fig. 9, counted bias std at different frequencies are compared. One can see the accuracy improvement contributed by achieving higher () determination accuracy. An interesting and important phenomenon can be observed in Fig. 9 (a). As the maximum tip temperature gradient is rising, the std of estimation also gets larger, especially at center frequencies (36.5 GHz). This trend is less notable in Fig. 8 (a). This shows the importance of the coating material parameter determination accuracy, especially at central frequencies (). A sufficiently low uncertainty in the coating layer material parameter will contribute to a stably low std in the estimation, even when the environmental temperature difference is quite large ().
In Fig. 10, similar std results of the bias estimation are compared but considering a larger unit size . Overall data trends are similar to those in Fig. 9. One can see that the std for the estimation are notably smaller than that in Fig. 8. The key reason for this fact is that the in case of a larger unit is smaller than that in case of a smaller unit, given the same coating thickness and height to period ratio. This set of comparison shows that a larger unitsize MCT design generally leads better estimation accuracy.
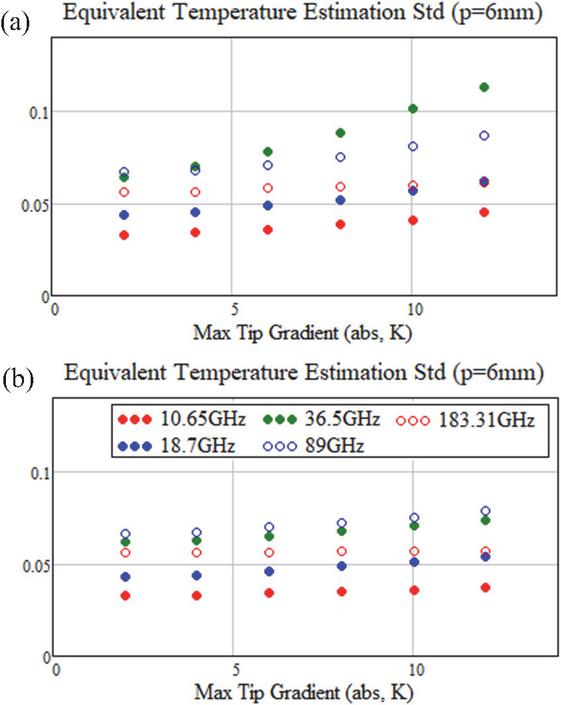
Figure 9 Counted bias std at different frequencies: (a) and (b) , , .
In Figs. 9 and 10, most of the std results are below 0.1 K, which is a considerably small value sufficient for practical correction. It is also important to recall the numerical analysis for the bias estimation in V/T test reported in [16], which gives many important insights into the radiation process. However, based on a full-numerical estimation approach, the counted bias estimation std is at the level of 0.22 K (maximum) for the MCT . Considering those results, the key motivation of this work shall be concluded as: shorten the error analysis chain by considering measurable temperature values over simulated results will leads to the bias estimation more practical and more reliable.
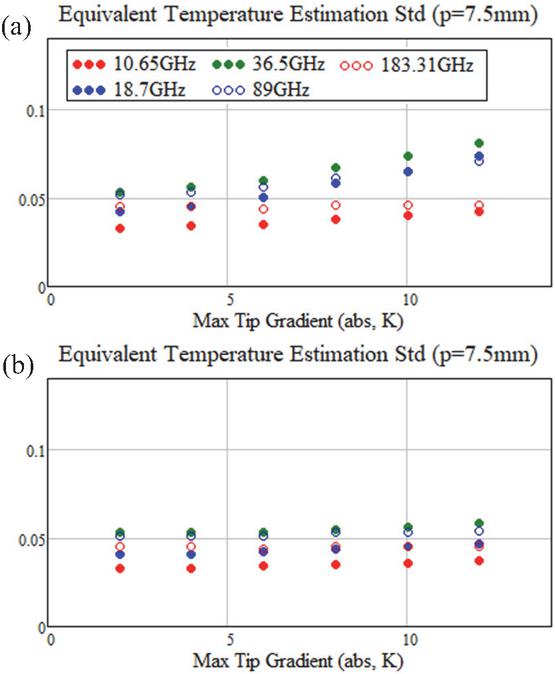
Figure 10 Counted bias std at different frequencies: (a) and (b) .
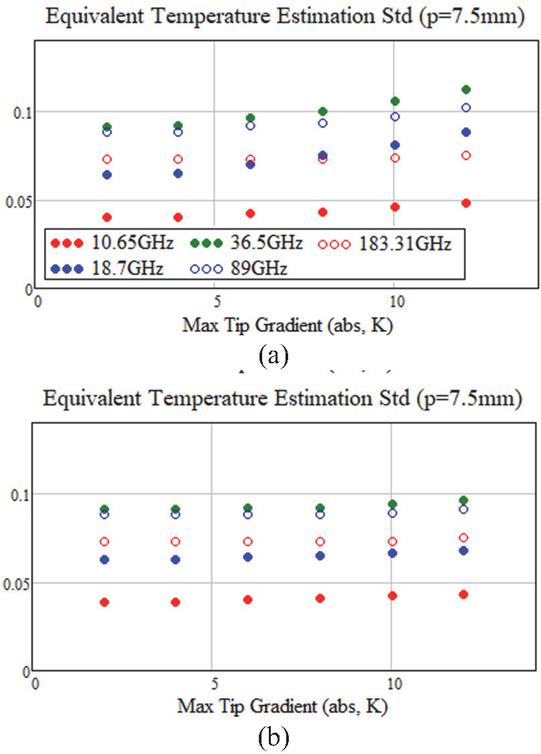
Figure 11 Counted bias std at different frequencies: (a) and (b) .
Consider a higher std in the tip-bottom temperature difference measurement by infrared camera detection, which is highly possible in practical applications, specifically . The corresponding results are given in Fig. 11. By achieving a sufficient () accuracy, , the overall std of the estimation can be below 0.1 K. This set of results indicates that estimation based on PRT measurement at bottom and infrared camera detection for tip-bottom temperature difference is generally robust and can afford the relatively low accuracy for the measurement.
IV. CONCLUSIONS
In this work, the authors investigate the equivalent physical temperature () estimation methodology for the MCT in ground-based radiometer calibration applications. It is well known that the difference between the actually and the nominal temperature is the key factor for the bias. Accurate estimation of is significant for practical bias correction. This work performs error analysis for estimation, for a highly possible temperature measurement strategy combing PRT and infrared camera detection. It is shown in the numerical results that such a routine is possible to determine at an accuracy level of std 0.1 K, which is important for practical calibration application. This routine performs better in accuracy on the MCT with a larger unit size over that with a smaller unit size. Ensuring sufficient low uncertainty in the electromagnetic parameters of the coating layer is important to retain the overall estimation accuracy and make such a routine more tolerable to the infrared detection error. Numerical results show the possibility of the temperature measurement supported bias estimation and provide a corresponding reference for error analysis.
ACKNOWLEDGMENT
This work is supported by the National Key Research and Development Program of China, under Grant 2023YFB3905600, and the National Natural Science Foundation of China, under Grant 62371031.
REFERENCES
[1] F. Ulaby, D. Long, W. Blackwell, C. Elachi, and K. Sarabandi, Microwave Radar and Radiometric Remote Sensing. Ann Arbor, MI, USA: University of Michigan Press, pp. 229–278, 2024.
[2] D. W. Draper, D. A. Newell, D. A. Teusch, and P. K. Yoho, “Global precipitation measurement microwave imager prelaunch hot load calibration,” IEEE Trans. Geosci. Remote Sensing, vol. 51, no. 9, pp. 4731–4742, 2013.
[3] H. Yang, F. Weng, L. Lv, N. Lu, G. Liu, M. Bai, Q. Qian, J. He, and H. Xu, “The FengYun-3 microwave radiation imager on-orbit verification,” IEEE Trans. Geosci. Remote Sensing, vol. 49, no. 11, pp. 4552–4560, 2011.
[4] A. Schröder, A. Murk, R. Wylde, K. Jacob, K. Pike, and M. Winser, “Electromagnetic design of calibration targets for MetOp-SG microwave instruments,” IEEE Trans. Terahertz Sci. Tech., vol. 7, no. 6, pp. 677–685, 2017.
[5] A. Schröder and A. Murk, “Numerical design and analysis of conical blackbody targets with advantage shape,” IEEE Trans. Antennas Propag., vol. 64, no. 5, pp. 1850–1858, 2016.
[6] D. Houtz, W. Emery, D. Gu, and D. Walker, “Brightness temperature calculation and uncertainty propagation for conical microwave blackbody targets,” IEEE Trans. Geosci. Remote Sens., vol. 56, no. 12, pp. 7246–7256, 2018.
[7] S. Sandeep and A. J. Gasiewski, “Electromagnetic analysis of radiometer calibration targets using dispersive 3D FDTD,” IEEE Trans. Antennas Propag., vol. 60, no. 6, pp. 2821–2828, 2012.
[8] M. Bai, D. Xia, and M. Jin, “Effects of coating material properties on the wideband reflectivity performance of microwave calibration targets,” IEEE Trans. Antenna Propag., vol. 65, no. 9, pp. 4909–4913, 2017.
[9] T. Zou, Z. Shang, Y. Shen, Q. Wen, G. Lu, and Z. Wu, “Research on calibration sources for a GHz millimeter-wave solar radio observation system,” IEEE Trans. Antennas Propag., vol. 71, no. 5, pp. 4094–4101, 2023.
[10] D. Gu, D. Houtz, J. Randa, and D. K. Walker, “Reflectivity study of microwave blackbody target,” IEEE Trans. Geosci. Remote Sens., vol. 49, no. 9, pp. 3443–3451, 2011.
[11] J. Wang, Y. Yang, J. Miao, and Y. Chen, “Emissivity calculation for a finite circular array of pyramidal absorbers based on Kirchhoff’s law of thermal radiation,” IEEE Trans. Antennas Propag., vol. 58, no. 4, pp. 1173–1180, 2010.
[12] M. Jin, B. Li, B. Fan, Z. Li, and M. Bai, “On the reflectivity extraction based on partial bistatic near-field scattering from microwave blackbody,” IEEE Trans. Antennas Propag., vol. 69, no. 3, pp. 1692–1705, 2021.
[13] M. Jin, B. Fan, X. Li, B. Li, and M. Bai, “On the total reflectivity estimation of microwave calibration targets by backscattering measurements,” IEEE Trans. Geosci. Remote Sens., vol. 60, p. 5223711, 2022.
[14] M. Jin, B. Li, and M. Bai, “On the reflectivity measurements of microwave blackbody in bistatic near-field configuration,” IEEE Trans. Antennas Propag., vol. 69, no. 11, pp. 8027–8032, 2021.
[15] A. Schröder, A. Murk, R. Wylde, D. Schobert, and M. Winser, “Brightness temperature computation of microwave calibration targets,” IEEE Trans. Geosci. Remote Sens., vol. 55, no. 12, pp. 7104–7112, 2017.
[16] G. Virone, G. Addamo, A. Bosisio, M. Zannoni, L. Valenziano, D. Rizzo, and P. Radaelli, “Thermal vacuum cold target for the Metop SG microwave imager,” IEEE J. Sel. Topics Appl. Earth Observ. Remote Sens., vol. 14, pp. 10348–10356, 2021.
[17] M. Jin, R. Yuan, X. Li, Y. Tao, Q. Gao, and M. Bai, “Wideband microwave calibration target design for improved directional brightness temperature radiation,” IEEE Geosci. Remote Sens. Lett., vol. 19, p. 7001705, 2022.
[18] R. Yuan, Y. Tao, Q. Gao, Y. Han, M. Bai, and M. Jin, “Brightness temperature analysis in the miniaturization of pyramidal calibration targets for sub-millimeter wave radiometers,” IEEE Geosci. Remote Sens., vol. 19, p. 5003505, 2022.
[19] D. M. Jackson and A. J. Gasiewski, “Electromagnetic and thermal analyses of radiometer calibration target,” in Proc. Int. Geosci. Remote Sens. Symp., Honolulu, HI, USA, vol. 7, pp. 2827–2829, 2000.
[20] Q. Gao, D. Li, Y. Tao, L. Yang, H. Zhang, D. Ma, M. Peng, M. Jin, Q. Guo, S. Jiang, Y. Li, C. Cheng, and X. Li, “Research on metrological calibration technology scheme of brightness temperature for the space-borne microwave radiometer calibration target,” Journal of Infrared and Millimeter Waves, vol. 45, no. 01, pp. 77–89, 2026 [in Chinese].
[21] I. Zivkovic and A. Murk, “Characterization of magnetically loaded microwave absorbers,” Prog. Electromagn. Res. B, vol. 33, pp. 277–289, 2011.
BIOGRAPHIES

Ming Jin received the B.Sc. and Ph.D. degrees from Beihang University (BUAA), Beijing, China, in 2007 and 2013, respectively. From 2007 to 2012, he was a research assistant in the Microwave Engineering Laboratory, Beihang University. From December 2010 to March 2011, he was a Visiting Scholar at Arizona State University. In 2019, he joined the College of Information Science and Technology, Beijing University of Chemical Technology (BUCT), as an associate professor, and he became professor in 2024. His research interests include microwave radiometer calibration techniques, quasi-optical beam propagation and computational electromagnetics.

Jiacheng Qian is currently pursuing his B.Sc. degree in the College of Mathematics and Physics, majoring in Electronic Science and Technology. His research interests include numerical simulations and analysis of microwave calibration targets.

Miaomiao Peng received B.Sc. and master’s degrees from Beijing University of Chemical Technology (BUCT), Beijing, China, in 2022 and 2025, respectively. She is currently pursuing her Ph.D. degree with the school of integrated circuits and electronics, Beijing Institute of Technology. Her current research interests include numerical method in electromagnetics, microwave radiometer calibration targets and brightness temperature transfer modeling in calibration links.
ACES JOURNAL, Vol. 41, No. 3, 271–280
DOI: 10.13052/2026.ACES.J.410308
© 2026 River Publishers