A Phase Center Estimation Method for Automotive Antenna Measurements
Junhao Zheng1, 3, Xiaoming Chen2, Chunxu Mao1, Guan-Long Huang3, Wanji Hou4, Yuchen Ma5, Yuxin Ren5, and Yi Huang6
1School of Electronic and Information Engineering
South China University of Technology, Guangzhou 510641, China
1071218679@stu.xjtu.edu.cn, cxmao@scut.edu.cn
2School of Information and Communication Engineering
Xi’an Jiaotong University, Xi’an 710049, China
xiaoming.chen@mail.xjtu.edu.cn
3School of Electronic and Information Engineering
Foshan University, Foshan 528225, China
hgl@fosu.edu.cn
4Electromagnetic Compatibility Test Department of Changchun Automobile Test Center
Changchun, 130103 China
houwanji@catc.com.cn
5China Academy of Information and Communications Technology
Beijing 100191, China
mayuchen@caict.ac.cn, renyuxin@caict.ac.cn
6Department of Electrical Engineering and Electronics
University of Liverpool, Liverpool L69 3GJ, UK
yi.huang@liverpool.ac.uk
Submitted On: October 20, 2025; Accepted On: March 04, 2026
Abstract
This paper presents a blind phase center estimation method for hemispherical near-field automotive antenna tests. The previous method only satisfies the less edge-scattering affected conditions, whose phase center estimation stability and accuracy are not satisfactory. While, the newly proposed method utilizes image theory as filtering process to characterize the electric fields with reduced edge-scattering effects, and the phase center is more accurately derived by the local searching strategy combined with a fast least-squares-based method along the x-, y- and z-axis. Correspondingly, the improvement of the calibrated pattern is significant. The simulation and measurement results both demonstrate the superiority of the proposed method with less time cost and better accuracy for different types of automotive antennas than the previous method. More importantly, the proposed method does not need to distinguish the edge-scattering-affected condition and non-edge-scatteringaffected condition, which will lead to an easy work for estimating the phase center and ensure the accuracy of the pattern offset calibration.
Keywords: Blind phase center estimation, calibration for displaced antenna, edge-scattering reduction, field projection, spatial convolution-deconvolution..
1 INTRODUCTION
The spherical near-field measurement is widely used in characterizing the far-field pattern and relevant radiation parameters [1, 2, 3]. However, the issue of the measurement misalignment of the antenna under test (AUT) usually causes significant deviations for the derived far-field pattern [4, 5, 6, 7, 8, 9, 10]. This is especially true for automotive antenna tests [11], where the actual position of the AUT may not be known. Besides, accurate pattern measurements are critical to engineering applications of automotive wireless communications [12], electromagnetic compatibility tests, and the multiplexing performance based on the electronic control unit level [13]. What is more, the edge-scattering interference of, e.g., the automotive roof and lifting platform, can also lead to the inaccuracy of the near-field test [14, 15, 16]. Consequently, it is necessary to find an effective method to estimate the phase center with less edge-scattering to enable accurate pattern calibration.
Regarding the edge-scattering effect, the authors in [15] used virtual vertices and image theory to eliminate the numerical errors caused by the boundary edges. The research in [16] pointed out the feasibility of using the mode expansion theory to reduce the edge-scattering effect to improve the accuracy of the near-to-far-field transformation (NFT) pattern. As for the phase center study, the conventional method in [17] used the minimum phase variation and the far-field analysis based on known antenna structures to determine the phase center, which can now be realized by full-wave simulation when the AUT is constructed in the software. Reference [18] discussed feasible phase center calculation methods for the planar near-field measurement, which provide some useful explorations for spherical phase center estimation. Reference [19] used the path length and probe-pattern-based method to calibrate the far-field displacement.
In this work, an improved antenna calibration method with fewer truncation errors and less time cost is proposed. Specifically, the method uses spherical mode characteristics to reduce the edge-scattering effect for the near-field automotive antenna test [20], and a fast least-squares-based method is combined with a local searching strategy to swiftly obtain the phase center estimation, leading to an accurate far-field result.
2 THEORY
2.1 Image-theory-based mode expansion analysis
The automotive antenna is mounted on the automotive roof, which is a finite plane with finite thickness. Thus, the current on the automotive roof edge will experience a scattering effect, making it difficult to accurately estimate the phase center. To solve this problem, the image theory and edge filtering are given as follows: The hemispherical wave expansion of the near-field can be expressed as [1]
| (1) |
where and are the spherical wave expansion coefficients, and are the spherical wave generating functions. According to the image theory, the hemispherical near-field can be calculated by the superimposition of the direct and the image field as
| (2) |
where is the component of in equation (1), is the image component, and is the image-processed near-field. Besides, the generating function of and is odd when the sum of order and degree is odd, and becomes even when is even. Correspondingly, the derivative of and is even (or odd) when is odd (or even). Based on these characteristics, the spherical wave coefficients and of equation (2) can be represented as [16]
| (9) |
The boundary condition for in this situation will satisfy when is odd and when is even, which will effectively reduce the edge-scattering effect for the hemispherical near-field test [16]. By substituting the new coefficients and into equation (1) and using the boundary condition for , the reprocessed automotive near-field will be more accurate for the phase center estimation and subsequent NFT pattern calibration.
2.2 Improved phase center estimation
A least-squares-based fast phase center estimation method [21] is used to approximately estimate the initial phase center . Then, a local searching strategy is chosen to find the phase center along the positive and negative axes in and directions starting from . The searching range is set as , and the phase center corresponding to the minimum phase difference can be found within , that is: if lies in the endpoint of will be expanded as until is not at the endpoint of the searching range, and the local minimum point within will correspond to the . The specific method of searching follows.
As shown in Fig. 1, the hemispherical near-field data is sampled on , where the measurement center is and the radius is . The phase center of the automotive antenna is , which is usually different from due in practical automotive measurement setup. The deviation projection of onto the coordinate system of the aperture plane , whose plane center is (the same as ), is () or for short. Thus, the displacement of can be compensated when the phase center is determined.
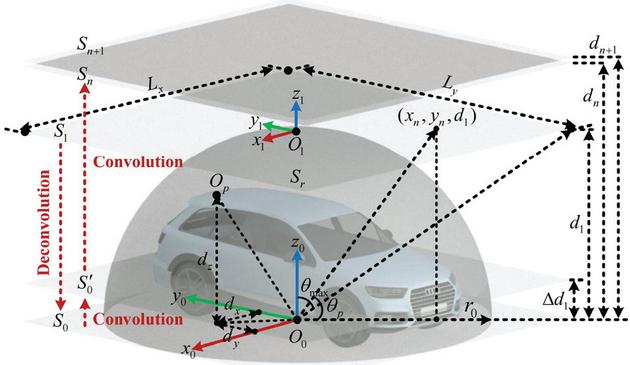
Figure 1 Parameters of the hemispherical automotive antenna test.
Since the data on can be projected onto the three planes along the and axes, the -axis projection is selected as an example to illustrate the estimation of . A plane , which is tangent to , is chosen with lengths of and to project near-field data, and the maximum projection angle is determined, where . The projection from to includes the electric field transformation and coordinate transformation, which can be expressed as
| (15) | |
| (19) |
where is the reprocessed image near-fields on in equation (2), is the projected fields on , is the wavelength of frequency is the propagating distance, and are the th sampling position on and are the th sampling position on . transfers the oblique incident wave from into the vertical wave on , as shown in Fig. 1.
The spatial convolution-deconvolution method, as described in [22], is used to backwardly and forwardly derive the near-field and far field, respectively
| (20) | ||
| (21) |
where is the Green function, and are the entry-wise multiplication and division between the pattern matrices, and are the Fourier and inverse Fourier transformations, and are the electric fields on planes and and are the coordinates on and .
By combining equations (1)–(21), the phase center estimation processes of can be summarized as follows:
1. The image-processed near-fields on are obtained by equations (1)–(9), and the least-squaresbased method is used to estimate the initial phase center , based on which the desired will be found within . Then are projected onto as using equations (15)–(19). The aperture near-field on is obtained by equation (21) from on , and an extrapolation distance is selected away from (as shown in Fig. 1), where lies in the range of .
2. Equation (20) is used to convolute with distance to derive on . Meanwhile, two close far-field planes and corresponding to distances and are chosen and fixed.
3. is convoluted by equation (20) to obtain the two far fields and on the two planes and , and the sum of the planar phase differences between and are calculated as , where and are the phases of and .
4. Changing the value of and reperforming steps two and three, different phase differences between different and (notably, and keep unchanged) are obtained. After multiple groups of iterations, the minimum value of is found. Notably, the minimum value of is derived from the sum of the two spherical phase differences, and the phase center corresponds to the radiating center with minimum phase difference. Therefore, the minimum corresponds to the minimum phase center, i.e., the phase center. Then the corresponding is the optimal phase center along the axis, which is noted as .
5. Subsequently, the -axis and -axis phase center estimations can be realized by projecting the near-field data of onto the planes along the and axes, and the phase centers can be finally determined.
2.3 Pattern offset calibration
Once the phase center is determined following the above procedures, pattern offset calibration can be readily conducted as follows. Since the samples on have two coordinates of () and () corresponding to and , the compensated NFT pattern can be expressed as , where [19]. The compensated pattern is in the coordinates of (), and should be projected into the coordinates of () to match the measurement origin .
3 SIMULATION AND MEASUREMENT RESULTS
3.1 Simulation
The automotive model with a monopole antenna is simulated by FEKO software and the geometrical center of the monopole antenna is fixed at to simulate the near-field phase center deviation, as shown in Fig. 2, where the frequency is 3 GHz, the measured near-field radius is , the sampling ranges are and , and the sampling intervals are . Besides, the projection angle is , and the projection interval on is . The maximum searching range along the and axes is limited within 2 m (i.e., less than ).
The previous global phase center searching method without edge-scattering reduction in [23] is firstly used to obtain the estimated phase center result to make comparisons with the newly proposed method, as shown in Fig. 3 (a), where the red, green and blue curves are the phase centers varied in different plane positions with a searching step of 0.1 m along the , and axes, and the estimated phase center is denoted as . Next, the initial phase center is first determined as . The range is set as . Notably, the simulated edge-scattering effect is mainly contributed by the automotive roof and bottom enclosed within the range of . The variations of the phase differences calculated by the proposed method under the local searching strategy are shown in Figs. 3 (b)–(d), where the red, green and blue curves are the phase centers varied along the , and axes, respectively. Therefore, the phase center is determined as (marked as asterisks in Fig. 3). Besides, the theoretical phase center calculated by the classical method in [17] is presented as . Then, the estimated phase centers and are compared with and summarized in Table 1.
After the phase centers are acquired, the next step is to calibrate the displacement between the real center and the virtual center (and ). Therefore, by using the proposed calibration method and the method in [23], the theoretical and compensated NFT patterns in and are shown in Fig. 4, where the red, yellow, black and blue curves are the theoretical pattern derived from FEKO, uncalibrated NFT pattern, calibrated NFT pattern by [23], calibrated NFT pattern by the proposed method, respectively. Besides, the purple, grey and green curves are the errors between red and yellow curves, errors between red and black curves, errors between red and blue curves.
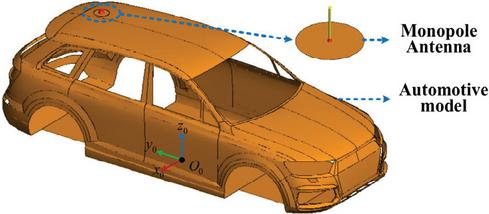
Figure 2 Automotive model mounted with a monopole antenna.
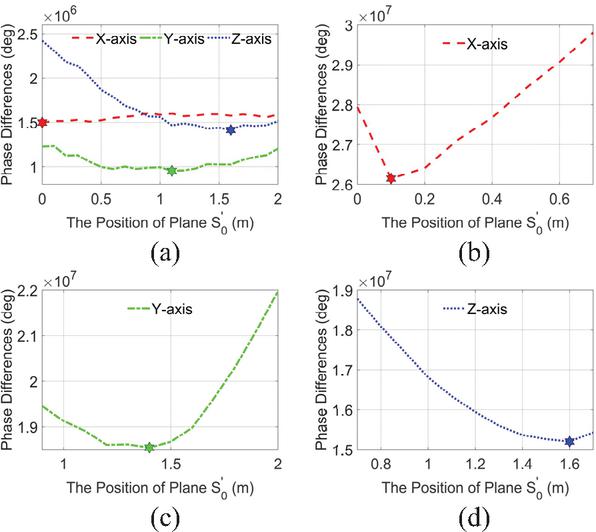
Figure 3 Variations of for (a) global searching strategy in [23], and local searching strategy along the (b) -, (c) - and (d) -axis.
Table 1 Simulated phase centers and error comparisons (unit: meter)
| Axis | |||||
| 0.1 | 0.0 | 0.0 | |||
| 1.4 | 1.4 | 1.1 | |||
| 1.6 | 1.2 | 1.6 |
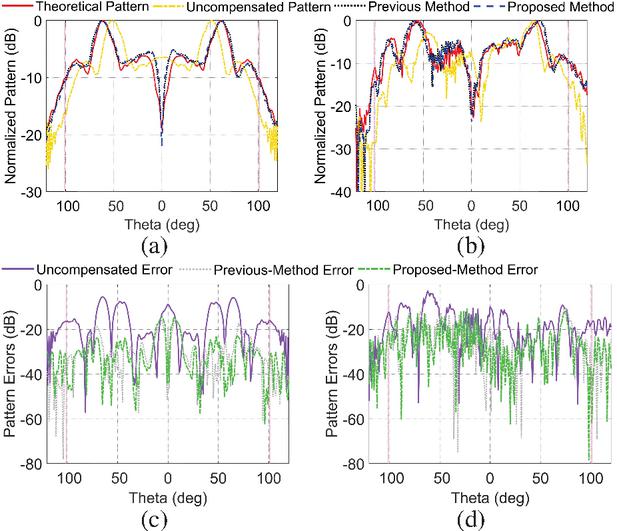
Figure 4 Comparisons of the simulated patterns in (a) and (b) , and pattern errors in (c) and (d) .
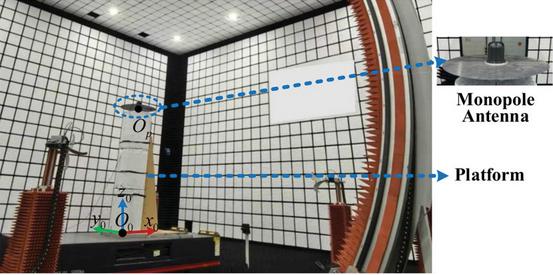
Figure 5 Near-field measurement setup of a monopole antenna.
3.2 Measurement
A monopole antenna working at GHz with the main lobe lying in the plane is chosen to imitate the radiation of the automotive antenna, whose geometrical center is fixed at to represent the near-field phase center deviation, and the measurement setups are shown in Fig. 5. The spherical near-field radius is 6.8 m, the sampling ranges are and , and the sampling intervals are . The projection angle and interval on are and . The maximum searching ranges along the and axes is limited within 5 m (i.e., less than ). The results of the previous global phase center searching method in [23] are shown in Fig. 6 (a), where the step is 0.1 m and . Then the initial phase center is determined as . The range of is set as . The phase difference is shown in Figs. 6 (b)–(d), where the interval of the abscissa is 0.1 m, the maximum searching range is limited within 5 m, and the phase center is determined as . While the actual phase center is , and the corresponding estimated errors are summarized in Table 2. Then, the calibrated NFT patterns after the probe compensation [18] and their pattern errors are given in Fig. 7.
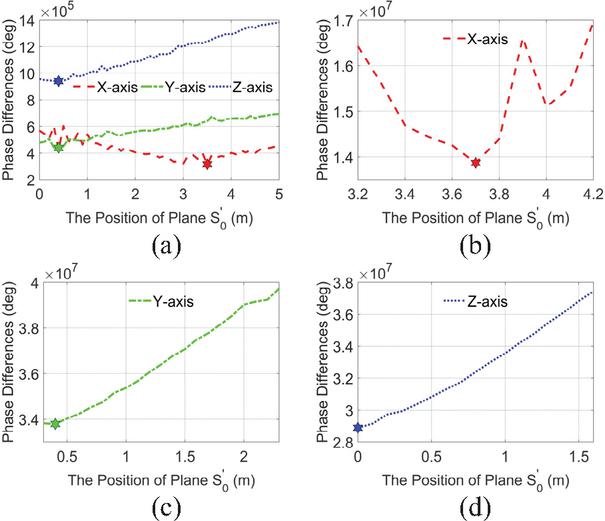
Figure 6 Variations of for (a) global searching strategy in [23], and the local searching strategy along (b) -, (c) - and (d) -axis.
Table 2 Measured phase centers and error comparisons (unit: meters)
| Axis | |||||
| 3.7 | 3.0 | 3.5 | |||
| 0.1 | 0.0 | 0.4 | |||
| 0.0 | 0.0 | 0.4 |
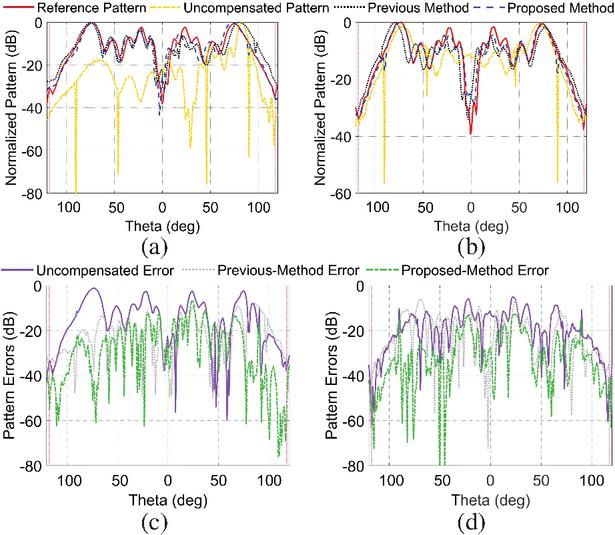
Figure 7 Comparisons of the measured patterns in (a) and (b) , and pattern errors in (c) and (d) .
3.3 Discussions
3.3.1 Relative errors
In order to more accurately analyze the superiority of the proposed method, the calculation of the relative errors in Figs. 4 (a)–(d) and Figs. 7 (a)–(d) is given below
| (22) |
where is the red curve without displacement in Figs. 4 (a), (b) or Figs. 7 (a), (b), is the error curve (purple, grey or green curves) in Figs. 4 (c), (d) or Figs. 7 (c), (d). is the reliable region of the spherical near-field test in elevation range, which is calculated by [24] as and for Fig. 4 and Fig. 7 (pink curve), respectively. Therefore, the calculated relative errors are given in Table 3. Notably, since the method in [23] is only available for the model with a small phase center offset and a small automotive roof, which leads to less edge-scattering effect, the performance of the method in [23] deteriorates under the current monopole testing case in Table 3. While this does not influence the usefulness of [23] for the normal phase center estimation cases where the edge-scattering and the phase center deviation is small.
Table 3 Relative errors
| Fig. 4 | Uncompen | Previous | Proposed |
| sated | Method | Method | |
| Fig. 7 | Uncompen | Previous | Proposed |
| sated | Method | Method | |
3.3.2 Additional edge-scattering-affected simulation results
An additional automotive model mounted with a 2 GHz right-handed circular-polarized (RHCP) antenna (i.e., helical antenna), whose geometrical center is fixed at , is simulated to verify the wide applicability and significance of the proposed method for the circular-polarized antenna. The basic simulation setups are the same as the model in Fig. 2. The theoretical phase center is , and the estimated phase centers and are obtained in Table 4. Correspondingly, the pattern errors for the left-handed circular-polarized (LHCP) component, RHCP component and the entire far-field component of the calibrated NFT patterns are summarized in Table 5.
Table 4 Edge-scattering-affected simulated phase centers and error comparisons (unit: meters)
| Axis | |||||
| 0.1 | 0.0 | 0.0 | |||
| 0.1 | 0.0 | 0.1 | |||
| 1.5 | 1.2 | 1.7 |
Table 5 Edge-scattering-affected relative errors
| Left-Polarized | Uncompen | Previous | Proposed |
| sated | Method | Method | |
| 33.57% | 19.43% | 16.06% | |
| 26.92% | 17.31% | 16.54% | |
| Right-Polarized | Uncompen | Previous | Proposed |
| sated | Method | Method | |
| 14.26% | 7.79% | 6.18% | |
| 16.78% | 8.50% | 7.31% | |
| Total | Uncompen | Previous | Proposed |
| Component | sated | Method | Method |
| 12.71% | 5.35% | 4.29% | |
| 15.26% | 7.40% | 6.31% |
3.3.3 Additional non-edge-scattering-affected simulation results
The following will give additional results for the non-edge-scattering-affected cases to further verify the effectiveness of the proposed method under normal condition. A single monopole antenna and a single helical antenna are chosen as the representative linearand circular-polarized antennas, respectively, working at 3 GHz. The basic sampling setups are the same as the model in Fig. 2, and the two antennas are placed at . The estimated phase canters of the two antennas are summarized in Table 6. The corresponding pattern calibration results are listed in Table 7, where the LHCP and RHCP components of the helical antenna are omitted and only shows the overall polarization components of the farfield results.
Table 6 Non-edge-scattering-affected simulated phase centers and error comparisons (unit: meters)
| Mono pole | |||||
| 0.9 | 1.0 | 1.0 | |||
| 0.9 | 1.0 | 1.0 | |||
| 0.8 | 1.0 | 1.4 | |||
| Helix | |||||
| 0.8 | 1.0 | 0.9 | |||
| 0.8 | 1.0 | 1.1 | |||
| 0.9 | 1.0 | 1.4 |
Table 7 Non-edge-scattering-affected relative errors
| Monopole | Uncompen | Previous | Proposed |
| sated | Method | Method | |
| Helix | Uncompen | Previous | Proposed |
| sated | Method | Method | |
3.3.4 Advantages
Based on all the results shown above, the proposed method has two significant advantages:
1. Reduction of time cost: The local searching numbers of the proposed method for the simulation and measurement results in Fig. 2 and Fig. 5 are 41 and 62. While the method in [23] for the results in Fig. 2 and Fig. 5 are 63 and 153. Thus, the proposed method leads to about 100 minutes and 450 minutes time reduction (in a personal computer with 2.6 GHz CPU of Core i9-13900H and RAM of 32 GB).
2. The wide applicability with better performance: The proposed method is a unified phase center estimation and pattern calibration method suitable for different polarized antennas, frequencies, offset positions and conditions (edge-scattering-affected and non-edge-scattering-affected conditions).
4 CONCLUSION
This work presented an improved phase center estimation method. Specifically, it used image theory with edge-scattering reduction and a fast local searching strategy to achieve better phase center estimation of the automotive antenna. Notably, the proposed method unified the edge-scattering-affected and non-edge-scattering-affected conditions, and the time cost had been significantly reduced, which leads to an easy task for the general spherical near-field test.
ACKNOWLEDGMENT
This work was supported in part by the Key Research and Development Program of Shaanxi under Grant 2024GX-ZDCYL-01-26, and Shaanxi Province Innovation Capability Support Plan under No.2024RS-CXTD-07.
References
[1] J. E. Hansen. Spherical Near-Field Antenna Measurements. London: IET, 1988.
[2] T. K. Sarkar, M. S. Palma, M. D. Zhu, and H. Chen. Modern Characterization of Electromagnetic Systems and its Associated Metrology. New Jersey: Wiley, pp. 453–489, 2021.
[3] F. Peng, Q. Zhang, X. Liu, Z. Wang, and X. Chen, “An efficient antenna measurements method in spherical near-field based on sparse sampling,” IEEE Antennas Wirel. Propag. Lett., vol. 23, no. 11, pp. 3942-3946, Nov. 2024.
[4] Standard definition of terms for antennas, IEEE standard 145-1993, 1993.
[5] C. Ehrenborg, “Investigation and comparison between radiation and phase center for canonical antennas,” M.S. thesis, Dept. Elect. Inf. Tech., Lund Univ., Göteborg, Sweden, 2014.
[6] M. Henley and M. Pour, “Reconfigurable displaced phase center reflector antennas with focal plane arrays,” IEEE Antennas Wirel. Propag. Lett., vol. 18, no. 6, pp. 1298–1302, June 2019.
[7] G. B. Arfken, Mathematical Methods for Physicists, 4th ed. Orlando: Academic Press, pp. 1–222, 1995.
[8] C. A. Balanis. Modern Antenna Handbook. New Jersey: Wiley, pp. 977–1033, 2008.
[9] J. Fridén and G. Kristensson, “Calculation of antenna radiation center using angular momentum,” in Proc. Eur. Conf. Antennas Propag. (EuCAP), Gothenburg, Sweden, pp. 1531–1535, 2013.
[10] J. Fridén and G. Kristensson, “Calculation of antenna radiation center using angular momentum,” IEEE Trans. Antennas Propag., vol. 61, no. 12, pp. 5923–5930, Dec. 2013.
[11] J. Zheng, F. Peng, Z. Wang, G. Huang, and X. Chen, “Far-field similarity-based pattern reconstruction method for hemi-spherical vehicular antenna tests,” IEEE Antennas Wirel. Propag. Lett., vol. 24, no. 5, pp. 1124–1128, May 2025.
[12] M. Emmelmann, B. Bochow, and C. Kellum, “Commercial and public use applications,” in Vehicular Networking: Automotive Applications and Beyond. New Jersey: Wiley, pp. 1–28, 2010.
[13] C. Lupini, Vehicle Multiplex Communication: Serial Data Net-working Applied to Vehicular Engineering. New York: SAE, 2004.
[14] J. C. West, “On the control of edge diffraction in numerical rough surface scattering using resistive tapering,” IEEE Trans. Antennas Propag., vol. 51, no. 11, pp. 3180–3183, Nov. 2003.
[15] J. H. Hwang and Y. Oh, “Investigation of the effect of boundary edges placed on an infinite conducting surface and effective treatment using virtual vertices,” IEEE Antennas Wirel. Propag. Lett., vol. 11, pp. 913–916, 2012.
[16] E. D. Giampaolo, “A numerical filter to remove the field scattered by the edges of a finite ground plane from measured data,” Prog. Electromagn. Res. B, vol. 9, pp. 165–178, 2008.
[17] Y. Y. Hu. “A method of determining phase centers and its application to electromagnetic horns,” J. Frankl. Inst., vol. 271, no. 1, pp. 31–39, Jan. 1961.
[18] P. Padilla, J. M. Fernández, J. L. Padilla, G. Expósito, M. S. Castaner, and B. Galocha, “Comparison of different methods for the experimental antenna phase center determination using a planar acquisition system,” Prog. Electromagn. Res., vol. 135, pp. 331–346, 2013.
[19] G. F. Hamberger, J.-A. Antón, S. J. Lachner, and B. Derat, “Correction of over-the-air transmit and receive wireless device performance errors due to displaced antenna positions in the measurement coordinate system,” IEEE Trans. Antennas Propag., vol. 68, no. 11, pp. 7549–7554, Nov. 2020.
[20] Automotive Association Technical Report, “Vehicular antenna test methodology,” 5GAA, Munich, Germany, 2024.
[21] N. Anyutin, I. Malay, and A. Malyshev, “Reconstruction of algorithm of electromagnetic field in case of elliptic polarization of near-field probe,” in Proc. East-West Design & Test Symposium (EWDTS), Kazan, Russia, pp. 1–4, 2018.
[22] J. Zheng, C. Pan, Z. Wang, L. Zhang, and X. Chen, “An efficient data reconstruction method for broadband planar near-field measurements based on the field distribution similarity,” IEEE Trans. Instrum. Meas., vol. 72, no. 1008514, 2023.
[23] J. Zheng, Y. Ren, G. L. Huang, Y. Ma, and C. Mao, “A calibration method for displaced hemispherical vehicular antenna based on blind phase center estimation,” IEEE Antennas Wirel. Propag. Lett., vol. 24, no. 11, pp. 3885–3889, Nov. 2025.
[24] F. J. Cano-Fácila, S. Pivnenko, and M. Sierra-Castañer, “Reduction of truncation errors in planar, cylindrical, and partial spherical near-field antenna measurements,” Int. J. Antennas Propag., vol. 2012, no. 1, pp. 1–19, Feb. 2012.
Biographies

Junhao Zheng received the B.Sc. degree in electronic information science and technology from Shandong University, Weihai, China, in 2017, the M.Sc. degree in signal and information processing from Northwestern Polytechnical University, Xi’an, in 2020, and the Ph.D. degree in electronic science and technology from Xi’an Jiaotong University, Xi’an, in 2024. His current research interests include antenna measurement in an anechoic chamber and reverberation chamber and over-the-air (OTA) testing.

Xiaoming Chen (Senior Member, IEEE) received the B.Sc. degree in electrical engineering from Northwestern Polytechnical University, Xi’an, China, in 2006, and the M.Sc. and Ph.D. degrees in electrical engineering from the Chalmers University of Technology, Gothenburg, Sweden, in 2007 and 2012, respectively. From 2013 to 2014, he was a Post-Doctoral Researcher with the Chalmers University of Technology. From 2014 to 2017, he was with Qamcom Research and Technology AB, Gothenburg. Since 2017, he has been a Professor with Xi’an Jiaotong University, Xi’an. His research interests include MIMO antennas, over-the-air testing, reverberation chambers, and antenna measurements. He has published more than 200 journal articles on these topics. Chen received the IEEE Outstanding Associate Editor Awards six times from 2018 to 2023, and the International Union of Radio Science (URSI) Young Scientist Award 2017 and 2018. He was the General Chair of the IEEE International Conference on Electronic Information and Communication Technology (ICEICT) 2021. He currently serves as a Track Editor for IEEE Antennas and Wireless Propagation Letters and Associate Editor for IEEE Transactions on Antennas and Propagation.

Chunxu Mao (Member, IEEE) received the B.S. degree in communication engineering from the Guilin University of Electronic and Technology, Guilin, China, in 2010, the M.E. degree in RF and microwave engineering from the South China University of Technology, Guangzhou, in 2013, and the Ph.D. degree in electronic engineering from the University of Kent, Canterbury, UK, in 2018. From January 2018 to August 2019, he was a Post-Doctoral Research Fellow with the Computational Electromagnetics and Antennas Research Laboratory (CEARL), The Pennsylvania State University, University Park, PA, USA. In October 2019, he joined the Institute for Communication Systems (ICS), 5G/6G Innovation Center (5G/6GIC), University of Surrey, as a Senior Research Fellow. His research interests include multifunctional filtering antennas, circularly polarized antenna/array, 5G millimeter-wave antennas, wearable antennas, and metamaterial antennas. Mao serves as a Peer Reviewer of several journals, including IEEE Transactions on Antennas and Propagation, IEEE Transactions on Microwave Theory and Techniques, and IEEE Antennas and Wireless Propagation Letters.

Guan-Long Huang (Senior Member, IEEE) received the B.E. degree in electronic information engineering from the Harbin Institute of Technology, Harbin, China and the Ph.D. degree in electrical and computer engineering from the National University of Singapore, Singapore. From 2011 to 2020, he was with Shenzhen University as an Associate Professor, Peng Cheng Laboratory as a Joint-Researcher, Southern University of Science and Technology as an Adjunct Lecturer, Nokia Solutions and Networks System Technology as a Senior Antenna Specialist, and Temasek Laboratories with National University of Singapore as a Research Scientist. He is currently a Distinguished Professor with Foshan University, Foshan, Guangdong, China, and the Director of Smart Antenna and Microwave & Millimeter-Wave Engineering Technology Research Centre of Foshan City. He has authored and co-authored two books and more than 200 papers in peer-reviewed journals and international conferences. He was the TPC member and special session organizer of several international conferences including APCAP-2018, ISAP-2019, ICMMT-2019/2020/2021/2022, IEEE MTT-S IMWS-AMP-2020/2021/2022, ACES-China-2021/2022. He also was the Publicity Co-Chair of ICMMT-2022. He was the recipient of the Raj Mittra Travel Grant (2021), Best Reviewer Award of IEEE AWPL (2019) and IEEE TAP (2020, 2021), all from IEEE Antenna and Propagation Society, and the recipient of the Young Scientist Award in 2021 from the Applied Computational Electromagnetics Society, Fok Ying-Tong Education Foundation Award in 2020 from the Ministry of Education of the People’s Republic of China, and the Foundation for Distinguished Young Talents in Higher Education of Guangdong Province, China in 2017. His research interests include design and implementation of high-performance antenna arrays, base-station and mobile RF front-end devices/antennas, millimeter-wave antenna, antenna measurement technique and 3-D printing technology in microwave applications.

Wanji Hou was born in Changchun, China, in 1989. He received the bachelor’s degree and graduated from the School of Electrical Engineering at Beijing Jiaotong University in 2013. He is currently with in Changchun Automotive Test Center Co. Ltd. His current research interests are in the field of automotive antenna testing, and electromagnetic compatibility testing.

Yuchen Ma was born in Beijing, China, in 1993. He received the B.E. and Ph.D. degrees from the School of Electronic and Information Engineering, Beijing Jiaotong University, Beijing, in 2015 and 2021, respectively. He is currently with China Academy of Information and Communications Technology, Beijing. His current research interests include the fields of antenna design and antenna measurement.

Yuxin Ren received the M.Sc. degree in electronic science and technology from the Beijing University of Posts and Telecommunications, Beijing, China, in 2014. Since 2018, he has been an Engineer with the China Academy of Information and Communications and Technology, Beijing. His current research interests include the theory of reverberation chamber and plane wave synthesizers and other OTA test systems.

Yi Huang (Fellow, IEEE) received B.Sc. in Physics (Wuhan, China) in 1984, M.Sc. (Eng) in Microwave Engineering (Nanjing) in 1987, and D.Phil. in Communications from the University of Oxford, UK, in 1994. He has been conducting research in the areas of antennas, wireless communications, applied electromagnetics, radar, and EMC since 1987. More recently, he is focused on mobile antennas, wireless energy harvesting, and power transfer. His experience includes three years spent with NRIET (China) as a Radar Engineer and various periods with the Universities of Birmingham, Oxford, and Essex in the UK as a member of research staff. He worked as a Research Fellow at British Telecom Labs in 1994 and then joined the Department of Electrical Engineering & Electronics, the University of Liverpool, UK, as a Faculty in 1995, where he is now a full Professor in Wireless Engineering, the Head of High-Frequency Engineering Group and Deputy Head of Department. Huang has published over 500 refereed papers in leading international journals and conference proceedings and authored four books, including Antennas: from Theory to Practice (John Wiley, 2008, 2021). He has received many patents, research grants from research councils, government agencies, charities, EU, and industry, and is a recipient of over 10 awards (e.g. BAE Systems Chairman’s Award 2017, IET, and Best Paper Awards). He has served on a number of national and international technical committees and been an Editor, Associate Editor, or Guest Editor of five international journals. In addition, he has been a keynote/invited speaker and organizer of many conferences and workshops (e.g. IEEE iWAT2010, LAPC2012, and EuCAP2018). He is at present the Editor-in-Chief of Wireless Engineering and Technology, Associate Editor of IEEE Antennas and Wireless Propagation Letters, UK and Ireland Rep to European Association of Antenna and Propagation (EurAAP, 2016-2020), a Fellow of IET, and a Fellow of IEEE.
ACES JOURNAL, Vol. 41, No. 2, 118–127
DOI: 10.13052/2026.ACES.J.410202
© 2026 River Publishers