Ant Colony Algorithm Optimized Method for Electromagnetic Interference Suppression of Power Line Inspection UAVs
Jian Chen, Yuxuan Huang*, and Ziheng Wan
Zhuhai Power Supply Bureau Guangdong Power Grid Co. Ltd., Zhuhai 519000, China
chenjian_986@163.com, huangyx1996@igit.ac.cn, wanziheng999@163.com
∗Corresponding author
Submitted On: February 11, 2026 Accepted On: May 27, 2026
ABSTRACT
Power inspection drones face severe electromagnetic interference issues in complex electromagnetic environments. Methods such as wavelet transform, matched filtering, and traditional support vector machines (SVM) have been applied in the field of interference suppression, however, the transient characteristics of interference are highly random and bursty. Existing methods have significant deficiencies in extracting key information in the time-frequency domain, making it difficult to accurately characterize interference features. This leads to large deviations in the peak values of frequency-domain amplitude characteristics and fails to achieve the desired suppression performance. To effectively suppress electromagnetic interference, an ant colony algorithm-optimized electromagnetic interference suppression method for power inspection drones is proposed. Wavelet decomposition transform is used to optimize the signal waveform of power inspection drones, thereby improving signal quality. By combining discrete Fourier transform processing and matched filtering transform, transient time-frequency domain features of interference are extracted based on the optimized drone signal waveform. Using the transient time-frequency domain features, a SVM trained with a linear kernel function is employed to detect high-density integrated electromagnetic interference. A filter is adopted to suppress electromagnetic interference by adjusting its coefficients, and the ant colony algorithm is utilized to adaptively optimize these coefficients, achieving high-density integrated electromagnetic interference suppression for power inspection drones. Experimental results show that the optimized signal waveform is smoother and more stable. The error between the frequency-domain amplitude characteristic peak of electromagnetic interference signals extracted by this method and the actual interference peak is less than 5 dB. After applying the proposed suppression method, the electromagnetic interference intensity is reduced to below , and the signal-to-noise ratio (SNR) of the suppressed signal is relatively high.
Keywords: Ant colony optimization, high-density integrated electromagnetic interference, interference suppression..
1 INTRODUCTION
As the scale of power systems continues to expand and their level of intelligence steadily improves, unmanned aerial vehicle (UAV) power inspection technology, leveraging its advantages of high efficiency and flexibility, has become an important means of ensuring the safe operation of power grids. However, the electromagnetic environment in areas with dense power equipment is relatively complex, and there are high-intensity and broad-spectrum electromagnetic interference sources in typical scenarios such as substations and high-voltage transmission corridors, which pose a serious challenge to the reliability of UAV inspection systems. Traditional decentralized electromagnetic compatibility designs often struggle to address mutual interference among sensors, communication modules, and flight control systems within highly integrated UAV platforms, especially when multiple mission payloads work collaboratively. The coupling effect of electromagnetic interference [1] can lead to chain reactions such as UAV signal distortion, positioning drift, and even control system failure. Such interference not only affects the accuracy of inspection data but may also cause safety hazards such as UAV loss of control, directly threatening the stable operation of power facilities. Therefore, interference suppression under high-density integration conditions is of great significance for promoting the development of intelligent inspection technology and ensuring power grid safety.
In the process of continuously expanding the application of drone technology, electromagnetic interference has become increasingly prominent and has become a key factor affecting its performance and reliability. Cheng et al. [2] used adaptive beamforming to suppress high-density integrated electromagnetic interference in UAV remote communication, and optimized beam direction through phase compensation to deal with frequency hopping. Yang and Li [3] used wavelet threshold denoising and magnetic disturbance compensation models to realize the anti-electromagnetic interference of substation patrol UAV, and responded to strong interference by controlling the transmission power. Li et al. [4] established the electromagnetic field effect model of EHV transmission lines and defined the minimum anti-interference distance to avoid the influence of field strength. Meng et al. [5] used microwave ferrite birefringence effects and adaptive variable polarization controls to make antenna radiation and interference wave form polarization orthogonal to realize anti-interference.
The existing methods mostly focus on the single link of interference suppression, lack the whole link collaborative design from signal waveform optimization feature extraction intelligent detection adaptive suppression, and do not use the intelligent optimization algorithm to globally optimize the filter parameters, resulting in obvious deficiencies in the suppression effect and robustness in the complex multi-interference superposition scene. Therefore, an ant colony algorithm optimization method for electromagnetic interference suppression of Power Patrol UAV is proposed.
2 HIGH-DENSITY INTEGRATED ELECTROMAGNETIC INTERFERENCE SUPPRESSION FOR POWER INSPECTION UAVs
This section focuses on the problem of high-density integrated electromagnetic interference of Power Patrol UAVs in complex electromagnetic environments, and carries out systematic research from four aspects (signal waveform optimization, interference time-frequency domain feature extraction, interference detection, interference suppression) and proposes a complete set of interference suppression method processes.
Based on wavelet decomposition as the signal front-end de-noising foundation, using discrete Fourier transform as the time-frequency domain bridge, using matched filtering to capture transient weak anomaly characteristics, using a support vector machine (SVM) to complete interference classification detection, and finally using an ant colony algorithm to adaptively optimize the filter coefficient to realize interference suppression, these five methods constitute a complete technical link from signal preprocessing feature extraction intelligent detection adaptive suppression, and each link is collaborative and complementary, breaking through the limitations of the traditional single method in the complex electromagnetic environment.
2.1 Optimization of signal waveform for unmanned aerial vehicles in power inspection
The electromagnetic interference coupling effect [6, 7] exists between the external environment of the Power Patrol UAV and the airborne equipment, and the signal quality directly affects the interference suppression effect. Therefore, the wavelet decomposition method is used to reconstruct and optimize the signal waveform before interference suppression, so as to improve the signal quality and prevent the suppression process from reducing signal stability. The dual optimization strategy of wavelet decomposition wavelet transform adopted in this section is different from the traditional single wavelet de-noising method. The refined separation of signal and noise is achieved by introducing binary wavelet transform, which provides a high-quality signal base for subsequent time-frequency feature extraction.
Based on the Nyquist sampling theorem, the sampling rate should be at least twice the highest frequency of the signal to avoid signal aliasing on the same frequency. Assuming the continuous time of the power inspection drone signal is , where represents the time variable. In order to convert the continuous signal of the power inspection drone into a discrete signal, it is necessary to sample at a fixed sampling interval on the time axis. The discrete signal of the sampled power inspection drone and the discrete data sequence of the power inspection drone signal collected by the sensor are:
| (1) |
where represents the index of the sampling point, which represents the position of the sampling point.
By combining wavelet transform operations, is transformed into a series of approximate coefficients and detail coefficients. Assuming that represents the level of decomposition, the specific expression for wavelet decomposition is:
| (2) |
where represents the approximation coefficient of the -th layer, and represents the detail coefficient of the -th layer. Combined with threshold processing, wavelet coefficients are denoised, and differentiation threshold is set based on signal characteristics and noise level. Low-frequency signals use lower threshold to retain the main components [8, 9, 10], and high-frequency signals use higher threshold to remove noise. The approximate coefficients and detail coefficients of each layer are used to reconstruct layer by layer through inverse wavelet transform from top to bottom. The approximate coefficients of the highest layer are used as the initial signal, and the detail coefficients of the current layer are fused step by step. After completing all levels of transformation, the preliminary reconstructed signal is obtained:
| (3) |
where represents the intermediate signal generated during the inverse wavelet transform process, and represents the discrete signal of the reconstructed power inspection drone signal.
The interference signal is separated into different frequency components by wavelet decomposition. The high-frequency noise is denoised by threshold and the key low-frequency components are retained. The original waveform is reconstructed layer by layer by inverse wavelet transform. On this basis, wavelet transform is introduced to realize signal-to-noise separation. The environmental interference and UAV signals are effectively divided, and the echo signals are summarized to form the observation sequence.
Using the idea of wavelet transform, the interference observation sequence is transformed to obtain the first wavelet transform result. Perform binary discretization processing on scale parameters to generate binary wavelet transform results:
| (4) |
where represents the scale parameter of wavelet transform, represents the mother wave function, represents the duration of pulse continuity, represents the absorption coefficient of electromagnetic wave interference, represents the mother wave function in Fourier transform form, and represents the integral operation function.
The original interference signal is converted into two wavelet signals by binary wavelet transform, and the transformation coefficients are obtained. The signal points satisfying the noise characteristics in the decomposed signal are searched and set to 0. All kinds of noise are projected into different wavelet spaces, and the denoised signal waveform optimization results are generated after traversing all wavelet signal points:
| (5) |
where represents the signal variance, represents the sign function, represents the noise threshold, represents the logarithmic function, and represents the length of the electromagnetic wave interference signal sequence. Use the optimized waveform of the power inspection drone signal as the subsequent electromagnetic interference suppression result.
2.2 Extraction of interference transient time- frequency domain features based on optimized UAV signal waveform
To conduct in-depth research on the electromagnetic interference of power inspection drone signals, the transient frequency domain characteristics of the optimized power inspection drone signals in the previous section were extracted. Based on the time-frequency domain analysis of the conventional discrete Fourier transform, the matched filter transform is further introduced to capture the transient weak abnormal interference signal, which makes up for the deficiency of the pure Fourier transform in the transient feature capture. At the same time, the inverse gamma distribution aggregation is used to determine the anomaly discrimination threshold, and the refined extraction of time-frequency domain features is realized. This feature extraction process is directly linked to the waveform optimization results in section 2.1, ensuring that feature extraction is based on high-quality signals.
The transient radiation field of the units in row and column of the power inspection drone signal array can be expressed as:
| (6) |
where represents the distance between the signal array of the power inspection drone in row and column and the field point, and represents the wave number of the electromagnetic wave of the power inspection drone signal during the fluctuation process, represents the electromagnetic wavelength, represents the azimuth angle, represents the directional diagram function of the signal array unit of the power inspection drone, represents the total number of units in the signal array of the power inspection drone, and represents the high-density integrated signal value of the transient power inspection drone.
Through superposition calculation, the total transient radiation field strength of the signal array of the electric power inspection UAV is obtained, which is expressed as:
| (7) |
The transient total field strength data of the power inspection UAV signal array obtained by discrete Fourier transform processing is used to convert the initial transient field strength data into frequency domain information, and the time domain continuous curve representation is:
| (8) |
where is the bias, and are the Fourier coefficients of the -th electromagnetic interference process, and represents the duration of the transient total field strength data of the power inspection UAV signal.
The time-domain characteristics of transient total field strength of power inspection UAV signal array are transformed into transient frequency-domain characteristics of power inspection UAV signal, which is expressed as:
| (9) |
where represents the frequency domain feature length of the transient total field strength of the power inspection UAV signal array.
In the complex electromagnetic environment of power inspection, the communication signal of UAVs will experience attenuation. The time-frequency domain features are conventional time-frequency domain features, which are prone to missing transient weak interference abnormal signals. Therefore, matched filtering transformation is used to capture the time-frequency characteristics of transient abnormal signals.
Under electromagnetic interference [11], assuming the Doppler frequency deviation of the actual received UAV communication signal is , represents the pseudo code of the abnormal signal, and the optimized signal waveform is filtered again, expressed as:
| (10) |
where represents the length of the communication signal processing filter, represents the initial phase value of the communication signal, and represents the -th matched filter. According to the autocorrelation characteristics of pseudocode, the frequency difference value of the -th filter output under Doppler frequency shift is the effective compensation frequency difference value of matched filter transformation. Using the normalized frequency response of the -th matched filter, the time-frequency domain feature extraction of interference transient is completed:
| (11) |
where represents the compensation coefficient. The normalized frequency response of the -th matched filter [12, 13] is obtained by multiplying the frequency response of the fast Fourier transform with the frequency response of the partially matched filter.
When matching filter is used to extract the transient time-frequency domain characteristics, each frequency point corresponds to a group of samples, the UAV signal is crest, and abnormal interference leads to the change of energy superposition characteristics. According to this, the maximum operator is used to set the threshold to extract the abnormal characteristics, and the discrimination threshold of abnormal interference acquisition is determined according to the inverse gamma distribution aggregation normalized frequency.
2.3 High-density integrated electromagnetic interference detection based on transient time-frequency domain features of interference
The high-density integrated electromagnetic interference sources of power inspection drones are diverse, including natural electromagnetic phenomena, anthropogenic electromagnetic radiation, and enemy electronic countermeasures. These interference signals may exist in the form of continuous waves or pulse waves, causing varying degrees of interference to the communication link of UAVs. Therefore, in order to effectively suppress high-density integrated electromagnetic interference [14, 15], it is necessary to accurately detect high-density integrated electromagnetic interference from UAV communication signals based on the transient time-frequency domain characteristics of interference.
A convolutional neural network support vector machine (CNN-SVM) detection model with convolution pooling structure is constructed. The multidimensional transient time-frequency domain features extracted in section 2.2 are used as input, and the local spatial correlation of features is automatically extracted through convolution layer. The pooling layer reduces the feature dimension and enhances the noise resistance. Finally, SVM completes the nonlinear classification decision. Compared with the traditional SVM which directly inputs the original features, the CNN-SVM structure significantly improves the recognition accuracy of complex electromagnetic interference patterns, and provides reliable interference localization and classification results for the adaptive suppression in section 2.4.
SVM is a widely used machine learning method for classification problems. The basic principle is to find the optimal linear classifier that maximizes the boundary distance on the training dataset, thereby achieving maximum stability of the classifier. For nonlinear problems, SVM maps the input space to a high-dimensional feature space by introducing a kernel function, making the originally linearly inseparable problem linearly separable [16, 17]. In the high-density integrated electromagnetic interference detection of UAVs, SVM is used as a classifier to distinguish between normal communication signals and high-density integrated electromagnetic interference. Input the extracted interference transient time-frequency domain feature parameters into the SVM model, and use a labeled training dataset (including feature parameter samples of normal communication signals and electromagnetic interference) to train the SVM model. This SVM model adds multiple convolutional and pooling layers before the fully connected layer to enhance the detection performance of electromagnetic interference signals [18, 19]. Considering the attenuation of wireless communication network signals due to diffusion loss and path loss during transmission, a linear kernel function is selected to train the detection capability of SVM:
| (12) |
where and represent the Lagrange multiplier and label of the -th electromagnetic interference feature sample in the SVM model, respectively, represents the number of training samples, and represents the bias term.
The SVM model is mapped to the signal type label. Through the classifier algorithm, the probability distribution corresponding to each signal type can be calculated:
| (13) |
where and represent the weight and bias of the classifier, respectively.
According to the principle of maximum posterior probability, the SVM model is trained to find the learning ability of maximum probability:
| (14) |
where represents the prior probability parameter of the training sample. After the training is completed, the decision function of high-density integrated electromagnetic interference classification detection based on SVM model is [20]:
| (15) |
where is the sigmoid kernel function, which is characterized by its ability to implicitly map input data to a high-dimensional space and achieve nonlinear separability of data in this high-dimensional space, is the category label of normal drone signal characteristics, is the intercept term, is the feature vector corresponding to the electromagnetic interference training sample of the power inspection drone, is the feature vector corresponding to all test samples.
The classification of SVM model is used to complete the detection of high-density integrated electromagnetic interference, and the detected interference signals are taken as the object of subsequent suppression.
2.4 Implementation of high-density integrated electromagnetic interference suppression based on ant colony algorithm
In response to the detected high-density integrated electromagnetic interference signal, a filter is used to filter out the electromagnetic interference from the drone signal by adjusting the filtering coefficient, generating a series of steady-state drone communication signals to achieve automatic suppression of high-density integrated electromagnetic interference. The innovation of this section is that the ant colony algorithm is used to globally optimize the adaptive correction feedback coefficient of the filter, and the interference category information of CNN-SVM detection output in section 2.3 is used as the optimization constraint to construct the closed-loop framework of detection guidance suppression. Compared with the fixed coefficient filter or the traditional gradient optimization method, the swarm intelligence search mechanism of an ant colony algorithm can effectively avoid falling into local optimization, realize the global optimal configuration of filter parameters in the complex multi-interference superposition scene, and minimize signal loss. The ant colony algorithm is a meta heuristic optimization algorithm based on swarm intelligence, which can effectively explore different regions of the solution space, find the global optimal solution, and have good flexibility and fast convergence advantages [21, 22]. Therefore, this paper uses the ant colony algorithm to adaptively optimize the coefficients of the filter and improve the suppression effect.
The electromagnetic interference component will generate a leading phase in a specific section of the high-density integrated signal of the power inspection drone. The signal expression of the superimposed electromagnetic interference components in the -th phase interval of the high-density integrated signal of the power inspection drone is:
| (16) |
where and represent the sampling period and amplitude of the electromagnetic interference observation values, respectively, represents the high-density integrated signal quantity injected into the power inspection UAV, represents the superposition scale function.
Thus, the high-density integrated signal of the power inspection drone is divided into interference containing signals and interference-free interval signals. However, the high-density integrated signal of the power inspection drone exhibits second-order oscillation characteristics. This characteristic is manifested as a distinct electromagnetic peak on the Bode plot, and the frequency corresponding to the peak is the electromagnetic interference frequency. When the communication signal of UAVs contains signal components with frequencies similar to electromagnetic interference, it will affect the suppression effect and signal continuity, resulting in high signal loss costs for interference suppression and limiting its effectiveness in practical engineering applications. Therefore, this paper dynamically adjusts the output of the filter by monitoring and providing feedback on changes in electromagnetic interference in real time, in order to reduce signal loss. By adaptively adjusting the feedback coefficient to continuously increase the damping ratio, the goal of electromagnetic interference suppression can be achieved [23].
In order to enhance the suppression capability of the filter when dealing with key electromagnetic interference components, it is necessary to optimize its design to ensure that its output response within the main electromagnetic interference frequency range is maximally suppressed, and the electromagnetic interference components in the suppressed signal meet the requirement of being below the preset threshold, thereby improving signal quality. The mathematical model for optimizing the suppression target of the constructed filter is:
| (17) |
where and are the upper and lower frequency limits of the main electromagnetic interference segment, is the adaptive correction feedback coefficient.
The ant colony algorithm is employed for adaptive optimization of filter correction feedback coefficients. During the optimization process, the ants’ positions are treated as parameters to be optimized. To ensure successful optimization, ants must navigate through migration by employing core strategies: optimal direction identification and preference-based movement. The optimal direction identification strategy is implemented through:
| (18) | |
| (19) |
where represents the dynamic adjustment coefficient used to balance the search behavior of the ant colony. A larger value may make the ant colony more inclined towards global search, while a smaller value may promote local fine search. When is iterations, the optimal position searched by the ant colony population is the best solution among all ant colony positions, represents a random number with a value range of , which increases the randomness and diversity of the search.
The convergent mobility strategy is defined by:
| (20) |
where represents the adjusted ant colony position and represents the radius of particle motion.
Each individual ant colony adopts a movement pattern to move. The optimization process of filter parameters based on an ant colony algorithm is as follows.
Step 1: randomly generate a certain number of ant colony individuals, each of which represents a set of filter parameters. At the same time, the interference category information output from section 2.3 CNN-SVM detection is encoded into the initial pheromone distribution of ant colony search, so that the search direction is biased towards the identified interference frequency region.
Step 2: update the position of the ant colony according to the optimal direction identification strategy and the preferential movement strategy of the ant colony algorithm. In each iteration, the pheromone volatilization rate is dynamically adjusted by using the interference category label output by the detection module. When multiple types of composite interference are detected, the pheromone volatilization rate is reduced to enhance the global search ability. When a single interference is detected, the pheromone volatilization rate is increased to accelerate the local convergence.
Step 3: simulate the optimization behavior of ant colony and conduct local search in the solution space to find a better combination of filter parameters. At the same time, the signal quality feedback mechanism after interference suppression is introduced, and the SNR after interference suppression is used as the fitness evaluation index to reverse modify the pheromone update rule.
Step 4: repeat steps 2 to 3 until the upper limit of the number of iterations is reached or the SNR does not increase significantly after 10 consecutive iterations.
Step 5: after the iteration, output the ant colony position with the best performance, that is, the optimal parameters of the filter. At the same time, the final optimized parameters and the detection category information are stored in the parameter library for the rapid initialization of interference suppression in the next inspection task.
The optimal parameters are input into (17) to complete the filter optimization, and the original UAV signal is input into the filter to complete the high-density integrated electromagnetic interference suppression of Power Patrol UAV. The whole suppression process forms a closed-loop control process of detection parameter initialization optimization suppression feedback.
3 EXPERIMENT AND ANALYSIS
In order to verify the effectiveness and superiority of the proposed method in the suppression of high-density integrated electromagnetic interference of Power Patrol UAV, this section designs a comparative experiment covering a variety of interference types and different interference intensities, and systematically analyzes the experimental results from the four dimensions of waveform optimization, feature extraction, interference detection, and interference suppression.
3.1 Experimental setup
In order to verify the performance of the high-density integrated electromagnetic interference suppression method for power inspection UAVs based on an ant colony algorithm studied in this paper, experimental tests are designed. The experimental object is a power inspection UAV system operated by Zhuhai Power Supply Bureau of Guangdong Power Grid Co. Ltd, equipped with an EM-Sense 6050 high-density integrated electromagnetic sensor module (frequency response range of 10 Hz–6 GHz), used to collect electromagnetic interference signals in the transmission line corridor. The experimental scenario is a real electromagnetic interference environment (as shown in Fig. 1). The UAV inspection path within a 3-kilometer radius of the 500 kV high-voltage substation in the area where the power company is located includes typical interference sources such as wire corona discharge, partial discharge of insulators, and interference from adjacent communication base stations. Based on the real electromagnetic interference environment, a simulation platform was constructed using Keysight N9021B MXA signal analyzer and R&S SMW200A vector signal generator to generate composite electromagnetic interference signals that comply with IEEE C63.30-2021 standards (including six types: sweep frequency interference, noise frequency modulation interference, narrowband aiming interference, comb multi tone interference, frequency band noise interference, pulse noise interference). The raw electromagnetic signal collected by the UAV inspection system has a sampling rate of 1 GS/s and a resolution of 12 bits. There are a total of 12 inspection tasks, each lasting 30 minutes, with a total data volume of about 2.4 TB. Gaussian white noise () and modulation interference (carrier frequency 1–500 MHz, bandwidth 10 kHz–5 MHz) are added to generate 1000 sets of samples, each lasting for 10 ms. The data is divided into training set, validation set, and testing set in a ratio of 70:15:15.
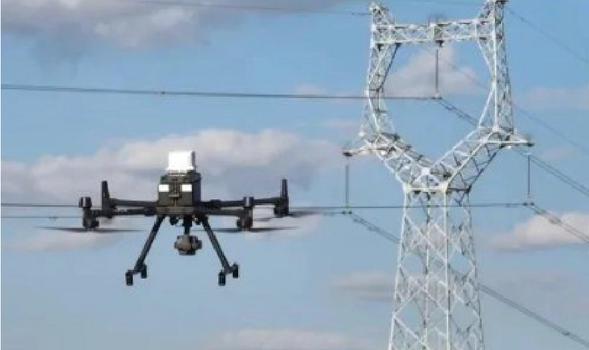
Figure 1 Experimental environment.
Based on the experimental subjects and data scale, the experimental hardware environment is set up as shown in Table 1.
Table 1 Hardware settings of experimental environment
| Hardware | Deploy |
| Drone platform | DJI Matrice 300 RTK (RTK positioning accuracy 1 cm) |
| Electromagnetic transducer | EM-Sense 6050 (6 GHz bandwidth, 16 channel synchronization) |
| Signal simulator | R&S SMW200A (20 GHz RF bandwidth) |
| Computing servers | Dell PowerEdge R750 (2 Intel Xeon Gold 6348, 512 GB DDR4, 4 NVIDIA A100 80 GB) |
| Memory system | Huawei OceanStor 6800 (total capacity 1 PB) |
| Network equipment | Cisco Catalyst 9400 |
The software environment for running the research method program is shown in Table 2.
Table 2 Experimental software environment settings
| Software Environment | Allocation |
| Monitor system | Ubuntu 20.04 LTS (Linux kernel 5.15) |
| Programming language | Python 3.8 |
| Simulation platform | MATLAB 2023a |
| Machine learning framework | SciPy 1.10.1 |
| Signal processing tools | PyTorch 1.12.1 |
Based on the above experimental software and hardware environment, run the wavelet transform, matched filter transform, SVM, and ant colony algorithm applied in this paper. The algorithm settings are shown in Table 3.
Table 3 Algorithm parameter settings
| Method | Parameter Item | Set Value |
| Wavelet Transform | Basis Function | Daubechies 4 |
| Decomposition Layers | 6 layers | |
| Support Vector Machine | Kernel Function | Radial Basis Function (RBF) |
| Grid Search Validation Step | 0.01 | |
| Matched Filtering | Typical Interference Pulse Width | 50 ns |
| Rising Edge | 20 ns | |
| Threshold Setting | (noise standard deviation) | |
| Ant Colony Algorithm (ACO) | Ant Count | 50 |
| Pheromone Factor () | 1 | |
| Heuristic Factor () | 2 | |
| Pheromone Volatilization Rate () | 0.1 | |
| Number of Iterations | 200 |
Under the same environmental and data conditions mentioned above, the methods of adaptive beamforming technology [2] and wavelet threshold denoising and magnetic interference compensation model [3] will be used as comparison methods to conduct comparative tests with the method proposed in this paper.
3.2 Analysis of experimental results
3.2.1 Optimization results of power inspection UAV signal waveform
This paper uses wavelet decomposition transform to reconstruct and optimize the waveform of the power inspection drone signal before interference suppression, in order to improve signal quality. The waveform optimization results of the power inspection drone signal obtained by this method are shown in Fig. 2.
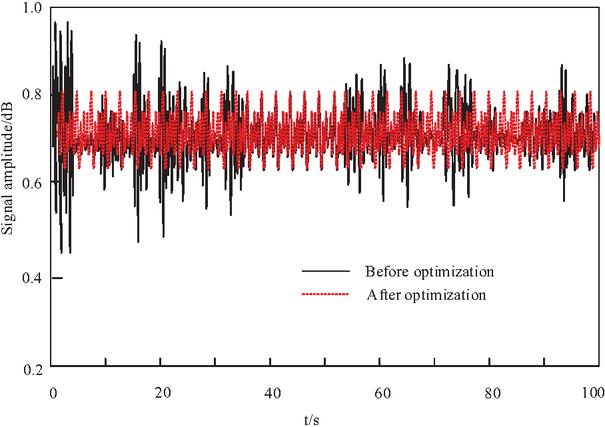
Figure 2 Optimization results of signal waveform for unmanned aerial vehicle for power inspection.
From the experimental results in Fig. 2, it can be seen that the optimized signal waveform exhibits significant optimization effects compared to the original signal. The high-frequency noise and interference components have been effectively decomposed, resulting in smoother and more stable signal waveforms. At the same time, the amplitude and phase information of the drone signal were accurately preserved without any significant distortion or distortion.
3.2.2 Extraction results of interference transient time-frequency domain features
Based on the transient radiation total field strength of the drone signal array, the discrete Fourier transform is used to extract the transient frequency domain features of the optimized power inspection drone signal at different frequencies. The extraction results are shown in Fig. 3.
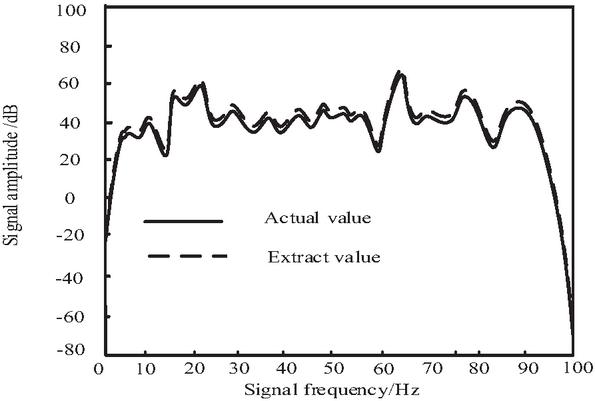
Figure 3 Extraction results of time-frequency domain features of interference transient.
As shown in Fig. 3, the method proposed in this paper extracts the frequency domain amplitude characteristic peak values of electromagnetic interference signals from UAV signal arrays through discrete Fourier transform, which are basically consistent with the actual interference peak values, with an error of less than 5 dB, meeting the requirements of signal feature extraction. Based on the frequency domain amplitude characteristic peak, interference signals can be effectively detected.
3.2.3 High density integrated electromagnetic interference detection effect
This method is based on the time-frequency domain characteristics of interference transients, and runs a SVM algorithm with set parameters to detect high-density integrated electromagnetic interference from power inspection drones in drone communication signals. Compare the accuracy of three methods for detecting six types of electromagnetic interference: sweep frequency interference, noise frequency modulation interference, narrowband aiming interference, comb shaped multi tone interference, frequency band noise interference, and pulse noise interference. Use a confusion matrix to characterize the detection results, as shown in Fig. 4.
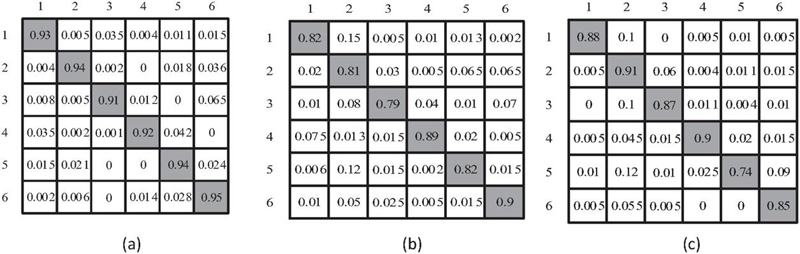
Figure 4 Comparison of the accuracy of high-density integrated electromagnetic interference detection: (a) approach of the present study, (b) methodology of adaptive beamforming technology, and (c) methodology of wavelet threshold denoising and magnetic interference compensation model.
Table 4 Comparison of electromagnetic interference detection performance of different methods
| Method | Average | Average Recall | Average | Average Detection |
| Accuracy (%) | Rate (%) | F1 Score | Time (ms) | |
| Proposed Adaptive beamforming technology | 96.4 | 95.7 | 96.0 | 12.3 |
| Wavelet threshold denoising and magnetic | 82.1 | 79.3 | 80.7 | 18.7 |
| interference compensation model | 85.6 | 83.2 | 84.4 | 15.9 |
From Fig. 4, it can be seen that the proposed method has a much higher accuracy rate in detecting high-density integrated electromagnetic interference than the other two methods, indicating that the proposed method can more accurately classify different types of electromagnetic interference signals into corresponding categories, reducing false positives and false negatives, and has advantages in detection accuracy.
In order to further quantify the detection performance, this paper calculates the average accuracy, recall, and F1 scores of each method on the test set, as well as the average time-consuming of a single detection (ms). The results are shown in Table 4. It can be seen from Table 4 that the accuracy rate, recall rate, and F1 score of this method are significantly better than those in adaptive beamforming technology and wavelet threshold denoising and magnetic interference compensation model, which are at least 10.8, 12.4, and 11.6 percentage points higher. This shows that the proposed method has lower risk of false detection and missed detection in interference detection.
In terms of computational efficiency, due to the CNN-SVM structure, the convolution layer and pooling layer can extract features in parallel, and the average time-consuming of a single detection is only 12.3 ms, 34% less than the method in adaptive beamforming technology and 23% less than the method in wavelet threshold denoising and magnetic interference compensation model, which can meet the requirements of UAV real-time processing. It is worth discussing that the method in adaptive beamforming technology relies on traditional SVM to directly input the original features, which has a weak ability to distinguish complex interference patterns, resulting in a low recall rate. Although the method in wavelet threshold denoising and magnetic interference compensation model uses the depth network, it is not optimized for the time-frequency domain features, and the features are easy to be confused under low SNR, so the accuracy rate is lower than that of this method. In this paper, the weak transient characteristics are enhanced by matched filter transform and, combined with CNN-SVM structure, the high-precision and high-efficiency interference detection is realized.
3.2.4 Suppression effect of high-density integrated electromagnetic interference for power inspection UAVs
The electromagnetic interference suppression method proposed in this paper is applied to suppress the high-density integrated electromagnetic radiation interference of power inspection drones. The amplitude spectrum of electromagnetic interference before and after suppression is shown in Fig. 5.
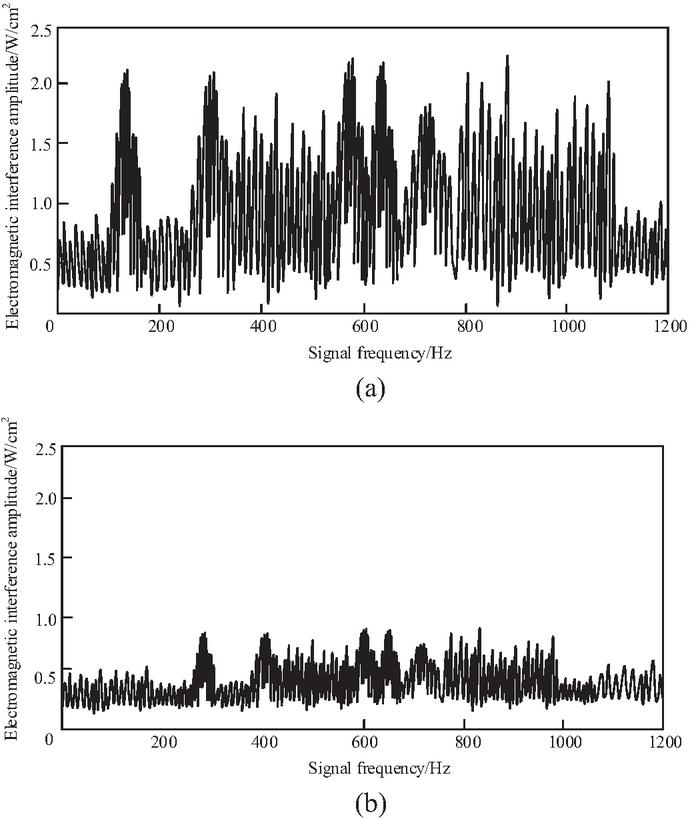
Figure 5 Electromagnetic interference amplitude (a) before and (b) after suppression.
From Fig. 5 it can be seen that, before electromagnetic interference suppression, the electromagnetic amplitude of the drone signal can reach over 2.0 W/cm2. After applying the method described in this paper for suppression, the electromagnetic interference intensity was significantly reduced, and the electromagnetic amplitude change tended to stabilize, controlled at a level below 1 W/cm2. This result indicates that the suppression method proposed in this paper has significant effectiveness in practical applications.
In order to quantitatively demonstrate the suppression effect of the method proposed in this paper, SNR was selected as the evaluation index. The larger the SNR, the better the electromagnetic interference suppression effect, making the communication signal of the drone clearer. The signal-to-noise of high-density integrated electromagnetic interference suppression for power inspection drones using three comparative methods is shown in Fig. 6.
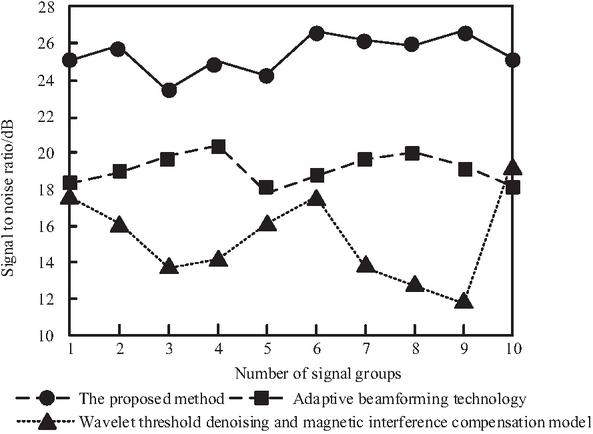
Figure 6 Signal-to-noise ratio for electromagnetic interference suppression.
From Fig. 6 it can be seen that, as the number of signal groups increases, the SNR of our method fluctuates but, overall, it remains above 22 dB and consistently higher than the other two methods, proof that the proposed method has the best electromagnetic interference suppression effect, which can better preserve useful signals while suppressing electromagnetic interference, thereby improving signal quality.
In order to further verify the robustness of this method under different interference intensities, the electromagnetic interference suppression performance of this method, adaptive beamforming technology method, and wavelet threshold denoising and magnetic interference compensation model method are compared in four scenarios with SNRs of 5 dB, 10 dB, 15 dB, and 20 dB. At the same time, in order to investigate the comprehensive suppression ability of the method under the condition of superposition of multiple types of interference, two groups of composite interference scenarios, i.e., frequency sweep interference and narrowband aiming interference, impulse noise interference and frequency band noise interference, were set for testing. The SNR results of each method after suppression in different scenes are shown in Table 5. It can be seen from Table 5 that under the four single interference intensity scenarios, the SNR after suppression of this method is significantly better than that of adaptive beamforming technology and wavelet threshold denoising and magnetic interference compensation model, especially under the condition of strong interference with low SNR (5 dB). The SNR of this method is 6.3 dB higher than that of adaptive beamforming technology and 4.5 dB higher than that of wavelet threshold denoising and magnetic interference compensation model, reflecting the stronger anti-interference ability of this method in the strong interference environment.
Table 5 Comparison of signal-to-noise ratio after suppression by various methods in different scenarios
| Scenario/Method | Proposed | Adaptive | Wavelet Threshold Denoising and Magnetic |
| Method | Beamforming Technology | Interference Compensation Model | |
| 18.6 | 12.3 | 14.1 | |
| 21.4 | 15.8 | 17.2 | |
| 24.7 | 19.5 | 20.8 | |
| 27.3 | 22.1 | 23.6 | |
| frequency+narrowb and composite interference | 19.2 | 13.5 | 15.8 |
| Pulse+band composite interference | 17.8 | 11.7 | 13.9 |
In the complex interference scenario, the proposed method also maintains the highest SNR after suppression, which shows that the filter parameters optimized by an ant colony algorithm can adaptively cope with the complex situation of multi type interference superposition and has good robustness. The method in Cheng et al. [2] relies on adaptive beamforming, which reduces the accuracy of beam pointing control when multiple interference sources exist at the same time, resulting in the deterioration of the suppression effect. The wavelet threshold de-noising method in Yang and Li [3] has the problem of confusion between high-frequency useful signals and interference components in the face of composite interference, and the improvement of SNR after suppression is limited. To sum up, this method shows the optimal suppression performance and the strongest robustness under the conditions of different interference intensity and multiple types of interference superposition, and can effectively ensure the communication reliability of Power Patrol UAV in complex electromagnetic environment.
4 CONCLUSION
The paper studies the high-density integrated electromagnetic interference suppression method for power inspection unmanned aerial vehicles based on an ant colony algorithm. Using wavelet decomposition transform to optimize the signal waveform of power inspection unmanned aerial vehicles, combined with discrete Fourier transform processing and matched filtering transform, extracting the time-frequency domain characteristics of interference transients, and using an ant colony algorithm to achieve high-density integrated electromagnetic interference suppression of power inspection unmanned aerial vehicles. The test results show that the frequency domain amplitude characteristic peak of the electromagnetic interference signal extracted by this method has a low error compared to the actual interference peak, effectively reducing the intensity of electromagnetic interference and improving the signal-to-noise ratio and quality of the signal.
REFERENCES
[1] J. H. Kim, G. J. Kim, and Y. M. S. Ju, “A review of the effectiveness of shielding curtains for improving radiation safety management of electromagnetic radiation in diagnostic X-ray rooms,” J. Magn., vol. 28, no. 4, pp. 438–442, 2023.
[2] J. M. Cheng, Y. Li, and G. F. Zhu, “High density integrated electromagnetic interference suppression technology for unmanned aerial vehicle remote communication,” Mod. Electr. Tech., vol. 47, no. 12, pp. 96–100, 2024.
[3] J. Yang and B. Li, “Anti-electromagnetic interference design of unmanned aerial vehicle automatic inspection system in substation,” Mach. Des. Manuf. Eng., vol. 53, no. 3, pp. 83–86, 2024.
[4] N. Li, K. Cao, B. Li, J. Yang, and X. Zhang, “Research on anti-electromagnetic interference technology of transmission line inspection based on multi-rotor UAV,” Manuf. Autom., vol. 45, no. 10, pp. 29–33, 2023.
[5] Q. Meng, B. Zhang, W. L. Yao, H. Yin, Y. Zhou, and X. K. Ge, “A study on adaptive variable polarization anti-jamming antenna of UAV,” Mod. Radar, vol. 46, no. 6, pp. 61–66, 2024.
[6] H. Akbari, S. Taeb, and A. A. H. Adibzadeh, “Nonionizing electromagnetic irradiations; biological interactions, human safety,” Shiraz Univ. Med. Sci., vol. 13, no. 4, pp. 299–308, 2023.
[7] R. Ramirez-Vazquez, I. Escobar, and V. E. Arribas, “Personal exposure to radiofrequency electromagnetic fields: A comparative analysis of international, national, and regional guidelines,” Env. Res. Section A, vol. 246, no. 4, pp. 11812401–11812411, 2024.
[8] C. Osman, K. Baha, and Y. S. Cagri, “Assessment of occupational exposure levels of cleaning product manufacturing factory workers to electromagnetic fields,” Radiat. Prot. Dosimetry, vol. 198, no. 4, pp. 197–207, 2022.
[9] E. V. Styazhkina, Y. R. Akhmadullina, Y. V. Gainetdinova, E. A. Payalova, and E. A. Pryakhin, “Mutagenic effect during combined exposure to ionizing and non-ionizing electromagnetic radiation,” Bull. Exp. Biol. Med., vol. 176, no. 5, pp. 645–648, 2024.
[10] I. Ruiz, G. Vizkelethy, A. E. E. Mcdonald, S. W. Howell, P. M. Thelen, M. D. Goldflam, and T. E. Beechem, “Detection of high energy ionizing radiation using deeply depleted grapheme-oxide-semiconductor junctions,” J. Appl. Phys., vol. 132, no. 18, pp. 1845031–1845038, 2022.
[11] M. Vaughan, W. Michailow, M. Tan, M. Salih, L. Li, H. Beere, D. A. Ritchie, E. H. Linfield, A. G. Davies, and J. E. Cunningham, “Enhanced delivery and detection of terahertz frequency radiation from a quantum cascade laser within dilution refrigerator,” J. Low Temp. Phys., vol. 213, no. 5/6, pp. 306–316, 2023.
[12] G. Xiao, R. Gu, N. Sun, and Y. Zhang, “Research on feature matching optimization algorithm for automotive panoramic surround view system,” Comput. Syst. Sci. Eng., vol. 48, no. 5, pp. 1329–1348, 2024.
[13] T. Joseph, T. Fischer, and M. Milford, “Matched filtering-based LiDAR place recognition for urban and natural environments,” IEEE Robot. Autom. Lett., vol. 10, no. 3, pp. 2566–2573, 2025.
[14] S. Uechi and K. Shiba, “Effects of electromagnetic fields generated from transcutaneous transformer: Analysis of internal electric field when the number of transmitting and receiving coil layers is changed,” J. Japan Soc. Appl. Electr. Mech., vol. 30, no. 2, pp. 222–229, 2022.
[15] I. Collado, A. Vazquez-Lopez, S. Heredia, J. Vega, A. Jiménez-Suárez, D. Maestre, and S. G. Prolongo, “Electromagnetic interference shielding of a sequential dual-curing thiol-epoxy system reinforced with GNPs with high shape memory,” ACS Appl. Mater. Interf., vol. 17, no. 12, pp. 18954–18970, 2025.
[16] M. M. Vijay, S. G. Kumar, R. S. Subramanian, M. Karthikeyan, G. Krishnaraj, and N. Manikanda Prabu, “Light spectrum optimization based Adaboost SVM for the secured communication in vehicular Ad Hoc network,” AIP Conf. Proc., vol. 3204, no. 1, p. 020019, 2025.
[17] S. Bayrak, “Unveiling intrusions: Explainable SVM approaches for addressing encrypted Wi-Fi traffic in UAV networks,” Knowl. Inform. Syst., vol. 66, no. 11, pp. 6675–6695, 2024.
[18] U. K. Lilhore, S. Dalal, and S. Simaiya, “A cognitive security framework for detecting intrusions in IoT and 5G utilizing deep learning,” Comput. Secur., vol. 136, pp. 10356001–10356022, 2024.
[19] B. Panda and P. Singh, “A deep convolutional-GRU-SVM-based hybrid approach for signal detection of uplink NOMA system,” Wirel. Pers. Commun., vol. 138, no. 2, pp. 861–878, 2024.
[20] C. Guo, L. You, X. Li, G. Hu, S. Wang, and C. Cao, “A novel biometric authentication scheme with privacy protection based on SVM and ZKP,” Comput. Secur., vol. 144, pp. 10399501–10399512, 2024.
[21] M. J. Alam, R. Chugh, S. Azad, and R. Hossain, “Ant colony optimization-based solution to optimize load balancing and throughput for 5G and beyond heterogeneous networks,” J. Wirel. Commun. Network., vol. 2024, no. 1, p. 44, 2024.
[22] X. Jia, C. Tang, and X. L. J. Zhang, “Research on dual robot collaboration method based on improved double ant colony algorithm,” Ind. Robot, vol. 51, no. 3, pp. 424–435, 2024.
[23] Y. Huang, J. Zhao, and J. G. Chen, “Anti-interference method of electronic communication signal in complex electromagnetic environment,” Comput. Simul., vol. 40, no. 8, pp. 159–163, 2023.
BIOGRAPHIES

Jian Chen, male, born August 1986, of Han ethnicity, Qingyuan, Guangdong, China. He graduated with a bachelor’s degree in Automation from Guangdong University of Technology in 2009 and earned a master’s degree in Electrical Engineering from South China University of Technology in 2015. His research focuses on power communication and network security. From 2009 to present, he has served as a senior engineer at Zhuhai Power Supply Bureau, Guangdong Power Grid Co. Ltd.

Yuxuan Huang, born February 1996, male, native of Zhuhai, Guangdong, China, Han ethnicity, graduated with a bachelor’s degree in Electronic Information Science and Technology from Guangdong University of Technology in 2018. His research focus is electronic communication. From 2018 to present, he has served as an engineer at Zhuhai Power Supply Bureau, Guangdong Power Grid Co. Ltd.

Ziheng Wan, born May 1999, male, from Foshan, Guangdong, China, Han ethnicity. He graduated with a bachelor’s degree in Automation from Guangdong University of Technology, in 2022. His research focuses on power emergency response and satellite communication systems. From 2022 to present, he has worked as an engineer at the Zhuhai Power Supply Bureau of Guangdong Power Grid Co. Ltd.
ACES JOURNAL, Vol. 41, No. 7, 665–677
DOI: 10.13052/2026.ACES.J.410707
© 2026 River Publishers