Smart Electricity Meter Prognostics Based on Lithium Battery RUL Prediction
Ye Chen1, 2, Ziyi Chen3, Mengmeng Zhu1, 2, Yaohua Liao1, 2, Fang Luo1, 2 and Xinru Li4,*
1Electric Power Research Institute of Yunnan Power Grid Co. Ltd, Kunming 650217, China
2Key Laboratory of CSG for Electric Power Measurement, Kunming 650217, China
3Shenyang Agricultural University, Shenyang 110866, China
4Faculty of Information Engineering and Automation, Kunming University of Science and Technology, Kunming 650500, China
E-mail: lxrtwz@163.com
*Corresponding Author
Received 02 September 2021; Accepted 28 September 2021; Publication 30 November 2021
Abstract
Smart Electricity Meters (SEMs) are widely used in distributed generation system, and over 67% of its failure are caused by battery low-voltage. Therefore, it is necessary to study the degradation of battery voltage. This work explores the degradation mechanism of lithium battery and proposed to use voltage as degradation index to estimate the health status of the system. Four groups of batteries of the same type and batch are used for the test. The purpose is to use multiple sets of data to train the model parameters and enhance the robustness of the model. The Particle Filtering (PF) based approach is used in this study to estimate the degradation state such that the Remaining Useful Life (RUL) can be predicted. An accurate prediction can provide the proper maintenance/replacement schedule for the SEMs before the failure occurs.
Keywords: Smart electricity meters, lithium battery, remaining useful life, particle filtering.
Introduction
Distributed generation is an important part of the country’s energy power generation, and it occupies an important position in the sustainable development of energy. The energy generated by distributed generation will eventually be distributed to thousands of households through SEMs. Improving the reliability of SEMs can effectively enhance the power supply stability of the power system. As one of the core components of SEMs, the state of battery directly affects metering, clock, communication and data storage. Muhammad et al. (2019) reviewed the potential of second-life batteries lies in their State of Health (SOH) or RUL. Its normal service life is more than 5 years (Abdel-Monem et al., 2016). However, due to the variation of its operating conditions, the battery failure may occur and the service life of SEMs will be shortened.
The faults dataset of SEMs collected by Yunnan Power Grid includes a total number of 643,000 fault events are shown in Table 1.
Table 1 Failure types of SEM
| Order Number | Fault Type | Fault Number | Proportion |
| 1 | Low-voltage | 433722 | 67.38% |
| 2 | Clock error | 101019 | 15.69% |
| 3 | Abnormal measurement | 27325 | 4.25% |
| 4 | Abnormal electricity | 26522 | 4.12% |
| 5 | 485 communication error | 20624 | 3.21% |
| 6 | Basic error | 10447 | 1.61% |
| 7 | Clock error | 5356 | 0.82% |
| 8 | Time switching | 3466 | 0.54% |
| 9 | Crash | 3440 | 0.53% |
| 10 | Black/White screen | 2763 | 0.42% |
It indicates that the number of failures caused by battery low- voltage is 433722, accounting for 67.38% of the total fault data. Therefore, it is assumed that the working life of the battery is the most important factor affecting the reliable operation of SEMs.
The method based on Kalman Filter (KF) is usually used to estimate the RUL of lithium-ion battery (Duan et al., 2020; Ma et al., 2019; Avadhanula et al., 2020; Xie et al., 2019). Omariba et al. (2018) adopt PF algorithm to predict battery capacity. The improved PF algorithms have contributed to the prediction performance (El Mejdoubi et al., 2019; He et al., 2018; Jiao et al., 2020). Song et al. (2018) uses correlation vector machine to output a new estimator, and uses Kalman filter to optimize the physical degradation model of the estimator, which improves the long-term prediction performance of battery RUL prediction. Xiong et al. (2017) proposed a double-scale PF method, which has strong robustness in practical application. The method used in the above literatures is mainly based on capacity, power or impedance characteristics to achieve the prediction of battery RUL, but do not directly solve the problems raised in this paper.
However, the voltage of the battery could be also an important degradation indicator and few works have focused it. Therefore, this paper wants to employ the test bench to simulate the actual working state of the battery, obtain the open circuit voltage data of the battery, and propose a PF-based approach to predict the RUL of SEMs by estimating the time point of the battery reaches the low-voltage status. Thus, the battery can be timely replaced before the failure, so as to ensure the safety and stability of the power system.
1 Methods
In this paper, PF-based approach is used to predict the time point of under voltage of lithium battery to prognostics the RUL of SEM. In the selection of degradation model, the polynomial model and exponential model are compared to determine the most appropriate degradation equation, and the initial parameters are optimized. The data used in the work comes from the test bench.
The main task of prognostics is to estimate the remaining operating time before failure and to assess the risk of one or more failure modes that exist or will occur, The RUL refers to the expected continuous normal working time of the components or subsystems of the system from the current moment to the moment of potential failure. A typical degradation path estimation is illustrated in Figure 1. The measurements are used to train the prognostic tool during a learning period before the prediction time step t. Then the learned behavior of the degradation path, such as the degradation trend, is used to predict its future evolution. Each operating time can form a Probability Density Functions (PDF) about the result, and the probability maximum point corresponds to the prediction result. When the degradation curve reaches the Failure Threshold (FT), the system is deemed to have reached the End of Life (EOL). Then, the RUL can be calculated.
Each time point can form a probability distribution about the result, and the probability maximum point corresponds to the prediction result.
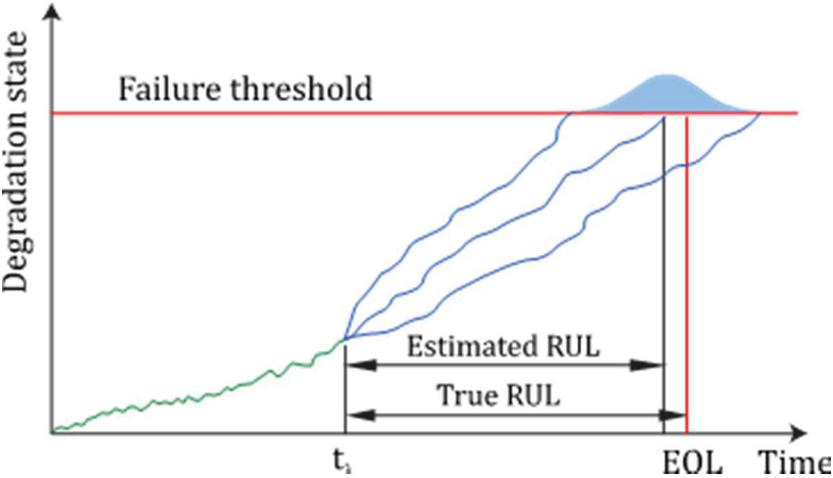
Figure 1 Degradation state estimation and RUL prediction.
According to their uncertainties, RUL predictions can be performed at different prediction time steps, as shown in Figure 2. Each of these prediction results can be compared with the real RUL to evaluate the prediction performance. The uncertainties of the predicted RUL are expressed by the PDF. The uncertainty is smaller and smaller, and when the t is close to EOL, the prediction results are very accurate.
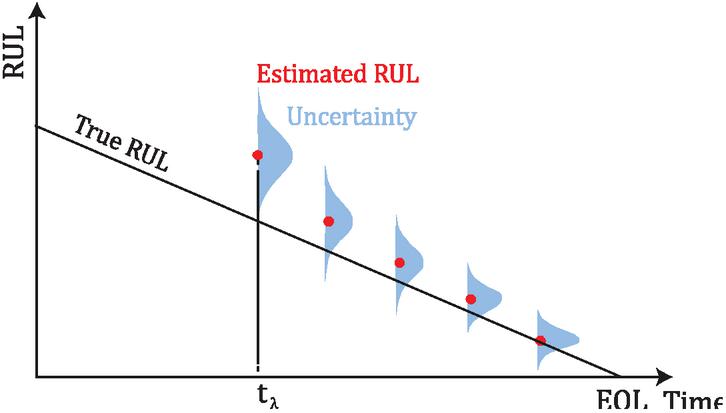
Figure 2 RUL predictions at different time steps.
In this paper, the initial state is divided into 5000 particles. particles carrying the probability information of unknown state and model parameters are transmitted through the degradation model. The new PDF is compared with the measured data for importance sampling, that is to remove the small weight particles and copy the heavy.
1.1 Degradation Models
A system in operation is considered that deteriorate from brand new to its EOL. Suppose the system and the observation describing the evolution of the degradation can be governed by discrete-time state transition models. They are composed of the transition (degradation) equation describing the relationship between system input and state, and the observation equation linking the measurements with the underneath true system’s state. A general dynamic system can be described by the following discrete-time state-space functions:
| (1) | ||
| (2) |
Where x is the system state, is the model parameters, z is the measurement, and are the process noise and measurement noise, respectively, and noise is independent and identically distributed. From the viewpoint of Bayesian theory, the problem of state estimation is to calculate the credibility of the current state based on posterior knowledge. It requires recursive calculation through two steps of prediction and update. The prediction process is to use the following transition model to predict the prior probability density of the state (An et al., 2013). The update process uses the latest measured value to correct the prior probability density to obtain the posterior probability density.
| (3) | ||
| (4) |
Where, are the current state, and are the degradation model parameters, and are the current time and the previous time, respectively.
It has been proven that Bayesian estimation techniques provide a framework that can deal with high uncertainties in degradation processes (Dong et al., 2020; Weddington et al., 2021). Bayesian estimation with particle filtering is specifically used for non-linear or non-Gaussian processes. PF-based approaches are more and more employed for prognostic purposes, and this method is applied to degradation path estimation. For a comprehensive description, the reader is referred to a recent review on PF-based prognostics in (Jouin et al., 2016).
Battery Degradation Tests
Lithium is used as the negative electrode, carbon as the positive electrode, the solution of as the electrolyte and the positive active material. Polypropylene felt or glass fiber paper is used as the separator, and its open circuit voltage is 3.65v. Generally accepted, the general reaction equation of lithium sulfite chloride battery is as follows:
| (5) |
dissolved in , precipitated and deposited in cathode carbon black, was insoluble. And there will be a certain degree of pressure during the discharge, due to the production of .
| (6) |
It can be seen from formula (6) that the positive voltage and the percentage of lithium embedded in the positive electrode structure have a negative growth relationship, that is, when the number of lithium subunits embedded in increases, the electric quantity decreases and the voltage decreases. Therefore, the working voltage of lithium battery is selected as the corresponding health index (HI) to predict the under voltage of SEM battery.
The test bench used in the lithium battery aging test includes: customized EIS equipment, data acquisition and experimental control based on PXI chassis, programmable 4-channel DC power supply and programmable 4-channel DC electronic load, etc. A fleet of four ER14250 batteries (identified as ER13, ER14, ER15 and ER16) of the same type were used under continuous operation. After charging to the cut-off voltage of 4.2V under constant current or constant resistance, each battery is discharged under a random current load between 0.5A and 5A until its voltage drops to the preset voltage (failure) threshold of 3.2V, so as to better represent the actual battery usage. After 50 random discharge cycles, the off-line characteristics of the batteries are extracted and recorded. The experiment lasted for 240 days. The working temperature of the lithium battery is 040C, and the charge or discharge voltage varies between 3.2V and 4.2V. The battery is deemed to be down once its Open Circuit Voltage is lower than 3.7V.
2 Results
The voltage monitoring data during 240 days of the battery is used to train the PF, the degradation trend of voltage evolution is estimated by the degradation model described at Equation (4). Three degradation trajectories with the same process are used for training and initialization of the degradation model parameters for the RUL prediction.

Figure 3 Parameter estimation of ER14.
Table 2 Degradation parameter estimation
| Parameter | ER14 | ER15 | ER16 | Mean |
| 0.0002 | 0.0003 | 0.0003 | 0.0002 | |
| 0.0018 | 0.0019 | 0.0029 | 0.0019 | |
| 0.0067 | 0.0099 | 0.0070 | 0.0058 |
Parameter Estimation
There are three undetermined parameters: degradation parameter , system noise and measurement noise v. In the literature, empirical method is usually used to determine the parameters. In this study, those parameters are sequentially estimated by PF applying on degradation trajectories of ER14, ER15 and ER16. Once the historical degradation behavior is learnt, the degradation model parameters can be determined in a certain range. An example of the parameter estimation is shown in the Figure 3. The uncertainty of degradation parameters decreases with the continuous updating of particles, such that the value of the undetermined parameter can be finally obtained.
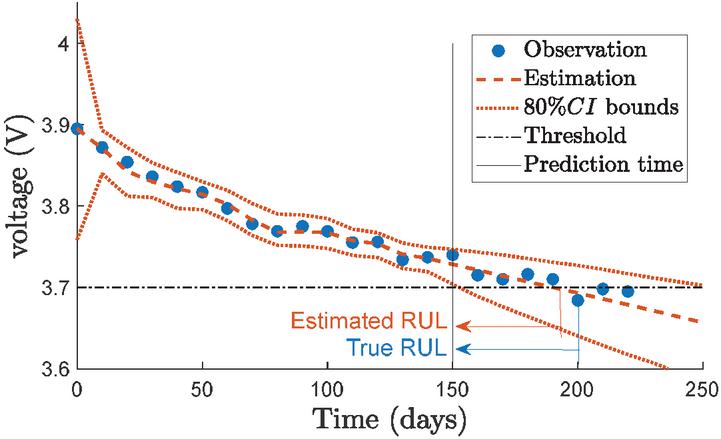
Figure 4 Voltage degradation estimation and RUL prediction at 150 days.

Figure 5 RUL PDF at 150 days.
The regression result values are listed in Table 2. The mean value of each parameter is used for the parameter initialization with 10% uncertainties. Then the PF-based prognostic approach is applied on data sets ER13.
2.1 RUL Prediction Results
With the learnt degradation behavior by PF-based estimation, the voltage degradation tend of the battery can be predicted. Figure 4 shows a state estimation and prediction example of ER13 at 150 days. The predicted EOL is 190 (RUL 40) days where the true EOL is 200 days.
The uncertainty of the predicted RUL at 150 days is shown in Figure 5. The probability density at 40 days is the highest, and it is considered that there will be 40 days until EOL, which is consistent with the results shown in Figure 4.
2.2 Prognostic Performance Evaluation
In order to evaluating the average performance of RUL predictions (Saxena et al., 2010; Saxena et al., 2012), it usually applies several RUL predictions to obtain a series of predicted RULs. RUL prediction can be made from the current moment to EOL at various time steps with their uncertainties. The prognostic performance can be evaluated by comparing each prediction with the true RUL, as shown in Figure 6. The black dashed line is the true RUL computed from the measurement time reaches the FT. The red dots are the predicted RULs from prediction time 50 days to 200 days with an interval of 10 days. The initial prediction was inaccurate, and later the predicted value was getting closer to the real value.
The predicted RULs with their uncertainties are described by boxplots shown in Figure 7. The boxplot represents the predicted RUL distribution. The blue box represents the prediction uncertainty in the 80% confidence interval. The red line in the box represents the median of PDF. As the prediction point moves back, its uncertainty becomes smaller and smaller.
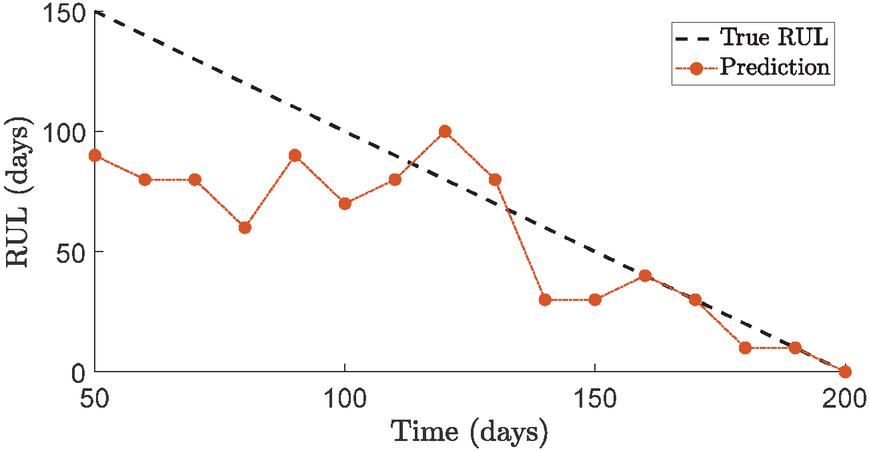
Figure 6 RUL predictions results.
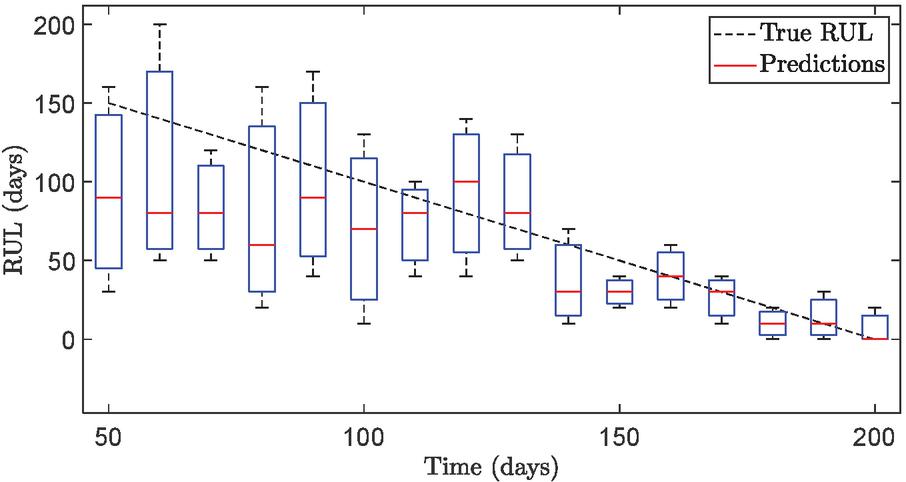
Figure 7 RUL predictions with uncertainties.
Then, the performance indexes of Accuracy and Precision are applied on the prediction results for the prognostic performance evaluation (M et al., 2016; Al-Dahidi et al., 2017; Zhang et al., 2019).
The accuracy indicates the relative accuracy of the prediction results:
| (7) |
Table 3 Forecast performance evaluation results
| Model | Acc | Prc |
| Polynomial | 0.71 | 1.10 |
| Exponential | 0.75 | 0.96 |
This indicator is more cautious, and the classification threshold is higher. where t is the prediction time index, is the relative accuracy of moment , and represent the actual value of RUL and the estimated value of RUL at moment , respectively. The larger the value, the greater the accuracy.
The precision calculating the relative width of the prediction interval, can describe changes in accuracy and recall:
| (8) |
where and are the upper and lower bounds of the confidence interval CI, respectively. The smaller the value, the greater the precision.
The average performance over 16 predictions (from 50 to 200 days) of two degradation models are listed in Table 3. The final prediction performance evaluation results are shown in Table 3: The prediction results of the exponential model are better. The method to determine the initial value of parameters by training degradation curve is more scientific, and the prediction performance is also well.
3 Discussion
The evaluation results show that the exponential model has a better predictive effect than the polynomial model in this work. Therefore, the exponential degradation model is selected as the transfer function in the prediction process. At 150 days in the prediction process, the predicted RUL is 40 days and the real RUL is 50 days. The predicted results are consistent with the measured data. The results show that the predictions become closer and closer to the true RUL. Boxplot of RUL predictions also implies that with more degradation information learnt, the predictions become more accurate, which enables the feasibility of using the PF-based method to estimate the battery health state based on its voltage degradation.
4 Conclusions
In this work, the voltage data is used as the degradation indicator rather than the capacity. Two transition models are tested for the degradation trend. It can speed up the convergence speed of gradient descent, and reduce the problem of gradient disappearance or gradient explosion caused by uninitialization or improper initialization. Each model is trained by implanting itself on multiple historical degradation trajectories, using PF techniques. Then the battery RULs are predicted. The prediction results are consistent with the experimental data. The proposed approach shows a satisfied performance in terms of the accuracy and precision. This could provide an aspect for reliability studies of smart meters and optimization of the maintenance schedule of SEMs. Moreover, the degradation behavior could be better acquired if the in-depth degradation mechanisms of the lithium battery and the smart meter are well understood. The future work could be devoted to find out suitable degradation indicators of the smart meters and its components to achieve a better prognostic performance.
Acknowledgments
This work is supported by the National Natural Science Foundation of China (51667011 and 61962031) and the Applied Basic Research Project of Yunnan (2018FB095).
References
[1] Abdel-Monem, M., Hegazy, O., Omar, N., Trad, K., Bossche, P., Van Den, and Mierlo, J. Van. 2017. Lithium-ion batteries: Comprehensive technical analysis of second-life batteries for smart grid applications. 2017 19th European Conference on Power Electronics and Applications, EPE 2017 ECCE Europe, 2017-Janua, 1–16.
[2] Al-Dahidi, S., Di Maio, F., Baraldi, P., and Zio, E., 2017. A switching ensemble approach for remaining useful life estimation of electrolytic capacitors. In L. Walls, M. Revie, & T. Bedford (Eds.), Risk, Reliability and Safety: Innovating Theory and Practice, 2000–2005.
[3] An, D., Choi, J. H., and Kim, N. H., 2013. Prognostics 101: A tutorial for particle filter-based prognostics algorithm using Matlab. Reliability Engineering and System Safety, 115, 161–169.
[4] Avadhanula, A. K. and Kulkarni, S. S., 2020. Comparative Study of Mathematical Models and Data Driven Models for Battery Performance Parameter Estimation. In India, 2020 Third International Conference on Advances in Electronics, Computers and Communications, (unpublished).
[5] Dong, G., Han, W., and Wang, YJIToIE, 2020. Dynamic Bayesian Network-Based Lithium-Ion Battery Health Prognosis for Electric Vehicles, pp. 99.
[6] Duan, B., Zhang, Q., Geng, F., and Zhang, C., 2020. Remaining useful life prediction of lithium-ion battery based on extended Kalman particle filter. International Journal of Energy Research, 44(3), 1724–1734.
[7] El Mejdoubi, A., Chaoui, H., Gualous, H., Van Den Bossche, P., Omar, N., and Van Mierlo, J., 2019. Lithium-ion batteries health prognosis considering aging conditions. IEEE Transactions on Power Electronics, 34(7), 6834–6844.
[8] He, C., Liu, C., Wu, Y., and Wu, T., 2018. Estimation for SOC of Electric Vehical Lithium Battery Based on Artificial Immune Particle Filter. In China, 2018 3rd International Conference on Smart City and Systems Engineering, ICSCSE 2018, 675–678.
[9] Jouin, M., Gouriveau, R., Hissel, D., Péra, M.-C., and Zerhouni, N., 2016. Particle filter-based prognostics: Review, discussion and perspectives. Mechanical Systems and Signal Processing, 72–73, 2–31.
[10] Kuriqi, A., Pinheiro, A. N., Sordoward, A., and Garrote, L., 2019. Influence of hydrologically based environmental flow methods on flow alteration and energy production in a run-of-river hydropower plant. Journal of Cleaner Production, 232, 1028–1042.
[11] Levieux, L. I., Inthamoussou, F. A., and De Battista, H., 2019. Power dispatch assessment of a wind farm and a hydropower plant: A case study in Argentina. Energy Conversion and Management, 180, 391–400.
[12] Ma, Y., Chen, Y., Zhang, F., and Chen, H., 2019. Remaining Useful Life Prediction of Power Battery Based on Extend H8 Particle Filter Algorithm. Jixie Gongcheng Xuebao/Journal of Mechanical Engineering, 55(20), 36–43.
[13] Muhammad, M., Ahmeid, M., Attidekou, P. S., Milojevic, Z., Lambert, S., and Das, P., 2019. Assessment of spent EV batteries for second-life application. In Singapore, 2019 IEEE 4th International Future Energy Electronics Conference, IFEEC 2019.
[14] Omariba, Z. B., Zhang, L., and Sun, D., 2018. Remaining Useful Life Prediction of Electric Vehicle Lithium-Ion Battery Based on Particle Filter. In China, 2018 IEEE 3rd International Conference on Big Data Analysis, 412–416.
[15] Song, Y., Liu, D., Hou, Y., Yu, J., and Peng, Y., 2018. Satellite lithium-ion battery remaining useful life estimation with an iterative updated RVM fused with the KF algorithm. Chinese Journal of Aeronautics, 31(1), 31–40.
[16] Weddington, J., Niu, G., Chen, R., Yan, W., and Zhang, B. J. N., 2021. Lithium-ion Battery Diagnostics and Prognostics Enhanced with Dempster-Shafer Decision Fusion, 458.
[17] Xie, G., Li, X., Zhang, C. L., Hei, X. H., Qian, F. C., Hu, S. L., Cao, Y., and Cai, B. G., 2017. Data-Driven Approach for the Prediction of Remaining Useful We. 7th IEEE International Symposium on Microwave, Antenna, Propagation, and EMC Technologies (MAPE) (Xian, PEOPLES R CHINA), pp. 150–155.
[18] Xiong, R., Zhang, Y., He, H., Zhou, X., and Pecht, M. G., 2017. A double-scale, particle-filtering, energy state prediction algorithm for lithium-ion batteries. IEEE Transactions on Industrial Electronics, 65(2), 1526–1538.
[19] Zhang, D., Baraldi, P., Cadet, C., Yousfi-Steiner, N., Bérenguer, C., and Zio, E., 2019. An ensemble of models for integrating dependent sources of information for the prognosis of the remaining useful life of Proton Exchange Membrane Fuel Cells. Mechanical Systems and Signal Processing, 124, 479–501.
Biographies

Ye Chen works at Electric Power Research Institute of Yunnan Power Grid Co. Ltd, She received master’s degree in Power systems and automation from Kunming University of Science and Technology in 2017, engaged in electric energy, electrical measurement and thermal engineering professional work. Members of the High-precision Electrical Parameter Laboratory, Spark Power Research Studio, Intelligent Perception Innovation Studio and Key Laboratory of CSG for Electric Power Measurement.

Ziyi Chen, born in Liaoning Province, China, in 2003. Undergraduate at Shenyang Agricultural University, mechanical design and manufacturing and automation, like electronic design and circuit related knowledge.

Mengmeng Zhu works at Electric Power Research Institute of Yunnan Power Grid Co. Ltd, senior engineer, the research direction is electric energy metering device technology research and power transformer field verification, AC/DC electronic transformer field key test technology application and distribution network fault detection and protection control work.

Yaohua Liao (1992), male, master, engineer, Yunnan Power Grid Co., Ltd. Electric Power Research Institute, engaged in electric energy, electrical measurement, thermal engineering and high voltage measurement professional work, good at solving measurement-related field problems. Members of the High-precision Electrical Parameter Laboratory, Spark Power Research, and Intelligent Perception Innovation Studio participated in the drafting of the Q/CSG 1209013.2-2019 and Q/CSG 1209013.7-2019 corporate standards.

Fang Luo (1995), female, works in Yunnan Yundian Tongfang Technology Co., LTD. She received her bachelor’s degree in Computer Science and Technology from Yunnan Minzu University in 2017. She is engaged in Web and APP front-end development, artificial intelligence consulting design and project management.

Xinru Li was born in Shandong, China, in 1997. She is currently pursuing the Master of Academic degree with the Faculty of Information Engineering and Automation, Kunming University of Science and Technology, Kunming, China. She is presently working in the fields of Fault prediction and health management.
Distributed Generation & Alternative Energy Journal, Vol. 37_3, 449–464.
doi: 10.13052/dgaej2156-3306.3733
© 2021 River Publishers