Framework for Transmission Line Fault Detection in a Five Bus System Using Discrete Wavelet Transform
Krishna Kumari K1, V. Vanitha2 and Mohamed G. Hussien3,*
1Department of Electrical and Electronics Engineering, Amrita School of Engineering, Coimbatore, Amrita Vishwavidyapeetham, India
2Department of Electrical and Electronics Engineering, Shree Krishna College of Engineering and Technology, Coimbatore, India
3Department of Electrical Power and Machines Engineering, Faculty of Engineering, Tanta University, Tanta, Egypt
E-mail: krishna.mannadiyar@gmail.com; vvanitha@gmail.com; mohamed.hussien3@f-eng.tanta.edu.eg
*Corresponding Author
Received 23 June 2021; Accepted 07 August 2021; Publication 03 December 2021
Abstract
The transmission line is an essential part of the power system and since it is exposed to the harsh environmental conditions, it is susceptible to open circuit and short circuit faults. As the occurrence of failures affect the quality of the electric power supplied, identifying the fault and clearing it quickly is critical for the reliable power system operation. Fault Diagnostics of a multi bus system is crucial for Power system stable operation. In this paper, a five-bus system is taken up for the study and twelve different types of faults with varying fault durations are applied in transmission lines at different locations. Then Discrete Wavelet Transform (DWT) is applied to the receiving end current signals of the line and derived wavelet coefficients are used to identify the type of fault. Simulation and extraction of wavelet coefficients are done in MATLAB Simulink and results are presented. The Model Developed of a five Bus system for Fault Diagnostics and Simulation can be used as Framework for Fault Classification and Localization. The derived Wavelet Transform proves to be appropriate for the Framework developed.
Keywords: Line fault, Discrete Wavelet Transforms (DWT), Wavelet coefficient, five bus system, MATLAB.
1 Introduction
Making energy clean, affordable and reliable will be important for fighting poverty and climate change. Grid Automation will become an inevitable task in smart grid as many agencies are coming up with renewable energy integration. Faults occur frequently in transmission line, be it symmetrical or unsymmetrical due to many adverse factors such as environmental imbalances, over loads, lack of maintenance etc. [1]. Detection of fault in transmission lines is one of the important issues in power system so that the fault can be cleared in short time and the system is made reliable with minimum interruption. Nowadays, several decision algorithms for locating the fault on multi-terminals have been proposed [2–4]. As detection and classification of faults by signal processing methods generally show minimum error, this paper deals with the detection of fault in the transmission lines by wavelet transform [5–7]. Here, db8 wavelet is used to extract fault features of transmission line from line currents based on which the type of fault is identified [9, 10].
2 System Under Study
The Figure 1 shows the single Line Diagram of five bus system under study, where two sources and four loads are connected through a transmission line network having seven lines [8]. Specifications of the transmission lines, sources and loads are shown in Tables 1 and 2.

Figure 1 Five bus system under study.
The Bus number 2 is connected is connected to generator and Load together. Bus 1 written as Generator Bus acts as Slack Bus balancing the active and Reactive Power. A Typical IEEE 5 Bus used for Micro Grid is taken as base system for study.
Table 1 Transmission line specifications
| Bus | Length of Trans. Line km | Positive Seq. R (/km) | Zero Seq. R (/km) | Positive Seq. L (H/km) | Zero Seq. L (H/km) | Positive Seq. C (F/km) | Zero Seq. C (F/km) |
| 1–2 | 47 | 0.22 | 0.66 | 0.0017 | 0.0052 | 6.3 10 | 1.89 10 |
| 1–3 | 87 | 0.48 | 1.45 | 0.0038 | 0.0115 | 2.87 10 | 8.62 10 |
| 2–3 | 67 | 0.46 | 1.40 | 0.0037 | 0.0112 | 2.97 10 | 8.91 10 |
| 2–4 | 67 | 0.46 | 1.40 | 0.0037 | 0.0112 | 2.97 10 | 8.91 10 |
| 2–5 | 47 | 0.44 | 1.32 | 0.0035 | 0.0105 | 3.15 10 | 9.45 10 |
| 3–4 | 19 | 0.27 | 0.813 | 0.0021 | 0.0064 | 5.14 10 | 1.54 10 |
| 4–5 | 87 | 0.48 | 1.455 | 0.0038 | 0.0115 | 2.87 10 | 8.62 10 |
Table 2 Source and load specifications
| Bus | P (W) | Q (VAR) | Q-Max (VAR) | Q-Min (VAR) | P (W) | Q (VAR) |
| 1 | 0 | 0 | 500 10 | 500 10 | 0 | 0 |
| 2 | 40 10 | 0 | 300 10 | 300 10 | 20 10 | 10 10 |
| 3 | 0 | 0 | 0 | 0 | 45 10 | 15 10 |
| 4 | 0 | 0 | 0 | 0 | 40 10 | 5 10 |
| 5 | 0 | 0 | 0 | 0 | 60 10 | 10 10 |
Table 1 shows the Transmission Line specifications for a T-section Model. A suitable base value of 100 MVA i.e. S and base kV of 230 kV. i.e. V. The values for Positive and Zero Sequence Resistance, Inductance and Capacitance are calculated and applied to the Transmission Line model. The Length of the Transmission line is calculated using Resistance and Reactance of Transmission Line [8].
The Load Flow Bus Block in Matlab/Simulink is to be connected at the Bus where the voltage and angle value has to be measured. Table 2 shows the Load Flow required for Source and Load Bus. The Real and Reactive Power of all the Five Buses are loaded using the Generator and Load Block as can be seen in Table 2.
3 Simulation of Five Bus System
The Five Bus model of the power system with the given specifications has been developed in MATLAB/Simulink environment and load flow study is carried out under healthy conditions. Load Flow Studies Block of Matlab/Simulink is used for obtaining the Load Flow results after performing the simulation. Load flow results are shown in Table 3. It is seen that the system is working perfectly under steady state conditions.
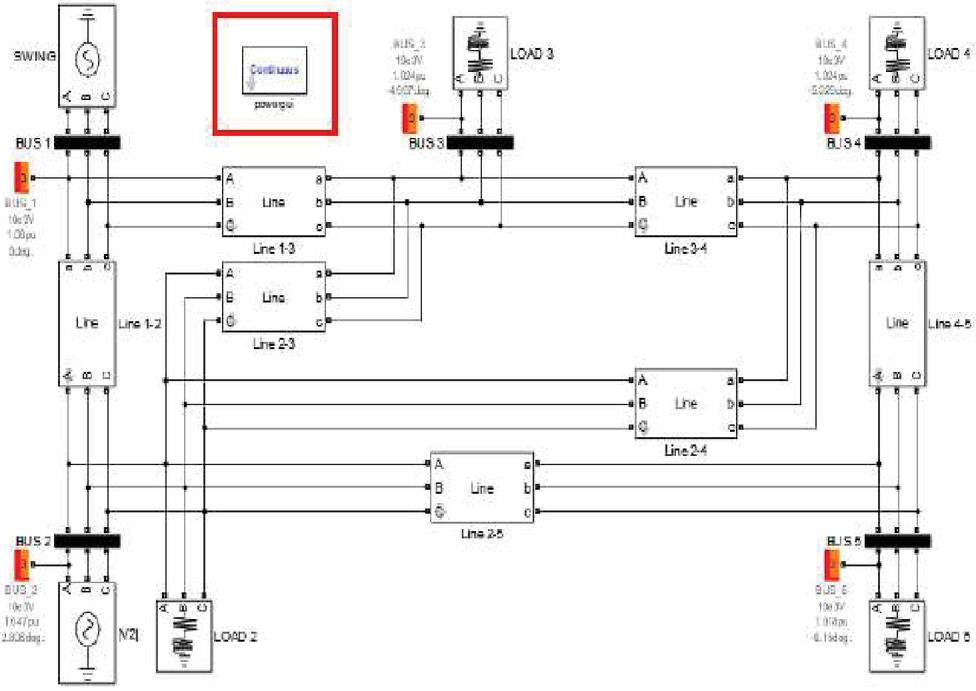
Figure 2 Simulated five buses system.
Table 3 Load flow results of five bus system
| Block | Bus | Bus | Vbase | Vref | Vangle | P | Q | Qmin | Qmax | V_LF | Vangle_LF | P_LF | Q_LF | ||
| Type | Type | ID | (kV) | (pu) | (deg) | (MW) | (Mv…) | (Mvar) | (Mvar) | (pu) | (deg) | (MW) | (Mvar) | ||
| 1 | Vsrc | swing | BUS_1 | 230.00 | 1.0600 | 0.00 | 0.00 | 0.00 | 500.00 | 500.00 | 1.0600 | 0.00 | 128.40 | 53.94 | SWING |
| 2 | RLC load | PQ | BUS_4 | 230.00 | 1 | 0.00 | 40.00 | 5.00 | –Inf | Inf | 1.0196 | 3.66 | 40.00 | 5.00 | LOAD 3 |
| 3 | RLC load | PQ | BUS_5 | 230.00 | 1 | 0.00 | 60.00 | 10.00 | –Inf | Inf | 1.0215 | 3.15 | 60.00 | 10.00 | LOAD 4 |
| 4 | RLC load | PQ | BUS_3 | 230.00 | 1 | 0.00 | 45.00 | 15.00 | –Inf | Inf | 1.0202 | 3.50 | 45.00 | 15.00 | LOAD 2 |
| 5 | RLC load | PQ | BUS_2 | 230.00 | 1.0600 | 0.00 | 20.00 | 10.00 | –Inf | Inf | 1.0378 | 1.19 | 20.00 | 10.00 | LOAD 2 |
| 6 | Vsrc | PV | BUS_2 | 230.00 | 1.0600 | 0.00 | 40.00 | 30.00 | 30.00 | –30.00 | 1.0378 | 1.19 | 40.00 | 30.00 | |V2| |
As, shown in Figure 2. A pie section model of IEEE 5 bus system is taken for simulation. The continuous block is used for Simulation in Discrete time. A 100 kVA system with Five Buses is considered for simulation. The specification for the system is as shown in Tables 2 and 3. The system is designed and simulated in MATLAB. A Three phase Fault is applied to the above system using 3-phase Fault Generator Block and the signals are acquired at the receiving end for all the twelve Fault conditions. The Simulation time considered is 0.1 s.
4 Fault Detection in Five Bus System Using db8 Wavelet
Initially the five-bus system is simulated under healthy and faulty conditions. Currents of all transmission lines in all three phases both at sending end and receiving end are obtained. In each line, the sending end current and receiving end currents are compared. If there is no fault in the line, both are equal. In this paper, Daubechies 8 wavelet at 6th level and higher levels of decomposition is used to extract the features of fault. Summation of detailed coefficients at this level is done for all the phases and these values under healthy conditions are kept as reference i.e. as X, Y, Z.
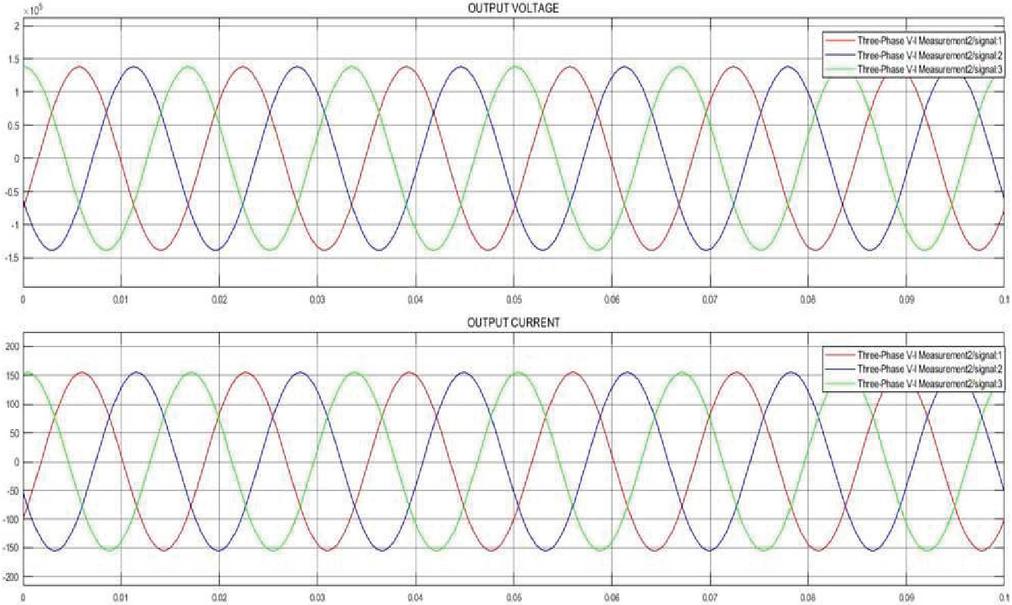
Figure 3 Receiving end voltage and current in Line connected between buses 2 and 5 under healthy condition.
Figure 3 shows the voltage and current at the receiving end of the line connected between buses 2 and 5 under healthy conditions. Figure 4 shows voltage and current in line connected between buses 2 and 5 under faulty condition.
The receiving end Fault Voltage for Two phase fault i.e. Voltage and current signal is as shown in Figure 4. The different types of Faults are induced and the Fault current at receiving end is analyzed.
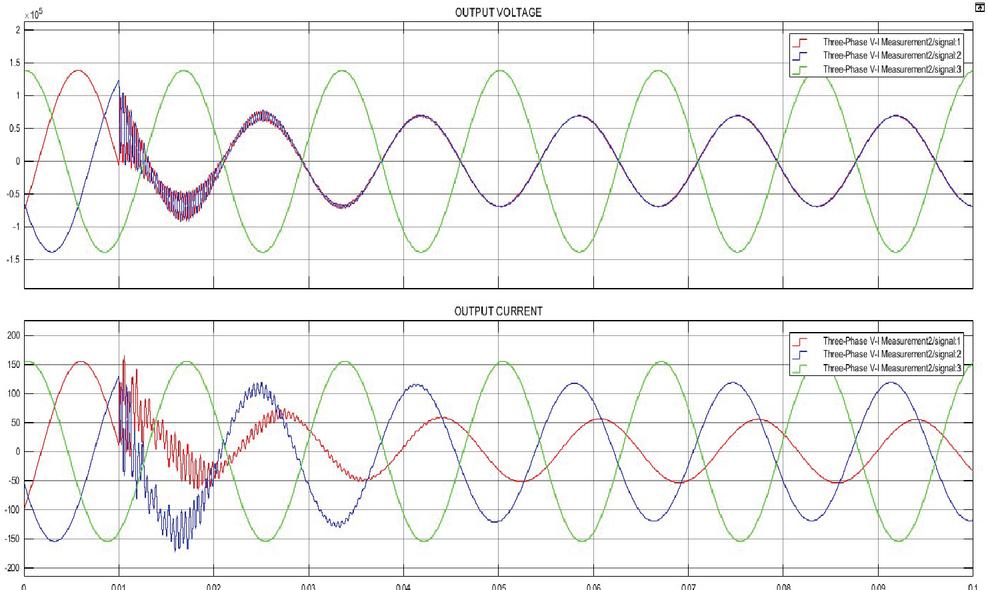
Figure 4 Receiving end voltage and current in Line connected between buses 2 and 5 under faulty condition.
The Matlab Simulation for Healthy and Faulty conditions is verified for Individual Phases and the changes in Signal patterns for Faulty conditions can be seen visibly. For a two-phase Fault the Phase having the Fault is seen short circuited in the Voltage waveforms.
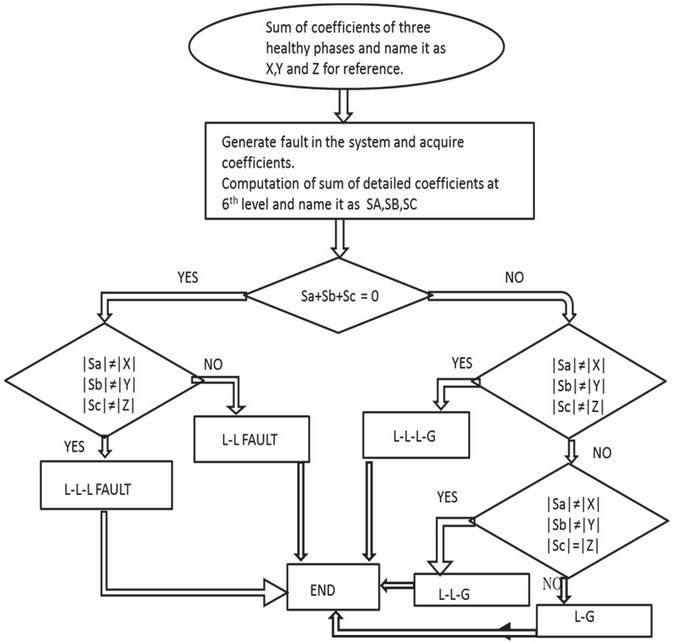
Figure 5 Flow chart for detection of Transmission Line Fault Classification (FCA) Algorithm.
As Shown in Figure 5, the Flowchart for detection of Transmission Line Fault Classification (FCA) Algorithm. The initial step in Fault Analysis is to calculate the Fault co-efficient and compare it with Healthy system Fault co-efficient. The Sampling Frequency is of great importance for capturing the featuring the signals of Faulty signals. The Sampling Frequency taken is 12.5 kHz. The Fault study is carried out by varying the Fault Location and Load conditions. The error percentage is calculated for each of the conditions. A tolerance limit of 10% is considered acceptable for Fault studies based on the observations.
Different types of faults such as L-G, L-L-G, L-L-L, and L-L are simulated for all the phases in different locations from which current signals at receiving end are fetched and are imported from workspace to wavelet tool box where DWT is performed by choosing the type of mother wavelet and order of decomposition. Detailed coefficients at 6th level and higher levels are exported to workspace where the fault detection algorithm is applied. Figure 4 shows the flow chart of fault detection algorithm which is used to find the type of fault. For this algorithm, the key operation is summation of the detailed coefficients in each phase. Summation of detailed coefficients is carried out for each phase and stored as SA, SB, SC under faulty conditions and are compared with that of healthy values (X, Y, Z).
Mother wavelet is chosen on the basis of its scaling function and sampling frequency. Level of decomposition can be 4 or above 4 as 4th level has the feature of extracting out transients of 2nd and 3rd harmonics which play crucial role in identification. Higher levels improve precision and accuracy of summation coefficients. Db8- level 6 gives good results in detecting and classifying the fault. Various types of analysis were performed by changing the load, fault duration and fault location and DWT is applied to all the cases. Figure 2 shows the simulation diagram of five bus system. Figure 6 shows the plot of detailed coefficients for AB fault in line between buses 2 and 5.
Table 4 shows the summation coefficients under healthy and different faulty conditions for the given system specifications. Tables 5, 6 and 7 show the values of summation of detailed coefficients for different operating conditions of five bus system. All the detailed coefficients are stored in workspace in an array form of order which is equal to maximum level of decomposition.
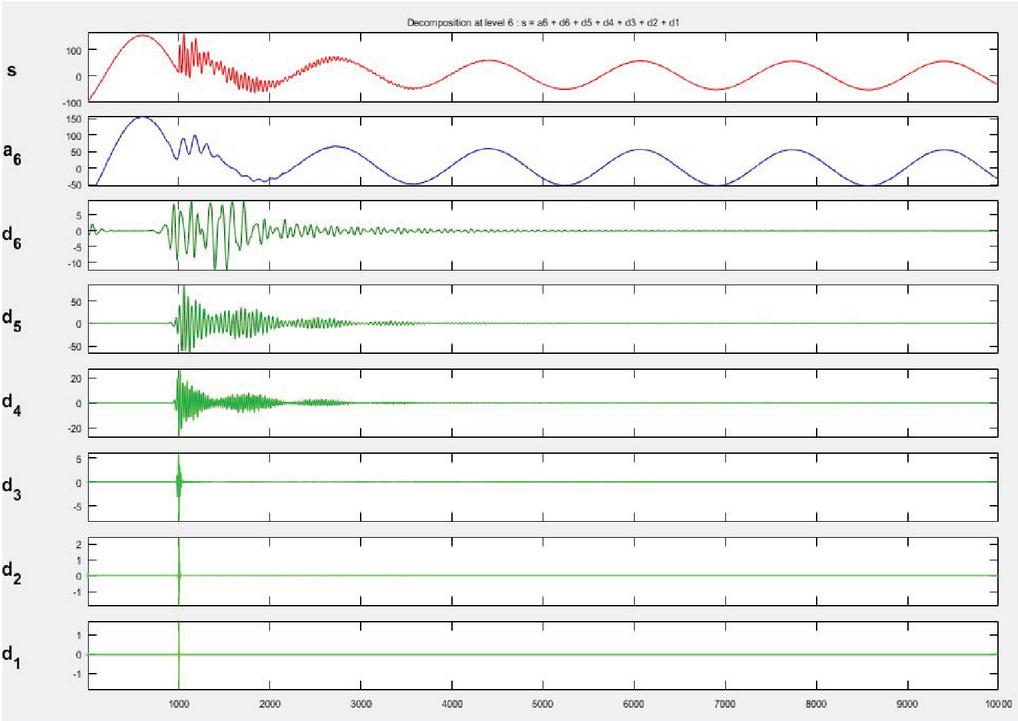
Figure 6 Detailed wavelet coefficients for phase A under AB fault between bus 2 and 5.
Table 4 Summation coefficients under healthy and faulty conditions for different faults in line between bus 2 and 5 for the given system specifications
| LOAD | ||||||||||||
| 60 MW | Healthy | AG | BG | CG | ABG | BCG | ACG | AB | BC | AC | ABC | ABCG |
| SA | 9.61 | 0.5 | 10.5 | 9.05 | 0.1 | 9.94 | 1.26 | 4 | 9.61 | 10.1 | 0.83 | 0.83 |
| SB | 15 | 16 | 2.66 | 16 | 2.52 | 3.54 | 16 | 1.6 | 1.1 | 15 | 3.25 | 3.25 |
| SC | 5.63 | 5.28 | 6.54 | 3.2 | 5.87 | 3.8 | 3.6 | 5.63 | 8.5 | 5.16 | 4.1 | 4.1 |
| sum | 0 | 9.8 | 19.7 | 9.9 | 8.5 | 9.7 | 18 | 0 | 0 | 0 | 0 | 0 |
Table 5 Summation coefficients under healthy and faulty conditions for different faults in line between bus 2 and 5 if the load at bus 5 is reduced from 60 MW to 40 MW
| LOAD | ||||||||||||
| 40 MW | Healthy | AG | BG | CG | ABG | BCG | ACG | AB | BC | AC | ABC | ABCG |
| SA | 7.66 | 0.27 | 7.88 | 7.55 | 0.1 | 8.35 | 1.29 | 4.1 | 7.65 | 8.30 | 0.24 | 0.24 |
| SB | 12 | 11.9 | .84 | 11.9 | 2.7 | 4.25 | 12.8 | 0.1 | 0.57 | 11.8 | 4.27 | 4.27 |
| SC | 4.2 | 4.10 | 4.39 | 3.56 | 4.19 | 4.53 | 3.46 | 4.2 | 8.5 | 3.54 | 4.51 | 4.51 |
| sum | 0 | 8.1 | 16.1 | 8 | 6.84 | 8.07 | 15 | 0 | 0 | 0 | 0 | 0 |
The Wavelet Toolbox Window is as shown in Figure 6. The Signals of Phase A, Phase B and Phase C are sampled phase wise by importing individual signals to the Wavelet toolbox. The signals are imported as 1 D signals from the MATLAB workspace. Various Discrete Wavelet Transform could be performed by selecting the suitable mother wavelet, the various levels of wavelet transform could be performed up to level 12. Db6 wavelet selection proves to be successful as the co-efficient values are precise and captures the fault signals effectively compared to other wavelets.
Figure 6 shows MATLAB/Simulink Graphical User Interface for Wavelet Toolbox. The figure shows import of a single phase 1 D signal and its decomposition upto Level 6 using Mother wavelet Db6.
The Fault injection could be clearly seen for the various decomposition levels on the X-axis of the Signal.
Table 4 shows the summation coefficients under healthy and different faulty conditions for the given system specifications. Tables 5, 6 and 7 show the values of summation of detailed coefficients for different operating conditions of five bus system. All the detailed coefficients are stored in workspace in an array form of order which is equal to maximum level of decomposition.
Table 6 Summation coefficients under healthy and faulty conditions for different faults in line between bus 2 and 5 if the fault duration is reduced from 0.08 s to 0.03 s
| FAULT | ||||||||||||
| TIME | ||||||||||||
| 0.02–0.05 | Healthy | AG | BG | CG | ABG | BCG | ACG | AB | BC | AC | ABC | ABCG |
| SA | 9.61 | 0.5 | 10.5 | 9.05 | 0.1 | 9.94 | 1.26 | 4 | 9.61 | 10.1 | 0.83 | 0.83 |
| SB | 15 | 16 | 2.66 | 16 | 2.52 | 3.54 | 16 | 1.6 | 1.1 | 15 | 3.25 | 3.25 |
| SC | 5.63 | 5.28 | 6.54 | 3.2 | 5.87 | 3.8 | 3.6 | 5.63 | 8.5 | 5.16 | 4.1 | 4.1 |
| sum | 0 | 9.8 | 19.7 | 9.9 | 8.5 | 9.7 | 18 | 0 | 0 | 0 | 0 | 0 |
Table 7 Summation coefficients under healthy and faulty conditions for different faults in line between bus 1 and 2 for the given system specifications
| BUS1_2 | ||||||||||||
| FAULT | Healthy | AG | BG | CG | ABG | BCG | ACG | AB | BC | AC | ABC | ABCG |
| SA | 7.8 | 0.6 | 10.5 | 9.05 | 1.81 | 9.94 | 1.26 | 10 | 9.61 | 10.1 | 0.83 | 0.83 |
| SB | 11.7 | 12.2 | 2.66 | 16 | 26.5 | 3.54 | 16 | 14.2 | 1.1 | 15 | 3.25 | 3.25 |
| SC | 3.8 | 3.3 | 6.54 | 3.2 | 3.3 | 3.8 | 3.6 | 3.8 | 8.5 | 5.16 | 4.1 | 4.1 |
| sum | 0 | 9.8 | 19.7 | 9.9 | 8.5 | 9.7 | 18 | 0 | 0 | 0 | 0 | 0 |
In case of ground faults, the resultant sum of summation coefficients is not equal to zero and the phase in which fault occurs, their summation coefficients differ highly from healthy condition. In LL fault, where the ground is not involved, summation coefficients of two phases where the fault occurs differ from that of healthy phases and resultant sum is zero.
5 Interpretation From the Simulation Results
The Three phase Fault detection analysis is being performed using Matlab/Simulink Tool. The Wavelet Transform Db8 Level 6 is selected for Fault Detection as it captures the fault signals features effectively. If the fault involves ground, the summation of detailed coefficients in three phases is not equal to zero. Otherwise, it is equal to zero. Summation of detailed coefficients in three different phases under faulty conditions is found to be different from that of healthy conditions. As the fault duration is reduced, the wavelet coefficients do not deviate much, but sufficient enough to distinguish healthy condition from faulty condition. Db8 at level 6 gives good results in identifying the fault irrespective of fault location, fault duration and varying load conditions.
6 Conclusion
The paper deals with DWT based approach for fault detection and classification of transmission lines for a five-bus system. The Discrete Wavelet Transform (DWT) based method for locating faults is used. The transient change in the current of the power system can be gauged using Daubechies 8 wavelet transform and the extracted detailed coefficients are used for identifying the fault in different phases under varying load conditions and fault locations. The results have illustrated that the db8 mother wavelet gives a mean error of 0.34%. As the accuracy of the proposed method for different types of faults is satisfactory, the method can be extended to large bus system. Thus, a Fault detection and classification algorithm could be designed based on Discrete wavelet transform which proves to be successful for varying fault location, varying fault duration and varying Load conditions.
References
[1] Badri Ram and D.N. Vishwakarma, “Power System Protection and Switchgear”, Tata McGraw Hill Publication Company Limited, New Delhi, 2005.
[2] D. Chanda, N.K. Kishore and A.K. Sinha, “Application of wavelet multiresolution analysis for identification and classification of faults on transmission lines”, Electric Power Systems Research, Vol. 73, pp. 323–333, 2005.
[3] Mazen Abdel-Salam, Adel Ahmed and WaelAhmed, “Wavelet Based Analysis for Transmission Line Fault Location”, Innovative Systems Design and Engineering, Vol. 4, No. 14, 2013.
[4] P. Chiradeja and C. Pothisarn, “Identification of the Fault Location for Three-Terminal Transmission Lines using Discrete Wavelet Transforms”, IEEE T&D Asia 2009.
[5] H. Fernando, Magnago and Ali Abur, “Fault Location Using Wavelets”, IEEE Transactions on Power Delivery, pp. 1475–1480, October 1998.
[6] I. Daubechies, “The wavelet transform, time-frequency localization and signal analysis”, IEEE Transactions of Information Theory, pp. 961–1005, September 1990.
[7] C.H. Kim and R. Aggarwal, “Wavelet transforms in power systems: Part 1. General introduction to the wavelet transforms”, IEEE Power Engineering Journal, pp. 81–87, April 2000.
[8] Anjali Atul Bhandakkar and Dr. Lini Mathew, “Real-Time-Simulation of IEEE-5-Bus Network on OPALRT-OP4510 Simulator”, 3rd International Conference on Communication Systems (ICCS), 2017.
[9] Maliye Sri Pranav, Kanipakam Vishal, Chigurupati Karthik, Jakkamsetti Tarun and Dr. D. Kavitha, Dr. V. Vanitha, “Fault Detection and Classification in Three Phase Transmission lines using Signal Processing”, IEEE Third International conference on Recent Trends in Electronics and Communication Technology, 2018.
[10] Dr. K. P. Soman and Dr. K. I. Ramachandran, “Insight into Wavelets from Theory to Practice book”, PHI Learning Private Limited, New Delhi, 2013.
Biographies
Krishna Kumari K is presently pursuing her Ph.D in the field of Electric Vehicle Integration with Smart Grid under Visveswaraya Fellowship from Department of Electronics and Telecommunication. She has completed in M. Tech in Control and Automation from Maharaja Sayajirao University of Baroda with Gold Medal.
V. Vanitha is currently with the Department of Electrical and Electronics Engineering, Shree Krishna College of Engineering and Technology, Coimbatore, India. His research interests are in Electrical Engineering.
Mohamed G. Hussien is currently an assistant professor at the Department of Electrical Power and Machines Engineering, Faculty of Engineering, Tanta University, Tanta, Egypt. He has published scientific papers in both international conferences and high-quality SCI journals. He is currently serving as an Editorial Board Member for the International Research Journal of Innovations in Engineering and Technology – IRJIET. He has been serving as a reviewer for both IEEE conferences and many IEEE journals (including the IEEE access and the IEEE Trans. on Industrial Electronics and the IEEE Trans. on Power Electronics). He is a member of the IEEE-IES Electric Machines Technical Committee. His paper has been selected as one of the best papers published in the period (2019–2020) in the IEEE Transactions on Energy Conversion in the “Power generations systems and grid interfaces” area. His research interests are in Electrical Machines Analysis, Electrical Drives, Electric Vehicles, Sensorless Control, Doubly-Fed Machines, Power Electronics, and Renewable Energy Systems.
Distributed Generation & Alternative Energy Journal, Vol. 37_3, 525–536.
doi: 10.13052/dgaej2156-3306.3737
© 2021 River Publishers