A Study on Reliability of Smart Meters based on Monte-Carlo Method and Fault Trees
Ye Chen1, 2, Ziyi Chen3, Yaohua Liao1, 2, Mengmeng Zhu1, 2, Zhihu Hong1, 2 and Zhangnan Jiang4,*
1Electric Power Research Institute of Yunnan Power Grid Co. Ltd, Kunming 650217, China
2Key Laboratory of CSG for Electric Power Measurement, Kunming 650217, China
3Shenyang Agricultural University, Shenyang 110866, China
4Faculty of Information Engineering and Automation, Kunming University of Science and Technology, Kunming 650500, China
E-mail: 237039717@qq.com
*Corresponding Author
Received 25 June 2021; Accepted 15 July 2021; Publication 15 October 2021
Abstract
Smart meters are widely used in the power supply system, and their operational reliability is closely related to the user’s power supply reliability. It is difficult for intelligent power metering equipment to accurately predict its operational reliability and lifespan based on the existing technical specifications. In order to improve the accuracy of predicting the reliability and the maintenance cycle of the smart meter, this paper proposes a method for predicting the reliability of the smart meter based on the Monte Carlo method and fault tree. Firstly, the occurrence time of the bottom sampling event is simulated by the Monte-Carlo method based on the statistical data of the annual failure rate of each module of the smart meter. Then, according to the Fault Tree analysis of smart meters, the occurrence of the event is transformed into the fault time of the whole smart meters. The interval statistics are used to obtain the reliability value of the smart meter. In the end, the curve of the reliability function is obtained after fitting the reliability value. The results show that the reliability of the smart meter obeys the exponential distribution during the operation of 100 years. When it comes to the tenth year, the reliability is 0.9519. This algorithm provides a guide for accurately predicting its reliability and maintenance cycles by modularly analyzing the faults of smart meters.
Keywords: Smart meters, reliability prediction, monte-carlo sampling, fault tree analysis.
1 Introduction
In the power system, the intelligent power measurement device is widely used in remote metering to monitor power and electricity charging. Due to the rapid expansion of the small grid, the hundreds of millions of century-old analog electro-mechanical energy meters are replaced by smart meters. The safety and continuity of the power supply for thousands of households are dependent on the operational reliability of small meters. For the power supplier, reliability estimation is a significant technique to examine the quality of smart meters manufactured for power suppliers (Sharma and Saini, 2015; Xu et al., 2020). The power grid has a large number of smart meters, and it is impossible to test the reliability of all the smart meters in the power grid (Zhang et al., 2013; Depuru et al., 2011). In order to control smart meter operational reliability, Grid company has issued a series of specifications for smart meters, which covering technical indicators, mechanical performance, environmental adaptability, functional requirements, electrical performance, and reliability (Xue et al., 2016). However, these standards only require the service life index of electric energy metering equipment in smart electricity meters. However, they fail to provide effective solutions for its reliability assessment and prediction. Zhou et al. (2013) used the SR-332 Reliability Prediction Manual to make predictions. However, the standard is more for military use, and the simple superimposed failure rate does not really reflect the impact of component failure on the overall system failure. Ning et al. (2016) established a reliability prediction model based on field data and Weibull distribution. However, the number of statistical data is small, and there are only 30 single-model smart meter failure data, which significantly affects the accuracy of the model.
A smart meter is composed of various modules, including power module, metering module, control module, display module, storage module, and communication module to achieve various functions (Yuting et al., 2019; Avancini et al., 2019). This paper presents a simulation algorithm for predicting the reliability of smart meters using the Monte-Carlo method and fault tree. This algorithm can predict the reliability and maintenance cycle of smart meters based on the statistics of the failure rate of the meter module.
Methods
The method proposed in this work is to analyze the faults of the smart meter modularly. First, according to the hardware function of the smart meter, the meter is divided into different modules, and the fault time of each module is sampled by the Monte Carlo method. Then, the Fault Tree is used to sample and integrate each module. Finally, the interval statistics method counts the number of samples, and the statistical results are curve-fitted to obtain the system reliability function (Zhou et al., 2019). The procedure is shown in Figure 1. Start from dividing the modules of the smart meter to finally solving the reliability function of the smart meter, and it is roughly divided into four steps.

Figure 1 The brief schematic diagram of the algorithm flow.
1.1 Monte-Carlo Sampling and Fault Tree
Monte Carlo methods are a broad class of computational algorithms that use repeated random sampling to approximate some multivariate probability distribution (Vrugt, 2016; Kapli et al., 2017; Moral et al., 2012). The Monte-Carlo method is often used to sample equipment faults in complex power systems. Because smart meters have more component modules and more complex structures than traditional mechanical energy meters, when evaluating the reliability of their modules, it is also very suitable for adopting the Monte-Carlo simulation method to sample the module failure time multiple times (Guyonnet et al., 2003). It is worth noting that the failure of each basic module causes the failure of smart meters. Their types and probability of occurrence are different. The sampling here is only for the failure time of the basic module (t), and it is not the system failure time of the smart meter (t). Later in the article, the Fault Tree will be used as the model to realize the conversion from the failure time of the basic module to the failure time of the smart meter.
The Fault Tree Analysis is a typical method and an accidental evolutionary logic analysis tool used to estimate the safety and reliability of a complex system (Zhang et al., 2018; Jiang et al., 2019). This deductive and structured methodology is used to determine the potential causes of an undesired event, referred to as the top event (Khakzad et al., 2011). The top event is the most undesirable failure mode, and it is located at the top of the tree (Yazdi et al., 2020). The tree is constructed downward, and the system is analyzed in more detail until the underlying event is known. The research of the fault tree is usually based on the structure-function and the minimum cut set. The structural function can express the logical relationship between the events, and the minimum cut set reflects the set of bottom events necessary for the occurrence of the top event:
| (1) |
where is the number of minimum cut sets; and is the base event vector corresponding to the cut set. Since the bottom events under the minimum cut set are connected with an AND gate, the minimum cut set will only occur when all the bottom events in the minimum cut set occur; the OR gates are used between the minimum cut sets. Connection, any occurrence of a minimum cut set, will lead to the occurrence of top events. The specific reflection is that the last occurrence of the bottom event can determine the occurrence time of the minimum cut set, and the occurrence time of the minimum cut set can determine the time of the top event.
1.2 Reliability Index
Product reliability can be described as the probability that a product performs a specified task under specific conditions and within a specified time. If it is stipulated that the working time of the product is and the working time until the product fails is , when the reliability of the product is lower than , the product is deemed to be invalid.
Reliability Analysis Model
According to the working principle and basic modules of smart meters, the common fault types of energy meters are modules as event carriers, and the failure of smart energy meters is set as the top event T, the intermediate event is S, and the bottom event is , Fault Tree model is shown in Figure 2.
Figure 2 Fault tree diagram.
: smart energy meter failure; : MCU module failure; : metering
module failure; : power supply module failure; : display failure;
: clock failure; : fee control failure; : storage failure;
: period and Rate failure; : alarm control failure; : reset
failure; : communication failure.
The fault data of smart meters collected by the state grid in 2018 has a total of 643,000 fault phenomena. According to the statistical data, the annual fault rate corresponding to each bottom event can be obtained, as shown in Table 1.
Table 1 The annual fault rate of different failure types
| Fault Type | Annual Failure Rate |
| Battery Undervoltage | 0.00496 |
| Clock anomaly | 0.00115 |
| Other measurement abnormalities | 0.00031 |
| Abnormal power consumption statistics | 0.00030 |
| 485 communication failure | 0.00024 |
| Basic error | 0.00012 |
| Clock timing error | 0.00006 |
| Period switching | 0.00004 |
| Crash | 0.00004 |
| Screen failure | 0.00004 |
According to IEC 61709 “Electronic Components Reliability” or SN 29500 “Failure Rates of Components,” the reliability of electronic products should conform to the exponential distribution law and the distribution function of the bottom event is:
| (2) |
where the sampling of the occurrence time of the bottom event is , which is obtained by the inverse function of . Given a random number distributed in , then .
The fault tree structure is functionalized into a form consisting of the minimum cut set . When the latest bottom event in occurs, will occur, so the fault time of the minimum cut set is equal to the latest bottom of the cut set time when the event occurred, that is:
| (3) |
In the formula, the minimum cut set has g bottom events, contains components, and is the time of the th bottom event in . In this way, the conversion from the sampling event time of the bottom event to the minimum cut set sampling time is realized. Because as long as any minimum cut set occurs, the top event system failure must occur, so the whole system failure time is determined by the earliest minimum cut set. Assuming that the system has minimum cut sets , and the minimum cut set occurs at , then:
| (4) |
In this way, the conversion from the minimum cut sampling time to the system failure sampling time is realized. According to Figure 2, the fault tree model of the smart meter is composed of OR gates (that is, if any module fails, the system will fail as a whole). After the structural function is reduced to the form consisting of the minimum cut sets , the minimum Cut set are the base events , respectively. Therefore, the system failure time is
| (5) |
Repeat the calculation of above times to obtain sub-samples , and set the median value of samples to . The statistical range is , that is, only the samples in the interval are counted. If the sample exceeds this range, the sample is a larger deviation sample, and this sample is not counted. The interval with a total length of is divided into equal parts, the interval length is , and the length of each statistical interval is , as shown in Figure 3.
Figure 3 Schematic diagram of interval statistics.
Count the number of times the samples fall into each interval segment, and represents the total number of times the sample falls into the interval segment. Finally, the reliability of the system corresponding to each fault time interval is calculated by:
| (6) |
Moreover, the reliability function is obtained by the fitting. According to this model, the simulation algorithm flow of the reliability of smart meters is shown in Figure 4.
Figure 4 Algorithm flow of reliability prediction for smart electric energy meter.
Figure 5 Reliability simulation result curve.
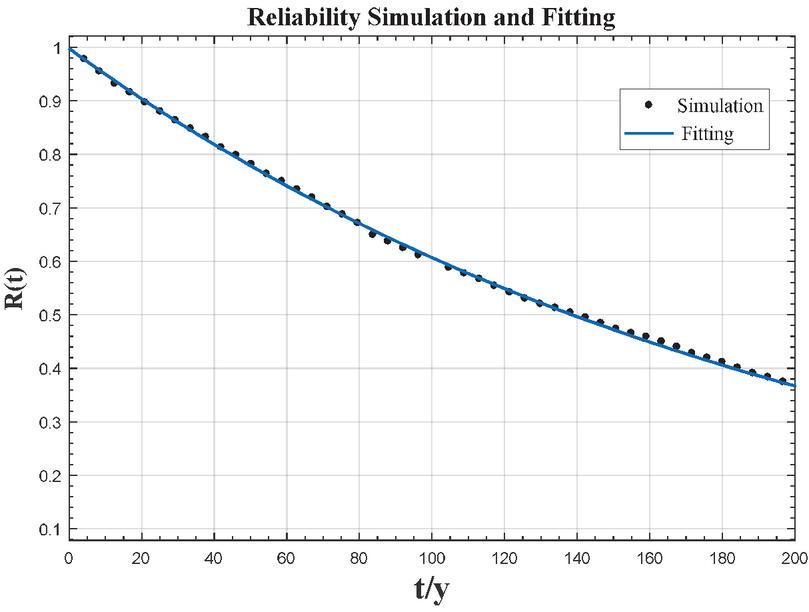
Figure 6 Reliability simulation results and reliability function fitting.
Results
When the number of simulations N is 1000, the simulation results tend to be stable. The simulation results are shown in Figure 5. The x-axis is the working time; the unit is the year. The y-axis is the reliability, indicating the probability without faulty.
Exponential fitting is used for the simulation result curve, as shown in Figure 6. The curve fits well, and the degree-of-freedom adjusted coefficient of determination is 0.9998, the sum of squares due to error is 0.001419, and the Root mean squared error is 0.003825.
After fitting the simulation results, the reliability function of the smart energy meter is obtained as:
| (7) |
The technical specifications of the energy meter of China State Grid Corporation stipulate that the meantime to failure (MTTF) of the energy meter is ten years (Liu et al., 2019). Substitute the working life of the smart electric energy meter into the reliability function of the smart electric energy meter, and estimate the reliability of the working time within ten years, as shown in Table 2. It can be seen from Table 2 that when the smart electric energy meter works for ten years, its reliability is 0.9519.
Table 2 Reliability meter of smart energy meter within 10 years of operation
| Operating Life (years) | Reliability | Operating Life (Years) | Reliability |
| 1 | 0.9960 | 6 | 0.9712 |
| 2 | 0.9910 | 7 | 0.9664 |
| 3 | 0.9860 | 8 | 0.9615 |
| 4 | 0.9811 | 9 | 0.9567 |
| 5 | 0.9761 | 10 | 0.9519 |
Discussion
It can be seen from the simulation results that the operational reliability of the smart meter can be fitted as a function of the exponential distribution, and the reliability of the smart meters with different working years can be obtained by using this function R(t). The reliability of the smart meter that has been in operation for ten years is 0.9519, indicating that when the working life reaches ten years, 4.8% of the smart meters may fail. From the statistical data of the smart meter failure module, the cause of the smart meter failure is mainly concentrated in the power supply module, which an annual failure rate is 0.00496. Improving the reliability of power supplies and batteries can effectively improve the reliability of smart meters.
Compared with Ning et al. (2016), the reliability prediction model proposed in this paper, the sampling of module failure time comes from the statistics of the failure rate from a large number of data. The accuracy of the modeling is significantly increased due to a wide range of sampling achieved by the Monte-Carlo method. Compared with using the SR-332 reliability prediction manual to superimpose the failure rate, in this study, the Fault Tree Analysis method is used to make the impact of each component in the model on the overall system approach the actual situation. The more complicated the system structure, the more apparent advantages of the Fault Tree Analysis method. The model of Fault Tree analysis can improve accuracy by completing the bottom event. Therefore, the Fault Tree structure in this study can be further improved by adding the analysis of the failure rate of the corresponding fault module into the model in the future study.
Conclusions
There is a lack of effective reliability prediction method in the smart meter device in the power grid. This paper proposes a method for a reliability prediction based on the Monte-Carlo method and Fault Tree. In this way, the reliability value of the smart meter under different operating years is simulated, and then the simulation data is fitted to obtain the reliability function of the smart meter that meets the exponential distribution . Taking the State Grid Corporation’s energy meter technical specifications stipulating MTTF 10 years as an example, the reliability of a smart meter with an operating period of 10 years is calculated to be 0.9519, and the evaluation results can be used as indicators for reliability monitoring. The proposed algorithm can also provide a reference for Power supplier modular analysis of smart meter failures and scientific guidance for maintenance work.
Acknowledgments
This work is supported by the National Natural Science Foundation of China (51667011 and 61962031) and the Applied Basic Research Project of Yunnan (2018FB095).
References
[1] Avancini, D. B.; Rodrigues, J. J. P. C.; Martins, S. G. B.; Rabelo, R. A. L.; Al-Muhtadi, J. and Solic, P., 2019. Energy meters evolution in smart grids: A review. Journal of Cleaner Production, 217(APR.20), 702–715.
[2] Deputy, S. S. S. R.; Wang, L. and Devabhaktuni, V., 2011. Smart meters for power grid: Challenges, issues, advantages, and status. Renewable & Sustainable Energy Reviews, 15(6), 2736–2742.
[3] Guyonnet, D. G. D.; Bourgine, B.; Dubois, D.; Fargier, H.; Come, B.; Chiles, J. P., 2003. A hybrid approach for addressing uncertainty in risk assessments. Journal of Environmental Engineering-ASCE, 129(1), 68–78.
[4] Jiang, J.; Zhang, Y. and Chen, J., 2019. Application of Fault Tree Analysis on Smart Meter Fault Diagnosis. Journal of Physics: Conference Series, Vol. 1345(3), 042004.
[5] Kapli, P.; Lutteropp, S.; Zhang, J.; Kobert, K.; Pavlidis, P.; Stamatakis, A. and Flouri, T., 2017. Multi-rate Poisson tree processes for single-locus species delimitation under maximum likelihood and Markov chain Monte Carlo. Bioinformatics, 33(11), 1630–1638.
[6] Khakzad, N.; Khan, F. and Amyotte, P., 2011. Safety analysis in process facilities: Comparison of fault tree and Bayesian network approaches. Reliability Engineering & System Safety, 96(8), 925–932.
[7] Liu, Y.; Rong, X. and Bu, S., 2019. Life expectancy of smart meter based on Weibull distribution. Electrical Measurement & Instrumentation, 56(03), 148–152.
[8] Moral, P. D.; Doucet, A. and Jasra, A., 2012. An adaptive sequential Monte Carlo method for approximate Bayesian computation. Statistics & Computing, 22(5), 1009–1020.
[9] Li, N.; Dong, X.; Chen, G.; Yuan, T. and Duan, Z., 2016. A smart meters optimization model for reliability prediction. In International Conference on Integrated Circuits & Microsystems, 159–165.
[10] Sharma, K. and Saini, L. M., 2015. Performance analysis of smart metering for smart grid: An overview. Renewable & Sustainable Energy Reviews, 49(49), 720–735.
[11] Vrugt, J. V. and Jasper A., 2016. Markov chain Monte Carlo simulation using the DREAM software package: Theory, concepts, and MATLAB implementation. Environmental Modelling & Software, 75, 273–316.
[12] Xu, D.; Xiao, X., and Yu, H., 2020. Reliability Evaluation of Smart Meters Under Degradation-Shock Loads Based on Phase-Type Distributions. IEEE Access, 8, 39734–39746.
[13] Xue, Y.; Zhang, P .; Wang, Y.; He, S.; Peng, Z., and Wu, H., 2016. Study and exploration on reliability assessment method for smart meters. Electrical Measurement & Instrumentation, 53(13), 94–98.
[14] Yazdi, M.; Korhan, O., and Daneshvar, S., 2020. Application of fuzzy fault tree analysis based on modified fuzzy AHP and fuzzy TOPSIS for fire and explosion in the process industry. International Journal of Occupational Safety and Ergonomics, 26(2), 319–335.
[15] Wang, Y.; Liu, N.; Yang, J.; Dai, Y.; Wang, M.; Jia, Y.; Gu, G.; Dai, X.; Pang, B., and Gu, L., 2019. Analysis on the Reasons for Smart Meter Failure and Solutions. In: Xian, PEOPLES R CHINA proceedings of 2019 4th International Workshop on Materials Engineering and Computer Sciences (IWMECS 2019), 475–479.
[16] Zhang, M.; Zhang, D.; Goerlandt, F.; Yan, X., and Kujala, P., 2019. Use of HFACS and fault tree model for collision risk factors analysis of icebreaker assistance in ice-covered waters. Safety Science, 11, 128–143.
[17] Zhang, P.; Xiao, C.; Xue, Y., and Zhang, X., 2013. Modeling and Simulation of Smart Meters Based on Matlab/Simulink Software. In: Xian, PEOPLES R CHINA, International Conference on Mechatronics and Semiconductor Materials (ICMSCM 2013), Advanced Materials Research, Vol. 846–847, 760–763.
[18] Zhou, J.; Aghili, N.; Ghaleini, E. N.; Bui, D. T.; Tahir, M. M. and Koopialipoor, M., 2019. A Monte Carlo simulation approach for effective assessment of flyrock based on intelligent system of neural network. Engineering with Computers, 36(2), 713–723.
[19] Zhou, L.; Cao, R.; Qi, C., and Shi, R., 2012. Reliability prediction for smart meter based on Bellcore standards. In: Chengdu, PEOPLES R CHINA, Huang, HZ; Zuo, MJ and Liu, Y., In international conference on quality, reliability, risk, maintenance, and safety engineering. 2012 International Conference on Quality, Reliability, Risk, Maintenance, and Safety Engineering (ICQR2MSE), 631–634.
Biographies

Ye Chen works at Electric Power Research Institute of Yunnan Power Grid Co. Ltd, She received master’s degree in Power systems and automation from Kunming University of Science and Technology in 2017, engaged in electric energy, electrical measurement and thermal engineering professional work. Members of the High-precision Electrical Parameter Laboratory, Spark Power Research Studio, Intelligent Perception Innovation Studio and Key Laboratory of CSG for Electric Power Measurement.

Ziyi Chen, born in Liaoning Province, China, in 2003. Undergraduate at Shenyang Agricultural University, mechanical design and manufacturing and automation, mainly research electronic design and circuit related fields.

Yaohua Liao (1992), male, master, engineer, Yunnan Power Grid Co., Ltd. Electric Power Research Institute, engaged in electric energy, electrical measurement, thermal engineering and high voltage measurement professional work, good at solving measurement-related field problems. Members of the High-precision Electrical Parameter Laboratory, Spark Power Research, and Intelligent Perception Innovation Studio participated in the drafting of the Q/CSG 1209013.2-2019 and Q/CSG 1209013.7-2019 corporate standards.

Mengmeng Zhu works at Electric Power Research Institute of Yunnan Power Grid Co.Ltd, senior engineer, the research direction is electric energy metering device technology research and power transformer field verification, AC/DC electronic transformer field key test technology application and distribution network fault detection and protection control work.

Zhihu Hong, born in Yunnan Province, China, in 1993. He received a master’s degree in electrical engineering from Southwest Jiaotong University in 2018, and currently works as a high voltage researcher of Yunnan Electric Power Research Institute of China Southern Power Grid. His research interests include insulation and condition assessment of high voltage electrical equipment, multi physical field finite element simulation of high voltage electrical equipment.

Zhangnan Jiang was born in Yunnan, China, in 1993. He received the Bachelor of Engineering degree in electrical engineering and automation from Kunming University of Science and Technology, China, in 2015. He is currently pursuing the Master of Engineering degree in instrumentation engineering from Kunming University of Science and Technology. His fields of research interests are mainly focused on fiber bragg grating instrumentation and hot-spot temperature of transformer winding.
Distributed Generation & Alternative Energy Journal, Vol. 37_2, 199–214.
doi: 10.13052/dgaej2156-3306.3726
© 2021 River Publishers