Study on Life-Cycle Energy Consumption and Greenhouse Gases Emission of Battery Electric Passenger Vehicles in China
Bo Zhang1,*, Qiang Lu1, 2, Zheng Shen1, Yaokun Yang1 and Yunlin Liang1
1China Automotive Technology & Research Center Co., Ltd., 188 Western Rd., South 4th Ring Rd., 100070, Beijing, China
2School of Transportation Science and Engineering, Beihang University, 100191, Beijing, China
E-mail: bozhang0512@126.com
*Corresponding Author
Received 12 May 2021; Accepted 16 June 2021; Publication 28 July 2021
Abstract
Based on the localized data of environmental load, this study has established the life cycle assessment (LCA) model of battery electric passenger vehicle (BEPV) that be produced and used in China, and has evaluated the energy consumption and greenhouse gases (GHGs) emission during vehicle production and operation. The results show that the total energy consumption and GHG emissions are 438GJ and 37,100kg (in terms of CO equivalent) respectively. The share of GHG emissions in total emissions at the production stage is 24.6%, and 75.4% GHG emissions are contributed by the operational stage. The main source of energy consumption and GHG emissions at vehicle production stage is the extraction and processing of raw materials. The GHG emissions of raw materials production accounts for 75.0% in the GHG emissions of vehicle production and 18.0% in the GHG emissions of full life cycle. The scenario analysis shows that the application of recyclable materials, power grid GHG emission rates and vehicle energy consumption rates have significant influence on the carbon emissions in the life cycle of vehicle. Replacing primary metals with recycled metals can reduce GHG emissions of vehicle production by about 7.3%, and total GHG emissions can be reduced by about 1.8%. For every 1% decrease in GHG emissions per unit of electricity, the GHG emissions of operation stage will decrease by about 0.9%; for every 1.0% decrease in vehicle energy consumption rate, the total GHG emissions decrease by about 0.8%. Therefore, developing clean energy, reducing the proportion of coal power, optimizing the production of raw materials and increasing the application of recyclable materials are effective ways to improve the environmental performance of BEPV.
Keywords: Life cycle assessment, battery electric passenger vehicle, energy consumption, greenhouse gases.
1 Introduction
The automotive industry is an important pillar industry of the national economy and plays an important role in economic and social development. With the sustained and rapid development of economy and urbanization, the quantity of automobiles will keep increasing in the future, which will bring about more serious energy and environmental problems. According to the Technology Roadmap for Energy Saving and New Energy Vehicles (NEVs), China’s NEVs industry will develop steadily, and the sales volume will reach about 30 million vehicles in 2020, accounting for more than 7% of the total automobile sales; in 2025, the volume will reach 35 million, accounting for more than 15% of total; and in 2030, the volume will reach about 38 million, accounting for more than 40% of the total sales volume. In the situation of rapid development of NEVs, it is very meaningful to scientifically evaluate the environmental impact of NEVs [3, 15, 24].
LCA is a widely used tool for environmental impact assessment, and it is an objective method for evaluating the environmental load of products, technological processes or activities. By identifying and quantifying the use of all substances and energy, this method evaluates the environmental impact caused by these factors. It evaluates and carries out the corresponding opportunities to improve environmental performance. LCA covers all phases of products, processes or activities, such as raw material acquisition, production, transportation, use and recycling to final disposal [29].
Other scholars abroad have done a lot of researches on LCA of NEVs, mainly about the analysis of energy saving and emission reduction potential of NEVs [16, 36], the environmental contribution of power battery [37], the effects to the environmental performance of NEVs under different power generation methods and materials [5, 35], however, the results of other countries research cannot be directly applied to China’s practice because of China energy structure, energy efficiency and material production technology are quite different from those of other countries, so the regional restriction of data [8].
Table 1 Electricity mix in China and America in 2019 [38, 39]
| Percentage | ||
| Source | China Mix | U.S. Mix |
| Hydroelectric | 17% | 7% |
| Coal | 60% | 29% |
| Nuclear | 5% | 20% |
| Wind | 5% | 7% |
| Solar | 3% | 2% |
| Natural gas | 3% | 34% |
| Other | 7% | 1% |
Domestic research results show that compared with traditional gasoline or diesel vehicles, NEVs have much lower consumption of energy and resources in the overall life cycle [31]. Material production is an important part of energy saving and emission reduction in the automotive industry. However, due to the limitations of the data sources, domestic scholars have considered fewer types of materials for their research [38], and the materials data is mostly foreign data. The influencing factors and mechanisms of environmental problems also need to be studied in depth, such as grid carbon emissions and recyclable materials application.
This study adopts the LCA method to calculate the energy consumption and GHG emissions of BEPV, including material production, parts processing, assembly and vehicle operation, and using domestic data. The main influencing factors of GHG emissions from battery electric vehicle are further analysed to provide references for planning of the future development of NEVs in China [14, 27].
2 Methodology and Data
2.1 System Boundary Definition
The system boundary includes the production and operation of vehicles. The components include power battery system, electric motor system and vehicle body system, and the production phase includes ore mining, materials production, components manufacturing, vehicle painting, vehicle welding and vehicle assembly [23]. In the operation phase, the electricity life cycle is considered. Due to the limited data, the energy consumption and pollutants emission of infrastructures are not included in this research scope, such as plants, equipment and oil liquid production [17]. The system boundary of LCA for electric vehicle is shown in Figure 1. The total weight of subject vehicle is 1,520 kg, and the mass of each parts are shown in Table 2.
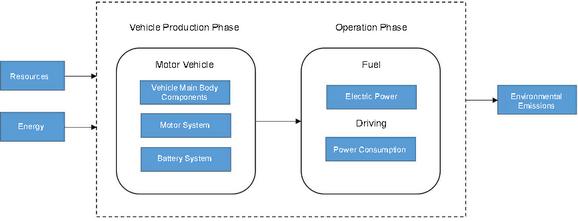
Figure 1 System boundary of BEPV production and operation.
Table 2 Specification mass of BEPV
| Composition | Mass/kg |
| Electric vehicle | 1,520 |
| Motor system | 85.4 |
| Battery system | 220 |
| Vehicle main body components | 1,189.6 |
| Oil liquid | 25 |
2.1.1 Vehicle production
Based on the investigation and public information, the mass and composition ratio of raw materials of the power battery system, drive motor system and vehicle body system are shown in Table 3.
Table 3 Main material inventory and sources of battery electric vehicle production chain
| Vehicle Main | ||||||
| Motor System | Battery System | Body Components | ||||
| Material Type | Mass/kg | Proportion | Mass/kg | Proportion | Mass/kg | Proportion |
| Steel | 30.8 | 36.1% | 3.1 | 12.8% | 841.3 | 70.7% |
| Copper | 23.8 | 27.8% | 23.9 | 16.4% | 35.9 | 3.0% |
| Aluminium | 30.8 | 36.1% | 42.0 | 12.6% | 52.1 | 4.4% |
| Magnesium | – | – | – | – | 0.3 | 0 |
| Plastic | – | – | 7.0 | 9.7% | 154.5 | 13.0 |
| Graphite/carbon | – | – | 32.1 | 12.8% | – | – |
| LiMn2O4 | – | – | 73.5 | 18.1% | – | – |
| EC | – | – | 27.3 | 12.2% | – | – |
| Glass | – | – | – | – | 44.3 | 3.7% |
| Rubber | – | – | – | – | 22.4 | 1.9% |
| Others | – | – | 11 | 1.1 | 38.7 | 3.3% |
| Total | 85.4 | 100% | 220 | 100% | 1,189.5 | 100% |
The materials of the battery system mainly include LiMnO, graphite, steel, copper, aluminium, plastic, etc. The main processes of making cells from raw materials include mixing, coating, drying, pressing, tableting and cutting, winding, shell filling, liquid injection and formation. The cells are processed into battery packs through the technological processes such as the cell sorting, grouping, wiring harness and battery management system installation and testing. According to the enterprise investigation, the energy consumption in the battery manufacturing phase mainly occurs in two links: drying and formation [25, 34].
The materials of motor system include steel, iron, copper and aluminium. The insulating materials, plastics for sealing rings and fans are not considered because of small proportion. The manufacturing of the motor system include forging, casting, welding, metal cutting, assembly, punching and pressing of iron core, manufacturing of commutator and windings (winding, forming, insulation, dipping and wire embedding) and other processes. The manufacturing mainly consumes electricity and natural gas, the life cycle data list is based on the localized data in China [1].
The materials of vehicle main body system include steel, plastic, aluminium, copper, etc. The system can be decomposed into four parts, such as powertrain (excluding power battery and motor), chassis, electronic controller, vehicle body (including interior and exterior decoration, glass, etc.) [10]. The environmental impact of glass, rubber and other materials is not considered in this study due to small proportion. The production of vehicle body system includes hot rolling, cold rolling, electroplating and stamping of steel materials, casting of aluminium alloy parts, hot rolling, cold rolling, stamping and extrusion of forged aluminium alloy plates, winding of copper wires, etc.
The vehicle assembly includes raw material handling, welding, compressed air, paint production, vehicle painting, etc. The energy required in this process is mainly provided by natural gas and electricity. Coatings are composed of oils, resins, pigments, thinners (solvents and diluents), driers and other auxiliary materials [32], which may emit a large amount of volatile organic compounds during usage. Because of the complex composition of auxiliary materials of coating, the production of these materials is not considered in this study.
2.1.2 Vehicle operation
The life cycle mileage of vehicle has an effect on the energy consumption and environmental emissions during vehicle operation stage, many literatures are generally set at 150,000 km to 300,000 km [20]. Considering the regulations on years of vehicle service before scrapping and service intensity in China, this study assumes that the vehicle driving life is 200,000 km. According to the application situation of the industry, the energy storage type of BEPV is mainly Li-ion battery. The results of experiment by Saft Company show that Li-ion batteries can meet the requirement for service life of 15 years (250,000 km) [26]. This paper assumes that the battery will not be replaced during the overall vehicle service life.
This study only considers the indirect GHG emissions caused by the electricity consumption, excluding HFC-134a and other GHGs emitted by air conditioners leakage or improper treatment during operation. The energy consumption and GHG emissions of BEPV during operation are determined by the vehicle energy consumption rate, grid energy consumption rate and GHG emissions rate.
2.2 Calculation Model
The accounting of energy consumption and GHG emissions for LCA of BEPV is carried out by life cycle phases. The total energy consumption and emissions are the summary of that in each life cycle phases which mainly include materials production, parts processing, vehicle painting, welding and assembly, use and upstream energy production. The calculation of energy consumption in the overall life cycle of vehicle is shown in Formula (1).
| (1) |
where E is the total energy consumption (in MJ), E is energy consumption in upstream production (in MJ), E is energy consumption in raw material processing (in MJ), E is energy consumption in parts manufacturing (in MJ), E is energy consumption in vehicle painting, welding and assembly (in MJ), and E is energy consumption in vehicle operation (in MJ).
The emission of GHGs in the life cycle of vehicle is calculated by Formula (2). The GHGs are calculated with reference to the methods and factors recommended by IPCC [18].
| (2) |
where GHGs is life cycle GHGs (in kg), GHGs is greenhouse gas emission from raw materials and their upstream production (in kg), GHGs is greenhouse gas emission from raw material processing (in kg), GHGs is greenhouse gas emission from parts manufacturing (in kg), GHGs is greenhouse gas emission from vehicle painting, welding and assembly (in kg), and GHGs is greenhouse gas emission from vehicle operation (in kg). The total energy consumption E and total greenhouse gas emission GHGs are calculated by the product of operation distance, energy consumption rate and power grid energy consumption rate or GHG emissions rate.
2.3 Data Sources
According to the LCA model of electric vehicle, the data classification and sources involved in this study are as follows: (1) Data of raw material production, processing and energy production. The energy consumption and environmental impact during the production and processing of raw materials are far greater than those during the production of parts [2]. Therefore, it is of great significance to calculate the total energy consumption and GHG emissions during the production of vehicle by using localized data in China. In this study, the data concerning total energy consumption and environmental impact of the main raw materials and energy production are all derived from the localized LCA data. (2) Data of parts production, vehicle painting, welding and assembly. The data of material composition, automobile painting, welding and assembly of the main body and motor are acquired by referring to the data in the Greenhouse Gases, Regulated Emissions, and Energy Use in Transportation model by Argonne National Laboratory (GREET), the data of raw material consumption and energy consumption in the production of power battery system, come from the investigation of six typical enterprises in China. The investigation includes the information of production technology, technical level, production efficiency, raw materials input, energy input, etc. (3) Data of energy consumption during vehicle operation. To evaluate the energy consumption in the vehicle operation phase, it is necessary to consider the performance of the vehicle and the driving habit of drivers. In addition, the energy consumption of vehicle depends largely on the vehicle load. This study used questionnaire research (50 questionnaires were distributed and returned) method to analyze the driving conditions of 50 battery electric vehicle users in Beijing. According to the results of the questionnaire survey and the research objective of this paper, the current energy consumption rate of BEPV is between 12 kWh/100 km and 25 kWh/100 km, taking into account the differences in energy consumption caused by vehicle types, driving habits, season and other factors. The energy consumption rate of the vehicle in this study is calculated at 17.3 kWh/100 km by consulting the experts in NEVs testing. The energy consumption rate is a direct reading from the dashboard, and the influencing factors are considered, such as battery capacity, motor efficiency, electricity supply efficiency and charging efficiency [30].
The data types and sources are shown in Table 4. According to the 2019 annual report of China’s electric power industry, China’s power supply structure in 2018 is as follows: hydropower 17.6%, thermal power 70.4%, nuclear power 4.2%, wind power 5.2%, solar energy 2.5% and others 0.1%.
Table 4 Data categories and sources
| Life Cycle Phase | Data Categories | Data Sources |
| Energy production | Life cycle assessment data of coal, oil, natural gas and other energy sources | Ding et al., 2017 [11] |
| Electric power composition and life cycle assessment data | Annual Development Report of China Power Industry 2019 [9] | |
| Material production | Life cycle assessment data for steel and recycled steel | Qinyu, Q. et al., 2019[28]; Shi, X. et al., 2016 [31] |
| Life cycle assessment data for copper and recycled copper | Maria, A., C. et al., 2019 [22]; Azadeh, K. et al., 2018 [6] | |
| Life cycle assessment data for aluminium and recycled aluminium | Zhan, Z. et al., 2019 [34] | |
| Life cycle assessment data for main raw materials of power battery, including magnesium, plastic, graphite and others | Burak, S. et al., 2019 [7]; Fangyi, L. et al., 2019 [13]; Jun, L. et al., 2020 [19]; Kyeonghun, J. et al., 2018 [21] | |
| Parts production, Vehicle painting and assembly | Material composition of battery | Investigation and GREET model |
| Material composition of motor | Investigation and GREET model | |
| Composition and assembly energy consumption of other main body components | Investigation and GREET model | |
| Vehicle painting, welding and assembly | Investigation and GREET model | |
| Vehicle operation | Power consumption per 100 km | Questionnaire survey, road test and literature (Hawkins et al., 2013) [16] |
In order to simplify the calculation and access to the data, only the energy consumption and GHG emissions from the production of the raw materials that accounting for more than 5% of vehicle total weight are taken into account. The plastic is very complex due to its variety and composition, so this study assumes that all of the plastics are polyethylene in the calculation process. The GHG emissions list of main raw materials per unit mass is shown as Table 5.
Table 5 GHGs of main material in BEPV
| Raw Materials | GHG Emissions/kg |
| Steel | 2.2 |
| Copper | 16.5 |
| Aluminium | 21.7 |
| Magnesium | 28.8 |
| Plastic | 4.5 |
| Graphite/carbon | 0.7 |
| LiMn2O4 | 3.5 |
| EC | 0.5 |
3 Results and Discussion
3.1 Energy Consumption Analysis
3.1.1 Energy consumption in life cycle
According to formula (1), the total energy consumption in the production and operation of BEPV is 438 GJ, equivalent to 2.2 MJkm, which is lower than the findings of other scholars 3.1 MJkm [12], this is mainly caused by the different grid structure and system boundaries. This study uses the power production data of 2018, the national average standard coal consumption for power supply in 2018 decreased by 13.5% compared with 2010. In addition, the system boundary of BEPV in this study includes the production and operation of the vehicle, excluding the vehicle distribution, maintenance and the production of vehicle fluids. Figure 2 shows the comparison of the calculated energy consumption of BEPV in each life cycle phase in this study. The total energy consumption of vehicle in operation and production accounts for 70% and 30% of the overall life cycle respectively, and the energy consumption in operation is about 2.3 times higher than that in production. The production of main vehicle body components consumes the largest amount of energy, accounting for 68.5% of the total energy consumption of the vehicle production, while the production of battery system and motor system account for 18.7% and 12.8% respectively.
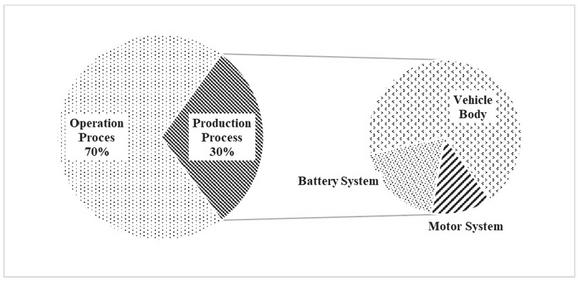
Figure 2 Energy consumption in different life-cycle phases.
The proportion of energy consumption in the production of motor system, battery system and vehicle main body components is shown in Figure 3. In the production of battery system, the raw material production accounts for about 94.7%, while the manufacturing accounts for 5.3%. In the production of motor system, the raw material production accounts for about 94.2%, while the manufacturing process accounts for only 5.8%. In the production of vehicle main body components, the energy consumption of the raw material production the energy consumption of the material processing the energy consumption of the final assembly, with the energy consumption of the raw material production accounting for 71.3%. The results show that the raw material production is the main contributor to the energy consumption in the production of each subsystem of the electric vehicle.
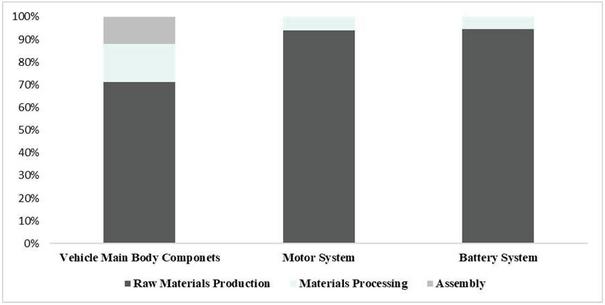
Figure 3 Energy consumption of EV components production.
3.1.2 Contribution proportion of material energy consumption
The energy consumption in raw materials production is shown in Figure 4. The results show that the energy consumption in the production of aluminium is the largest, and the cast aluminium and forged aluminium account for 15.7% and 19.4% respectively. Since steel is the main composition of the vehicle materials, accounting for about 66%, so the energy consumption in steel production is second, accounting for 23.6%. Although the amount of copper used is only 3.1%, the energy consumption takes the third place, accounting for 22.3%, the main reason is the high energy consumption of pyro-metallurgy method for copper refining. Therefore, optimizing copper refining can effectively reduce the energy consumption in the production. Plastic is the second largest portion of raw material for electric vehicle, its application is about 13%, and energy consumption accounts for 14.6%, while others account for less than 5%.
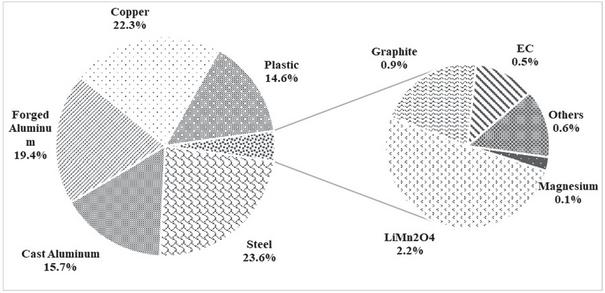
Figure 4 Energy consumption of raw material production.
3.2 GHG Emissions Analysis
3.2.1 GHG emissions in life cycle
From formula (2), the GHG emissions of BEVs during production and operation processes is 37,100kg (CO equivalent). Similar to the above-mentioned energy consumption structure, the GHG emissions in vehicle operation are much higher than in vehicle production, accounting for 75.4%, and the emission of vehicle production only accounts for 24.6%. In the production of electric vehicle, the distribution of GHGs in each life cycle phase is basically consistent with that of energy consumption, with the vehicle body, battery system and motor system accounting for 68.4%, 19.0% and 12.6% respectively. The raw material production is the main source of GHG emissions, accounting for 74.5% of GHGs in the vehicle production and 17.5% of that in the overall life cycle.
3.2.2 Contribution proportion of materials GHG emissions
The GHG emissions of material production is 6,840 kg, and the proportion of various materials is shown in Figure 5, the GHG emissions ratio of various materials is similar to the energy consumption. The aluminium is the highest source of GHG emissions, with cast aluminium and forged aluminium accounting for 20.8% and 16.5% respectively. The GHG emissions in steel production and copper production accounts for 27.9% and 19.4% respectively. The GHG emissions in plastics production accounts for about 10.4%. The GHG emissions of other raw materials accounts for about 5%.
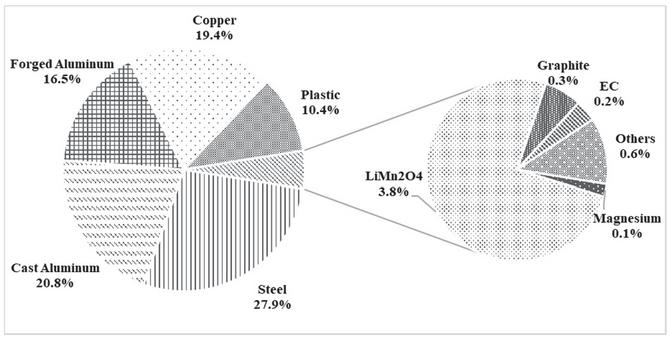
Figure 5 GHG emissions of raw material production.
4 Scenario Analysis
4.1 Recyclable Materials Application Simulation
According to the previous analysis of GHGs contribution rate, material production is the main contributor of GHGs in vehicle production. With the continuous progress of material technology, recyclable materials are increasingly applied to the automotive industry. The energy consumption and emission of recyclable materials are far less than those of primary materials. It is important to quantify the emission reduction potential of the application of recyclable materials. It could provide data support for the sustainable development of automobile industry.
Based on the application proportion of recyclable metals in China and the experience of using recyclable metals abroad, the application ratios of recycled steel, recycled aluminium and recycled copper are set. The results are shown in Table 6. According to statistics, China’s scrap utilization in 2013 accounted for 11% of the crude steel output in that year [33]. According to the data in the GREET model [4], the utilization rate of scrap steel of other countries reached 30%. The proportion of recycled aluminium in China’s aluminium output is 20%, while that in developed countries has reached about 50%. The proportion of recycled copper in China’s copper output is about 32%. While in some specific application fields such as power cable industry, the proportion of recycled copper has reached 50%. Therefore, this study set the application ratio of recycled copper in automobile as high as 50%.
Table 6 Scenarios of applications of recyclable metals
| Scenario | Usage Ratio | ||
| Recycled Steel | Recycled Aluminium | Recycled Copper | |
| Scenario 1 | 0 | 0 | 0 |
| Scenario 2 | 7.5% | 12.5% | 10.0% |
| Scenario 3 | 15.0% | 25.0% | 20.0% |
| Scenario 4 | 22.5% | 37.5% | 30.0% |
| Scenario 5 | 30.0% | 50.0% | 50.0% |
As the primary metal is replaced by the recyclable metal, the simulation results are shown as Figure 6. The GHG emissions during vehicle production decreases by 662kg from Scenario 1 to Scenario 5, with a decrease rate of about 7.3%. And the life cycle GHG emissions decreases by about 1.8%.
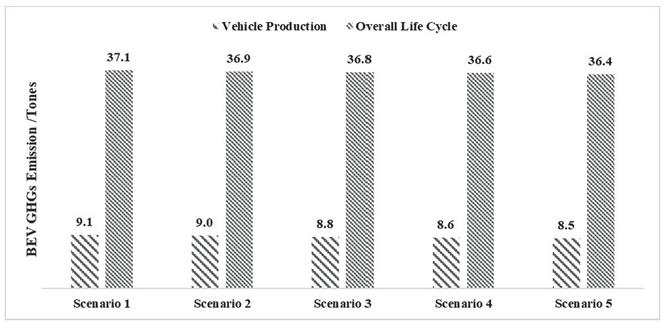
Figure 6 GHG emissions under application scenarios of recyclable metal.
4.2 Grid Power GHG Emissions Simulation
Since electricity is the only power source of BEV, the adjustment of grid structure will inevitably lead to the change of vehicle energy consumption and GHG emissions during the life cycle. The scenario being set is that the power grid GHG emissions decrease by 5%, 10%, 15%, 20% and 25% relative to the baseline in 2018. The analysis shows that a 25% decrease in GHG emissions rate of power grid would result in a 21.4% decrease in life cycle GHG emissions for electric vehicles.
4.3 Vehicle Energy Consumption Rate Simulation
Compared with the production of vehicle, the operation affects the life cycle GHG emissions to a greater extent. With the consideration of the differences in energy consumption rates of vehicle caused by different seasons and driving habits, this study sets five scenarios with energy consumption rates of 15 kWh/100 km, 16 kWh/100 km, 17 kWh/100 km, 18 kWh/100 km, 19 kWh/100 km and 20 kWh/100 km. As the energy consumption of vehicle operation decreases from 20 kWh/100 km to 15 kWh/100 km, the life cycle GHG emissions decreases by about 8,100 kg, with a decrease ratio of 20%. With vehicle energy consumption rate decreases by 1%, the life cycle GHG emissions decreases by about 0.8%.
5 Conclusions
• This paper provides a more comprehensive evaluation of the energy consumption and greenhouse gas emissions of pure electric passenger cars, the relevant data was collected through enterprise Investigation, model calculation and the National Engineering Laboratory of Industrial Big Data Application Technology.
• The energy consumption and GHG emissions of BEPV mainly come from the vehicle operation stage, the energy consumption in vehicle operation stage is about 2.3 times higher than that in the production stage, the indirect GHG emissions in operation is about 3.1 times higher than that in the production stage. The cleanliness of power grid is the key factor in determining environmental impact of BEPV.
• For each subsystem of BEPV, the energy consumption and GHG emissions in the raw material production are dominant, among which the steel, copper, aluminium and plastic are the main sources. Optimizing the production of steel, copper, aluminium, plastic is the important way to enhance environmental performance of BEPV.
• Increasing the use of recyclable raw materials, developing clean energy, decreasing the proportion of coal-fired power and reducing the vehicle energy consumption rate are effective methods to reduce the fossil energy consumption and environmental emissions of electric vehicles.
Acknowledgments
This research was supported by the National Key Research and Development Program (Project No. 2019YFE0101900 and 2018YFE0105500).
Conflict of Interest
We all declare that we have no conflict of interest in this paper.
Data Availability
The data that support the findings of this study are available from the corresponding author upon reasonable request.
References
[1] Adila, A., Ping, J. (2020). Synergy and co-benefits of reducing CO2 and air pollutant emissions by promoting electric vehicles-A case of Shanghai. Energy for Sustainable Development, 55, 181–189.
[2] Anders, N., Emma, G., Sonja, L. Anne-Marie, T., Mikael, A. Torbjörn, T. (2019). Life cycle assessment of permanent magnet electric traction motors. Transportation Research Part D: Transport and Environment. 67, 263–274.
[3] Anders, N., Mia, R., Johan, T. (2019). Life cycle assessment of city buses powered by electricity, hydrogenated vegetable oil or diesel. Transportation Research Part D: Transport and Environment, 75, 211–222.
[4] Argonne National Laboratory. (2016). Argonne GREET Model. Retrieved Sep. 7, 2016, from https://greet.es.anl.gov/
[5] Athanasopouloua, L., Bikas, H., Stavropoulosa, P. (2018). Comparative well-to-wheel emissions assessment of internal combustion engine and battery electric vehicles. Procedia CIRP, 78, 25–30.
[6] Azadeh, K., Sherri, M., C., Jana, B., M. (2018). Cradle-to-gate environmental impacts of sulfur-based solid-state lithium batteries for electric vehicle applications. Journal of Cleaner Production, 202, 770–778.
[7] Burak, S., Nuri C. O., Murat, K., Omer T. (2019). Material footprint of electric vehicles: A multiregional life cycle assessment. Journal of Cleaner Production, 209, 1033–1043.
[8] Buresh, K., M., Apperley, M., D., Booysen, M., J. (2020). Three shades of green: Perspectives on at-work charging of electric vehicles using photovoltaic carports. Energy for Sustainable Development, 57, 132–140.
[9] China Electricity Council. (2019). Annual development report of China power industry 2019. Retrieved Jun. 14, 2019, from http://www.chinapower.com.cn/focus/20190614/1278086.html
[10] Cooney, G., Hawkins, T., R., Marriott, J. (2013). Life cycle assessment of diesel and electric public transportation buses. Journal of Industrial Ecology, 17(5), 689–699.
[11] Ding, N., Liu, J., Yang, J., et al. (2017). Comparative life cycle assessment of regional electricity supplies in China. Resources, Conservation and Recycling, 119, 47–59.
[12] Dipti, K., Siddharth, S., Renata, A., Hyung, C., K., Annick, A. (2020). Evaluating the cost and carbon footprint of second-life electric vehicle batteries in residential and utility-level applications. Waste Management, 113, 497–507.
[13] Fangyi, L., Rui, O., Xilin, X., Kaile, Z., Wu, X., Dawei, M., Kunpeng, L., Zhuo, S. (2019). Regional comparison of electric vehicle adoption and emission reduction effects in China. Resources, Conservation and Recycling, 149, 714–726.
[14] Felipe, C., Sebastian, T., Christoph, H. (2018). Integrated computational life cycle engineering - application to the case of electric vehicles. CIRP Annals, 67(1), 25–28.
[15] Fernando, E., K., S., Takaaki, F., Toshihiko, N. (2019). Application of energy and CO2 reduction assessments for end-of-life vehicles recycling in Japan. Applied Energy, 237, 779–794.
[16] Sun, X., Luo, X., Zhang, Z., Meng, F., & Yang, J. (2020). Life cycle assessment of lithium nickel cobalt manganese oxide (NCM) batteries for electric passenger vehicles. Journal of Cleaner Production, 273, 123006.
[17] Ilkka, H., David, M., R. (2019). Near-term potential of biofuels, electrofuels, and battery electric vehicles in decarbonizing road transport. Joule, 3(10), 2390–2402.
[18] IPCC. (2006). IPCC guidelines for national greenhouse gas inventories. Retrieved Apr. 28, 2013, from http://www.ipcc-nggip.iges.or.jp./public/2006gl/index.html
[19] Jun, L., Bin, Y. (2020). Analysis of greenhouse gas emissions from electric vehicle considering electric energy structure, climate and power economy of ev: A China case. Atmospheric Pollution Research, 11(6), 1–11.
[20] Kris, Y., Justin, I., Michael, A., Keith, C., Steven, S. (2020). Comparative life cycle assessment of unmanned aerial vehicles, internal combustion engine vehicles and battery electric vehicles for grocery delivery. Procedia CIRP, 90, 244–250.
[21] Kyeonghun, J., Ocktaeck, L. (2018). Comparative life cycle assessment of lithium-ion battery electric bus and Diesel bus from well to wheel. Energy Procedia, 145, 223–227.
[22] Maria, A., C., Francesco, G., Sonia, L., Marina, M., Maurizio, C. (2019). Reuse of electric vehicle batteries in buildings: An integrated load match analysis and life cycle assessment approach. Energy and Buildings, 186, 339–354.
[23] Michael, H., Maximilian, S. (2019). Utilization effects on battery electric vehicle life-cycle assessment: A case-driven analysis of two commercial mobility applications. Transportation Research Part D: Transport and Environment, 75, 87–105.
[24] Nuri, C., O., Mehdi, N., Murat, K., Yang, Z., Omer, T., Mikhail, C. (2017) Exploring the suitability of electric vehicles in the United States. Energy, 121, 631–642.
[25] Nuri, C., O., Murat, K., Nour, N., M., A., Rateb, J. (2019). How sustainable is electric mobility? A comprehensive sustainability assessment approach for the case of Qatar. Applied Energy, 250, 461–477.
[26] Nuri, C., O., Murat, K., Shiva, A. (2019). Eco-efficiency of electric vehicles in the United States: A life cycle assessment based principal component analysis. Journal of Cleaner Production, 212, 515–526.
[27] Pouria, A. (2019). Environmental impacts and behavioral drivers of deep decarbonization for transportation through electric vehicles. Journal of Cleaner Production, 225, 1209–1219
[28] Qinyu, Q., Fuquan, Z., Zongwei, Liu., Xin, H., Han, H. (2019). Life cycle greenhouse gas emissions of Electric Vehicles in China: Combining the vehicle cycle and fuel cycle. Energy, 177, 222–233.
[29] Rita, G., Fausto, F. (2017). A review of fleet-based life-cycle approaches focusing on energy and environmental impacts of vehicles. Renewable and Sustainable Energy Reviews, 79, 935–945.
[30] Roxana, J., J., Mahmoud, S., Ramina, J., J. (2019). Environmental and economic impacts of expanding electric vehicle public charging infrastructure in California’s counties. Transportation Research Part D: Transport and Environment, 77, 320–334.
[31] Shi, X., Wang, X., Yang, J., et al. (2016). Electric vehicle transformation in Beijing and the comparative eco-environmental impacts: A case study of electric and gasoline powered taxis. Journal of Cleaner Production, 137, 449–460.
[32] Xinyu, L., Krishna, R., Amgad, E., Henning, L., B., Michael, W., Neha, R. (2020). Comparison of well-to-wheels energy use and emissions of a hydrogen fuel cell electric vehicle relative to a conventional gasoline-powered internal combustion engine vehicle. International Journal of Hydrogen Energy, 45(1), 972–983.
[33] Yelin, D., Jianyang, L., Tonghui, L., Xianfeng, G., Chris, Y. (2017). Life cycle assessment of lithium sulfur battery for electric vehicles. Journal of Power Sources, 343, 284–295.
[34] Zhan, Z., Xin, S., Ning, D., Jianxin, Y. (2019). Life cycle environmental assessment of charging infrastructure for electric vehicles in China. Journal of Cleaner Production, 227, 932–941.
[35] Zicheng, B., Gregory, A., K., Zhenhong, L., Michael, R., M., Kainan, C., Lingjun, S., Zhengming, Z. (2019). Life cycle assessment and tempo-spatial optimization of deploying dynamic wireless charging technology for electric cars. Transportation Research Part C: Emerging Technologies, 100, 53–67.
[36] Qiao, Q., Zhao, F., Liu, Z., Hao, H., & Amer, A. A. (2020). Life cycle cost and ghg emission benefits of electric vehicles in china. Transportation Research Part D Transport and Environment, 86, 102418.
[37] Renshu, Yin, Shuhan, Hu, & Yang, et al. (2019). Life cycle inventories of the commonly used materials for lithium-ion batteries in china. Journal of Cleaner Production.
[38] Yang, Z., Wang, B., & Jiao, K. (2020). Life cycle assessment of fuel cell, electric and internal combustion engine vehicles under different fuel scenarios and driving mileages in china. Energy, 198(May 1), 117365.1–117365.9.
[39] Argonne National Laboratory, U.S. Department of Energy. The greenhouse gases, regulated emissions, and energy use in transportation model. January 2020, https://greet.es.anl.gov/.
Biographies

Bo Zhang received his Ph.D. degree from Jilin University. He has published extensively in various research areas of new energy vehicles, such as energy management strategy optimization, energy and environmental benefit analysis.

Qiang Lu is pursuing Ph.D. at Beihang University, and working in China Automotive Technology Research Center Co., Ltd. Mainly research on life cycle assessment of products, national policies, and corporate strategy.

Zheng Shen, Senior Researcher, working for China Automotive Technology and Research Center Co. Ltd., Graduated from the Department of Finance of Capital University of Economics and Business, nearly ten years of research experience in the automotive industry, long engaged in research work related to new energy vehicle policies and regulations, industrial development environment, macroeconomic development, etc. He has participated in a number of national projects and reports, such as the National Development and Reform Commission’s “Research on the Development Environment of Intelligent Networked Vehicle Industry” and the Ministry of Science and Technology’s “Interactive Analysis Research on Key Influencing Factors of Pure Electric Vehicle Promotion and Business Model under Typical Scenarios”.

Yaokun Yang received his Master’s degree from Beijing University of Technology, and engaged in the research of automobile industry policies and regulations, new energy vehicle business model, automobile life cycle analysis, power battery recycling technology development and management.

Yunlin Liang received her joint master degrees in Applied Mechatronics from Harper Adams University, UK, and in Vehicle Engineering from China Agriculture University, China. She has participated in a series of industrial research projects.
Distributed Generation & Alternative Energy Journal, Vol. 36_4, 363–384.
doi: 10.13052/dgaej2156-3306.3642
© 2021 River Publishers