An Optimal Islanding Detection Scheme for an Inverter-based Distribution Generation System
Bineeta Soreng and Raseswari Pradhan*
Dept. of Electrical Engineering, Veer Surendra Sai University of Technology, Burla, Sambalpur, Odisha, India
E-mail: rase1512@gmail.com
*Corresponding Author
Received 30 December 2020; Accepted 19 April 2021; Publication 24 June 2021
Abstract
In this paper, an optimal controller-based islanding detection scheme is proposed for an inverter-based distributed generation system (DGS). Islanding is both harmful and unsafe but unavoidable state in a DGS. Therefore, islanding state is required to be detected quickly and accurately. A reactive power control strategy for islanding is presented in this work. It is reported that the active and reactive power mismatches in a DGS forces its voltage or frequency to deviate. That deviation is recorded continuously in this scheme and islanding state is reported when the deviation touches the thresholds. To help in this tracking process, a modified H-based optimal controller whose parameters are tuned with LMI is proposed. It can offer both feedback and feed-forward control actions. The proposed DGS is modelled using MATLAB/SIMULINK and tested taking several case studies. It is found that, islanding condition is rapidly detected compared to that of the uncontrolled scheme yielding an optimal solution. Further, it is an inexpensive, robust, compact in structure and very easy to implement too.
Keywords: DGS, islanding detection, modified H-based controller, optimal solution, Reactive power control, LMI.
1 Introduction
Recently, DGSs are becoming integral part in the electrical distribution network. But inclusion of DGS make the existing power grid more complicated as they have great impact on the system stability. Therefore, DGS connected to grid utility have to ensure reliability, good power quality and safety [1]. Also, it is also seen that DGSs suffer from planned or unplanned islanding situations [2]. This islanding conditions in grid-tied DGSs are unavoidable but quite hazardous. Hence, it is necessary to be tracked and addressed in time [3].
This condition detection is quite an important topic of research. Several islanding detection techniques are available in literature [4, 5]. This condition can be estimated using two basic approaches passive and active methods. Passive methods are used to look after the transient actions occurred in the grid whereas active methods deal with the situation by guiding some sort of indications from the various components of the system like inverter or distribution point [4]. Passive techniques are based on the monitoring of the parameters like voltage and frequency at the Point of common coupling (PCC) but the active techniques are based on the observation of the responses of the inverter externally. Active techniques have a faster response and a smaller non-detection-zone (NDZ) compared to passive approaches [5]. Again, these islanding evaluation techniques are found to be using analytical and simulation-based processes [6].
An analytical process that predicts the future outcomes of a power system network by analysing its past performance data of the challenging network components for stability is presented in [7]. Here, transient network stability routine of the system is predicted and correlated with that of the predefined threshold limits. If the quantity and positions of these new components crosses the specified limit, islanding state is recorded. This prediction is quite difficult and erroneous.
Another method is available in which tripping of local switching devices are monitored [8]. Using this method islanding can both be detected and eliminated. However, tripping of switching devices has certain negative impacts on the dynamic performance of the power system. So, there is a need of an inadvertent islanding detection technique that does not have an undesirable impact on interconnected system performance [9]. The technique in [9] is a similar one that is an active technique. Here, the parameter for detection of islanding is variation in negative sequence of DG output voltage. The negative sequence of DG voltage resulted from the injection of the negative sequence current. The injection is done through the VSC controller. By doing this, the islanding at PCC using a device called unified three-phase signal processor (UTSP) [10]. The major limitation of this technique is that it can’t differentiate between a large load change and an islanding condition [11].
An improved technique that is the combination of positive feedback, voltage unbalance and THD was explained in [11]. But it is an active method and has negative impacts on the inverter performance. Paper [12] proposed a hybrid detection technique which is combination of both active and passive techniques. In this work, an adaptive reactive power shift anti-islanding algorithm is proposed. Further, paper [13] presented a method that is based on the variation in the intermittent bilateral reactive power. In this the inverter output with intermittent bilateral reactive power helps to detect the islanded condition. In both the above techniques, step-size of reactive power variation are fixed.
An adaptive islanding detection algorithm where variable perturbation-size of reactive power for DG system is considered in [14]. In this scheme, PCC frequency is recorded at each transient period. Then corresponding deviation in reactive power is calculated. It is seen that PCC frequency surpasses its set threshold value in islanding state. The deviation in the value of reactive power at PCC is usually depends on the resonance frequency of connected load. However, the design of this scheme is such that this deviation is minimum in islanding state. Therefore, this signal is intermittent in nature and false detection of islanding may occur due to zero-crossing of reactive power [15].
Another technique is present in literature that is based on monitoring the Q-f droop characteristic of DGS interface [15]. The Q-f droop is maintained in stable region in normal operation and goes out of its stable region in islanded condition. Therefore, islanding is detected observing the Q-f droop characteristic. This technique is found to be very sluggish due to absence of any controller.
An active islanding detection method for an inverter-based DGS is presented in [16]. Here, two control methods are analysed. In one of the methods, the DG provides only active power for power factor improvement. Same power factor improvement is done using both active and reactive powers in the other method. However, NDZ in case of the over voltage protection (OFP), under voltage protection (UVP), over frequency protection (OFP) and under frequency protection (UFP) are determined using each of these control methods. Further analysing of the DGS interface control mechanism, it seen that the NDZ of the OVP/UVP and OFP/UFP is recorded more during power factor improvement process. For the reduction of the NDZ, mismatches are intentionally created between the reactive powers of the load and the DGS. Hence, the frequency is forced to deviate from the threshold limits and islanding state is detected.
Another work has used a basic two-degrees-of-freedom (2DOF) based control scheme for islanding evaluation [17]. Here, data of the Averaged Interruption Frequency (AIF) and the Average Interruption Duration (AID) are recorded for one-year and a customer-oriented index is evaluated. This concept is found to be very effective [17]. One of the major shortcomings of this scheme is that stability analysis can’t be done using these basic islanding indices. For further improvement in the tracking process and operating range, implementation of Least Mean Square (LMI) based tools are proven to be very useful even for large and complex power systems [18]. Further, custom-oriented indices are applied here. However, they may not work efficiently in systems with complex nonlinear dynamics [19].
Again, the LMI based 2DOF type islanding assessment methods are classified into an sequential methods [20]. The randomness of renewable generations is covered by non-sequential methods whereas the data of past performance to predict the future islanding condition is feature of the sequential approach. The sequential methods are more flexible compared to that of the non-sequential as the former schemes able to take account variation in the PCC points.
A LMI based Simulation method is seen to be very useful in complex non-linear systems and can provide sufficient information about islanding evaluation in the presence of the disturbing periods like fault at each load point [21]. This method is found to be fast with very less computational time.
Islanding assessment of a hybrid DGs based microgrid system under grid-tied and islanded modes is offered in [22]. The hybrid network consists of the following sources based on DGSs like solar, wind, microturbine and diesel engine. This work has also used an LMI simulation algorithm. This study displays that the penetration of different DGs such that the stability indices of the distribution network are improved. However, there is a need to develop an islanding detection technique which can detect islanding condition rapidly and effectively in multiple DG interface. Therefore, a modification of exiting LMI algorithm is necessary.
From all the above discussion, it is clear that reactive power deviation generally has negative impact on the power system equipment. This reactive power deviation can be used as a factor to detect islanding condition. Again, using a properly tuned controller makes the detection process faster and more accurate. Therefore, this paper exploits these properties to design a new islanding detection scheme in a studied DGS.
The contribution of this paper is as follows. It proposed a new reactive power control-based detection scheme. It also comprises of a modified H-based controller whose parameters are tuned using LMI algorithm. Here, the reactive power of the DGS is controlled in such a manner that it will force the voltage or frequency to deviate from the thresholds and islanding state is recorded.
2 Modelling of a Grid Connected DGS
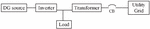
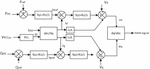
The layout of a simple grid integrated power network is shown in Figure 1. It consists of DG, inverter, load, transformer, circuit breaker (CB) and the utility grid. The node at which load, DG and grid are interconnected is known PCC.
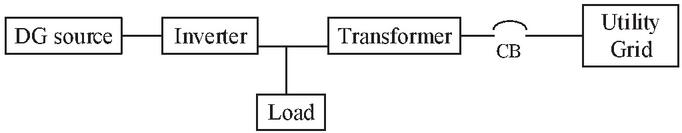
Figure 1 An overview of islanding mode in a grid-connected DG system [23].
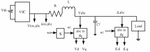
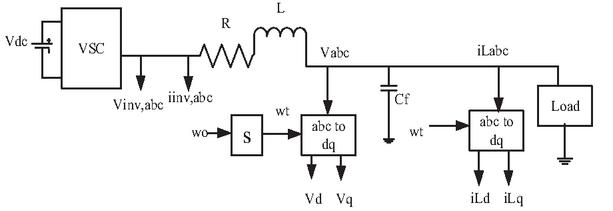
The layout of a microgrid operating in the islanding condition is shown in Figure 2(a). Here, the parameters of a step-up transformer are combined to the series filter and further connected to a medium-voltage (MV) based transmission line. Also, the load is an unidentified but measurable one. Loads of a power network are always indeterminate and topologically indefinite.
(a)
(b)
Figure 2 (a) The layout of a microgrid system [24] and (b) block diagram of the system for islanding detection [25].
However, it is presumed that the current of the load is measurable and is considered as a disturbance signal. This signal has a great influence on the system performance. This situation is transformed into a non-convex optimization problem. Therefore, it is required to formulate a control technique to find a solution to this optimization problem.
The system under study consists of an inverter-based DG, a three-phase parallel RLC load, filter to eliminate harmonics and the distribution network as shown in Figure 2(b). The grid, the DG and the RLC load are connected at a point, called as point of Common Coupling (PCC). The DG is placed near the local load so the transmission line which connects them is short hence the line loss is neglected. The dynamics of the DGS mathematically represented as follows.
| (1) | |
| (2) |
Where, V, V, iL and i are the three-phase variables vectors containing the usual meanings. Based on the instantaneous power theory and the Park transformation, the DG’s instantaneous active and reactive power output can be expressed in terms of the d–q axis components as follows.
| (3) | ||
| (4) |
Where, V and V are d and q voltage components at PCC respectively. Similarly, i and i are d and q current components at PCC respectively.
The active and reactive power consumed by the RLC load while the DG and the utility grid are connected to each other can be defined as follows.
| (5) | ||
| (6) |
Where, V and f are the phase voltage at PCC and its frequency respectively.
The relation between the active and reactive power also can be re-established from the Equations (4) and (5) as follows.
| (7) |
Voltage and current of Equations (1) and (2) are transformed from abc-frame to the dq-frame.
| (8) | |
| (9) |
Now taking i as a disturbing-noise signal, Equations (8) and (9) be rewritten in standard form as follows.
| (10) | |
| (11) |
where, , , and respectively. Now, A, B, B and C are identified as follows.
| (12) | ||
| (13) | ||
| (14) | ||
| (15) |
Again, in transfer functions of studied DGS dynamics are given as follows.
| (16) | ||
| (17) |
Where, and are plant and disturbance transfer functions respectively.
3 Problem Formulation in Grid Connected DGS
3.1 Islanding Detection Problem
During islanding mode, circuit breaker becomes open making grid to cut-off from load even though the DG is still inserting power to the local load. This type of situation occurs when the grid suffers some kind of erratic, interruption due to the occurrence of certain abnormalities like a failure of apparatus, voltage blackout, short circuit conditions.
The mismatch between the active powers during islanding can be defined as follows.
| (18) |
This equation can be rewritten as follows.
| (19) |
Due to this mismatch in the active powers, there is variation in the PCC voltage (V) expressed as below.
| (20) |
Where, V and V are the phase voltages at PCC before islanding and after islanding.
If there are no active power mismatches and the DGS is operating at unity power factor then mismatch between the reactive powers during islanding can be defined as follows.
| (21) |
The mismatch in reactive power during islanding can be expressed in terms of frequency as follows.
| (22) |
Where, f is the change in frequency before and after islanding.
| (23) |
Where, f and f are the phase frequencies at PCC before islanding and after islanding. It is known that f depends on both the active and reactive power when islanding occurs. Islanding can also be detected by tracking upper limit and lower limit of f by Over Frequency Protection (OFP) and Under Frequency Protection (UFP) techniques. It should be noted that thresholds value of voltage ranges from 0.88 to 1.1 pu and the frequency ranges from 49.3 to 50.5 HZ according to the IEEE Std. 929-2000 and IEEE Std. 1547-2003 respectively.
3.2 Formulation of Optimal Control Problem for Islanding Detection
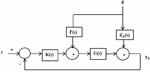
The control structure of the proposed DGS can be represented by a 2DOF feedback-feed forward control system as shown in Figure 3.
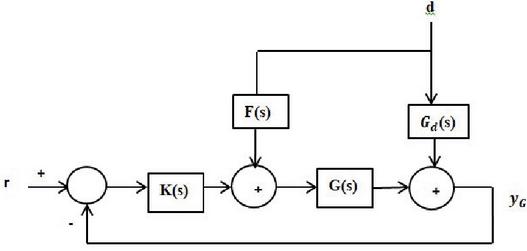
Figure 3 Block diagram of a control structure for the proposed DGS.
Refering Figure 3, disturb-signal transfer function () is given as follows.
| (24) |
To diminish effect of the disturbing-signal, a feed-forward controller with gain is chosen. But, the major issue with this controller design is calculation of inverse of gain G as it is a strictly-proper transfer function and gain G comprises of highly-uncertainty. Hence, instead of nullifying effect of the disturbing-signal; the control problem is modified to reduce the effect of the disturbing-signal. To achieve this function, the cost function of the control problem is formulated as follows.
| (25) |
Where, and L are weighing-function and disturbing-gain respectively. The inequality constraint-function for this control problem is as follows.
| (26) |
where,
| (27) |
and
| (28) |
where, , , S and T are the two required weighing-control-functions and the two-necessary sensitivity-control-functions respectively. Applying all these weighing and sensitivity functions in the controller-design problem, it is restructured as follows.
| (29) |
This control problem is capable of diminishing the effect of uncertain disturbing-signal satisfying the defined inequality constraint conditions. However, this control problem is very complex to solve as the controller consists of two separate controllers such as a feedback controller and a feed-forward controller. Therefore, a new controller technique is proposed in this paper.
4 Proposed Techniques
4.1 Proposed Islanding Detection Algorithm
When islanding occurs, the P results in the occurrence of V. Then, OVP/UVP can be utilised for the detection of islanding. Again, f depends on both P and Q. Therefore, OFP/UFP can also be utilised for the islanding detection. However, the major limitation of the above techniques is that islanding is not detected if P and Q are smaller than the respective limits. Also, it may suffer from large NDZ as there is no significant changes in the PCC voltage and frequency.
The proposed islanding detection technique is formulated based on the reactive power control. It has the ability to detect islanding effectively and do not suffer from NDZ (Figure 4).
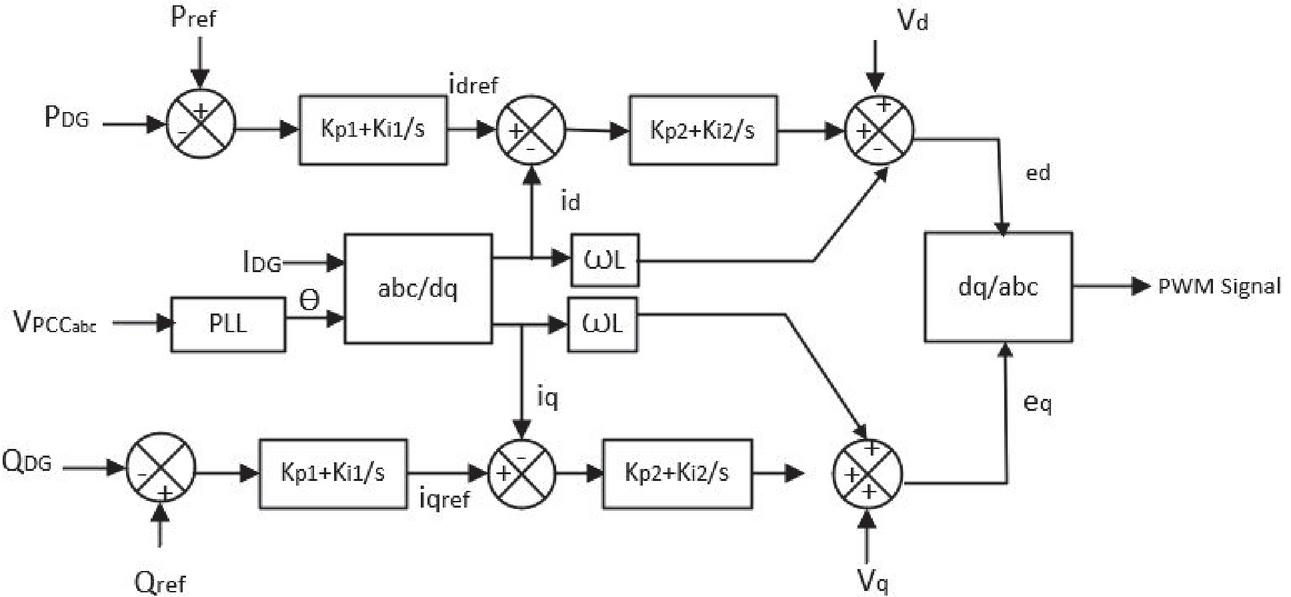
Figure 4 Interface Controller of the proposed DGS [4].
Here, the value of load resistance (R) is varied to create P (Figure 2). Whereas, the value of load inductance (L) is varied to create Q (Figure 2). If the voltage or frequency at PCC deviates from the thresholds then islanding condition detected.
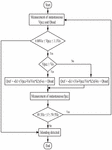
Further, the proposed islanding detection algorithm has the following features. (a) To create reactive power mismatches for elimination of NDZ and to force the frequency to deviate from the threshold value, (b) It should consistently vary the frequency caused by mismatches between both the active and reactive power mismatches so that islanding can be detected rapidly. The proposed islanding detection algorithm is derived in Figure 5.
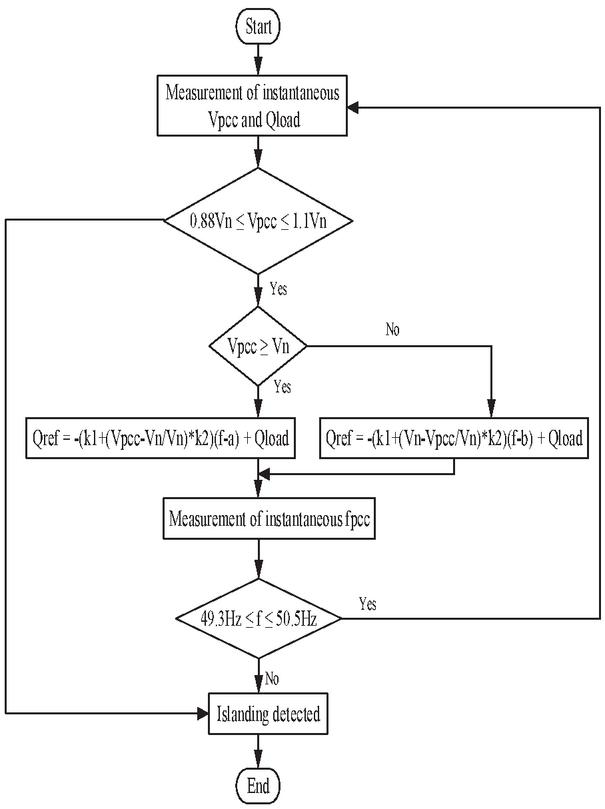
Figure 5 Flowchart of the islanding detection method.
According to the islanding detection algorithm, first it has to measure the voltage at PCC and reactive power of the load. If the PCC voltage is not within the range of threshold value then it will detect islanding. And if the voltage is within the range then it will check either the PCC voltage is greater than the nominal voltage or not. As the algorithm is based on reactive power control strategy if the PCC voltage is monitored above the rated value than the reference reactive power used by the DG can be expressed as follows.
| (30) |
And if the PCC voltage is monitored below the rated value than the reference reactive power used by the DG can be expressed as follows.
| (31) |
Where, a and b are constants whose values to be set below the lower frequency threshold and above the upper frequency threshold respectively. Here, the value of Q of the studied DGS depends on the voltage and thereby frequency at the PCC. In this proposed islanding detection algorithm formulation, either the frequency or the PCC voltage are monitored using OFP/UFP and OVP/UVP respectively. The proposed algorithm is able to detect islanding rapidly and with zero NDZ property.
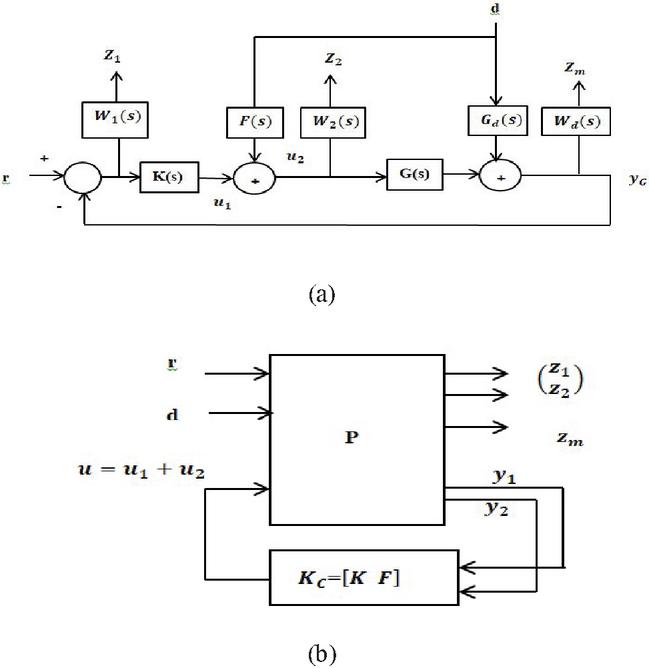
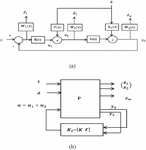
Figure 6 (a) Block diagram of the proposed controller and (b) The proposed modified H controller set up.
4.2 Proposed Optimal Control Technique for Islanding Detection
Further, a controller is necessary to help in the process of islanding detection and activation. The proposed modified H-based islanding detection control technique is shown in Figure 6(a). It is a 2-Degree of Freedom (DOF) Feedback and Feedforward Controller whose parameters have been optimized using LMI optimization method. The job of the optimization method is to solve the optimization problem given by Equation (29) such as the optimal set of control parameters of the given controller is obtained. Here, z and z are the control-signals meant for the desired loop-shaping whereas z is the signal to reduce effect of disturbing-signal, d.

Figure 7 Block diagram of the studied DGS with the proposed optimal controller.
Here,
| (32) | |
| (33) | |
| (34) |
In this controller design, the weighing variable, is defined as . Similarly, the loop-shaping control variable is designed as . Then, the control-gain between reference signal (r) and z is T. In that way, the control-gain between effective disturbing-signal (d- z) is T. These two control-gains are constructed as follows.
| (35) | ||
| (36) |
The proposed feedback and feedforward controllers are augmented as follows.
| (37) |
The linear fractional representation of the plant, controller with optimization algorithm block is shown in Figure 6(b).
In Figure 6, P, y, y, u, and u are a representation of the overall plant of the studied system, input to the feedback controller, input to the feedforward controller, outputs of the feedback controller and outputs of the feed-forward controllers respectively. In this controller design, proper tuning of the weighting functions is necessary so that sensitivity function S and hence would be properly tuned. This tuning is first done by only the LMI optimization technique and then by optimized modified H control technique.
5 Results and Discussion
5.1 For Islanding Detection Algorithm
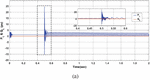
Some cases are considered and simulated in MATLAB/SIMULINK to check the performance of the studied DGS as shown in Figure 7.
The parameters for the main model are considered as described in the Table 1. In this technique, Q for the studied DGS is generated referring Equations (30–31) by measuring the PCC voltage and its frequency. The reference active power for the DGS is set to 200KW and several cases are studied by creating mismatches in the active power by varying the load of load resistances widely.
Table 1 Parameters for the studied System
| DGS Components | Parameter | Value |
| Grid | Voltage (V) | 400 |
| Frequency (Hz) | 50 | |
| Grid Resistance () | 0.1 | |
| Grid Inductance (mH) | 1.6 | |
| DG Inverter Control | K/K | 0.025/2 |
| K/K | 1.5/0.01 | |
| K | [100 0.5] | |
| P (KW) | 200 | |
| Load | R () | 0.8 |
| L (mH) | 2 | |
| C (F) | 3000 |
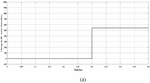
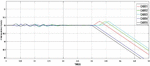
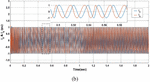
The voltage signal is retrieved at the PCC when islanding occurs. The islanding is initiated at t 0.3 sec at shown in the Figure 8. This voltage can be used to detect islanding by UVP/OVP methods. To know the effect of the different parameter settings on the proposed strategy five sets of value for k, k, a and b are considered and simulated as shown in Table 2.
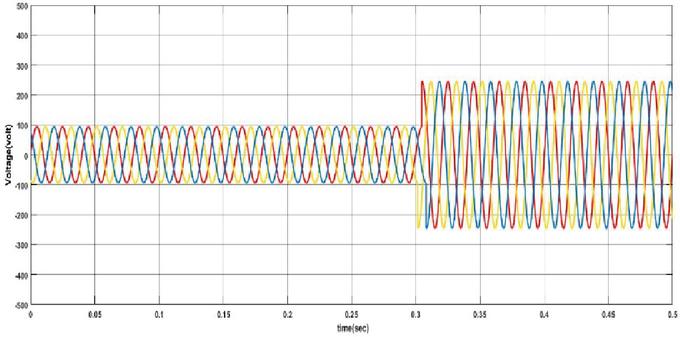
Figure 8 Three phase voltage signals under islanding condition at the PCC.
Table 2 Different predefined test-cases of islanding detection parameters for testing proposed detection algorithm
| Predefined Test-Cases | |||||
| Parameters | 1 | 2 | 3 | 4 | 5 |
| k | 1000 | 1000 | 800 | 1000 | 1000 |
| k | 0 | 0 | 0 | 0 | 10000 |
| a | 49 | 49 | 49.4 | 49 | 49.4 |
| b | 50.8 | 51 | 50.8 | 50.8 | 50.8 |
| P (KW) | 0.55 | 0.55 | 0.55 | 0.5 | 0.5 |
| Overshoot in f | Present | Present | Present | Not present | Not present |
| Detection time (secs) | 0.035 | 0.01 | 0.04 | 0.01 | 0.01 |
(a) For Test-Case-1
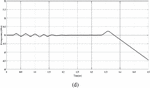
The considered values of k, k, a and b are as shown in Table 2. Further, the active power mismatch is set to 0.55 KW by adjusting the load resistance. From Figure 9(b), it is observed that the islanding is detected at about 0.335 sec. In this case as the active power mismatch is very low, frequency deviation is only caused by the reactive power mismatch.
(b) For Test-Case-2
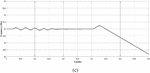
In this case, the other parameters remain approximately same as that of the case-1, only b is set more than that of the case-1. Further the active power mismatch is set to 0.55 KW. Figure 9(c) shows PCC frequency during islanding for this test condition. From the Figure 9(c), it is observed that the islanding is detected immediately around 0.31 secs. The result shows that deviation of the frequency is observed faster than that of case-1.
(c) For Test-Case-3
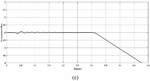
In this case, the other parameters remain approximately same as that of the case-1, only k is set less than that of the case-1. Further the active power mismatch is set to 0.55 KW. Figure 9(d) shows PCC frequency during islanding for this test condition. Though other parameters remain constant as the previous two cases, only the smaller value of K is taken in this case. From the Figure 9(d), it is observed that more time taken (0.34 secs) for the deviation of the frequency resulting in delayed detection as compare to case-1 and case-2.
(d) For Test-Case-4
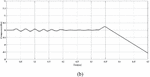
The considered values of k, k, a and b are as shown in Table 2. In this case, the other parameters remain approximately same as that of the case-1, only P is set less than that of the case-1. From Figure 9(e), it is observed that the islanding detection needs very less time (such as 0.31 secs) compared to that of case 1 and 3. In case-2 also same time required for detection but there the frequency has an over-damping notch which is absent in that of case-4. Here both active and reactive power contribute for the deviation in frequency from the threshold, making the detection time faster.
(e) For Test-Case-5
The considered values of k, k, a and b are as shown in Table 2. In this case, the other parameters remain approximately same as that of the case-1, only P is set less than that of the case-1. From Figure 9(f), it is observed that the islanding is detected in less than 0.31 secs without any over-damping notch in frequency. Here both active and reactive power contribute for the deviation in frequency from the threshold, making the detection time faster.
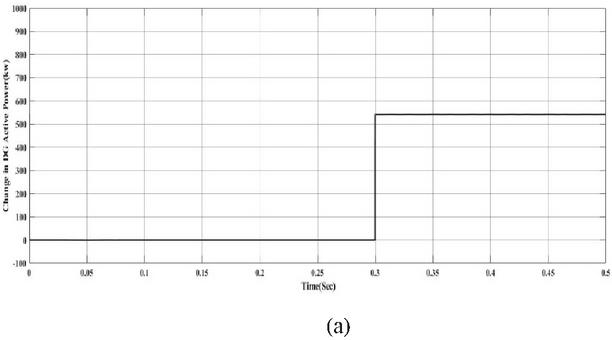
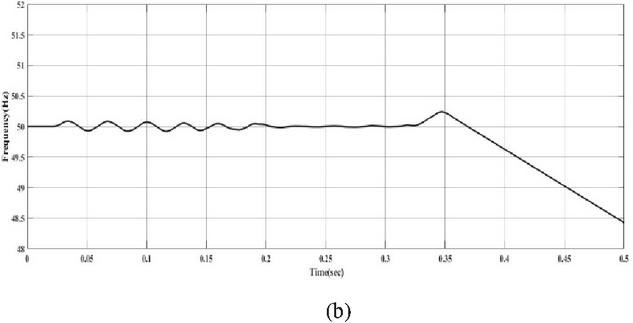
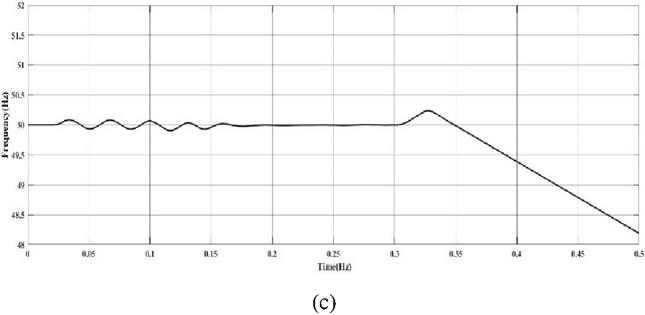
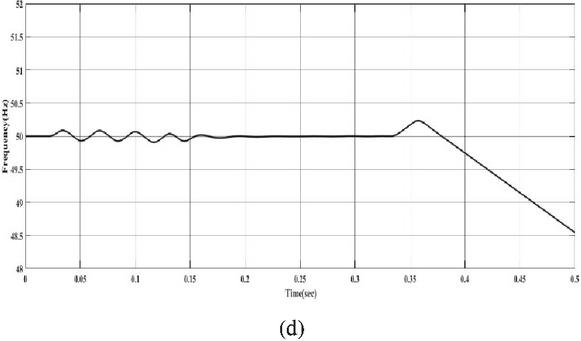
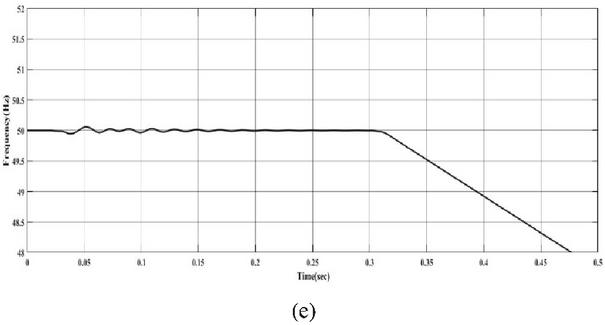
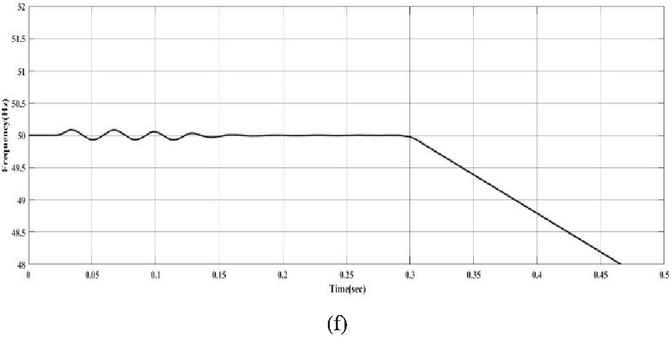
Figure 9 (a) Mismatch in DG Active Power and PCC Frequency during Islanding for (b) test-case-1, (b) test-case-2, (b) test-case-3, (b) test-case-4 and (b) test-case-5.
In this case the value of k is considered a higher value than the previous cases. It is seen from the figure that the detection time is approximately same as in case 4. So, it is concluded from this case that k has negligible effect on the control method. And here also the frequency is deviated due to both active and reactive power mismatches.
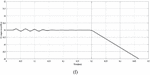
The results of the above case studies can be summarized in Figure 10 and Table 3. Before islanding the frequency at the PCC is 50 HZ. The islanding is initiated at t 0.3 sec. In case 1, 2 and 3, the deviation in frequency beyond its threshold is only caused by the mismatches in the reactive power as the mismatches between active power is very low in those cases. But in cases 4 and 5 both the active power and reactive power are responsible for the deviation in the frequency. From the comparison of case (1) and (2) it is known the smaller value of ‘a’ in case (2) cause larger mismatch in reactive power which force the frequency to deviate from the lower threshold in less time.
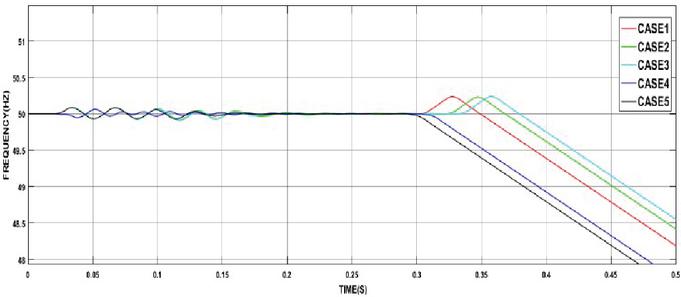
Figure 10 Frequency at PCC during islanding for different case studies.
From case (3) it is seen that the smaller value of k results in small change in reactive power, cause the islanding detection slower. In case (4) for the same value of ‘a’ and ‘b’ as in case (3) the detection time is 0.31secs which is lower than the other three cases as the frequency is deviated due to both active and reactive power mismatches.
In case 5 though the value of k is not set to zero and considered a high value the detection time is almost same as the case 4. In case 4 and 5 both the active and reactive power mismatches cause the frequency to deviate from the threshold value and k has negligible impact on the reactive power mismatch. Thus, the detection technique based on the reactive power control method is able to detect islanding rapidly and efficiently. This method is able to detect islanding easily in less time with larger value of k, k, b and for smaller value of a.
Table 3 Comparison of results using proposed detection algorithm for different predefined test-cases
| Predefined Test-Cases | |||||
| Parameters | 1 | 2 | 3 | 4 | 5 |
| Normal frequency (Hz) | 50 | 50 | 50 | 50 | 50 |
| Islanding time (secs) | 0.3 | 0.3 | 0.3 | 0.3 | 0.3 |
| Detection recording time (secs) | 0.335 | ~0.31 | 0.34 | 0.31 | 0.31 |
| Detection Response time (secs) | 0.035 | 0.01 | 0.04 | 0.01 | 0.01 |
| P (KW) | 0.55 | 0.55 | 0.55 | 0.5 | 0.5 |
| Overshoot present in f | Yes | Yes | Yes | No | No |
5.2 For Optimal Controller for Islanding Detection
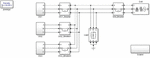
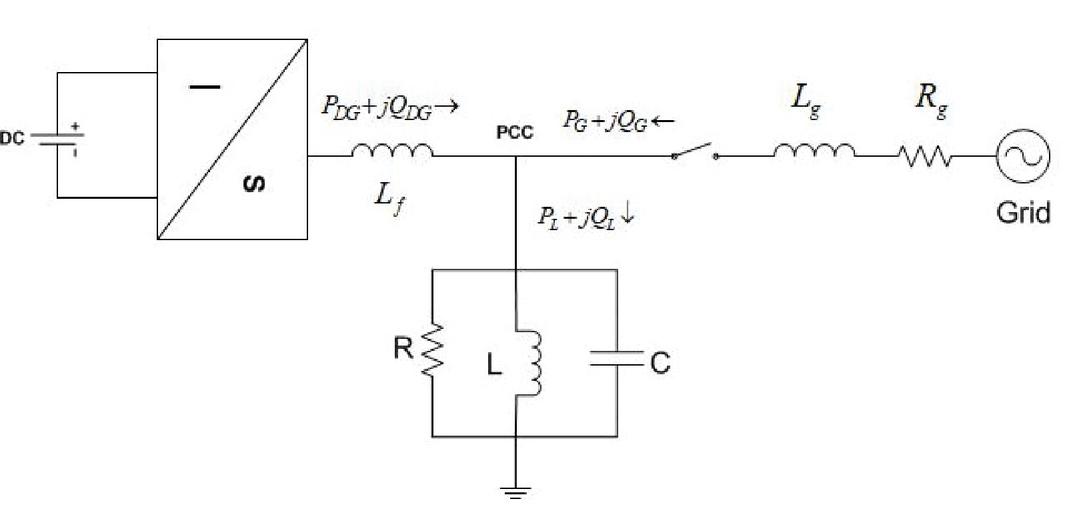
As discussed in the previous sections, both islanding detection and execution need to be very fast. Further, deviation in power and frequency overshoot need to be very less as compared to values reported in Table 3 during this period. Therefore, a well-tuned controller is required in the DGS sets. For this an optimal controller is presented as discussed in the previous section. To validate working of the proposed controller, a multi-DG-test-system consisting of three DGs is used as shown in Figure 11. The dynamics of each of these DGs are given in Table 4. Each DGs in Figure 11 are numbered by their respective numbers. This test system is intentionally kept sufficiently small to permit the execution of islanding calculations with reasonable computation time. RLC-loads are taken in each phases of this system.
The studied test system is designed in the MATLAB/SIMULINK and analysed in three pre-defined test conditions such as (a) balanced RLC-load dynamics, (b) unbalanced RLC-load dynamics and (c) highly non-linear and unbalanced load dynamics. The reference to the real power (P) and reactive power (Q) of load are set as 1.2 pu and 0 pu respectively as shown in Figure 11.
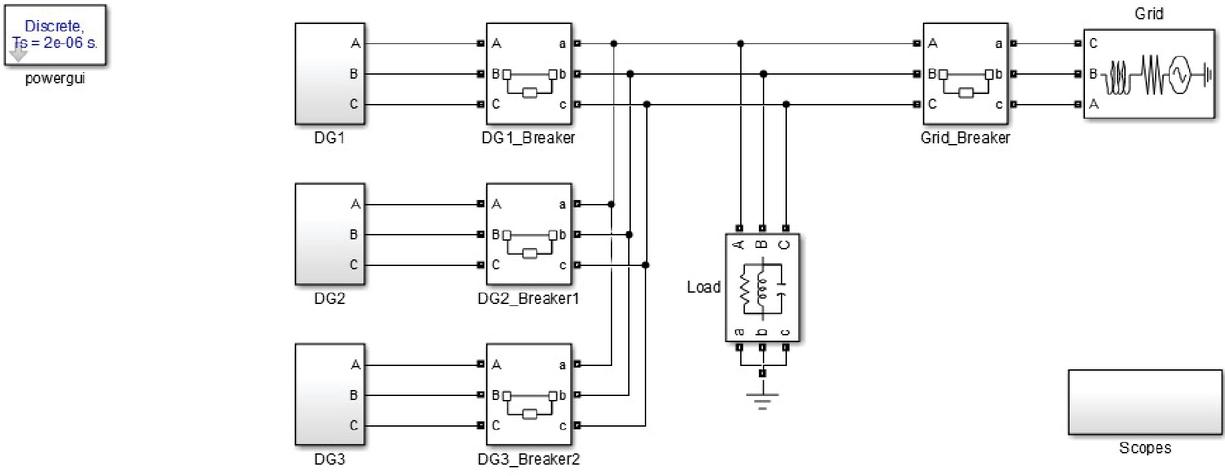
Figure 11 MATLAB/SIMULINK model of studied DGS with three inter-connected DGs for different case studies.
Table 4 Parameters of multi-DG-test-system and three-phase load during different loading conditions
| DG1 | DG2 | DG3 | |||||||
| DG | 3- AC, 25KV, | 3- AC, 50KV, | |||||||
| Parameters | 10MVA, 50Hz | 3MVA, 50Hz | DC, 2KV | ||||||
| Switching frequency (KHz) | 1.98 | 2.00 | 1.98 | ||||||
| Grid | 13.8 KV, 40MVA, 50Hz | ||||||||
| Loading conditions | Balanced | Unbalanced | Nonlinear | ||||||
| Load Branch Parameters | Phases | Phases | Phases | ||||||
| A | B | C | A | B | C | A | B | C | |
| Resistance, R () | 76 | 76 | 76 | 76 | 111.9 | 62.8 | 80 | 80 | 80 |
| Inductance, L (mH) | 111.9 | 111.9 | 111.9 | 876 | 111.9 | 72.86 | — | — | — |
| Capacitance, C (F) | 62.86 | 62.86 | 62.86 | 1576 | 223.8 | 42.86 | 6 | 6 | 6 |
| three-phase-diode-bridge rectifier present | — | — | — | — | — | — | Yes | Yes | Yes |
5.3 Case-1 (Balanced RLC-load)
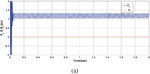
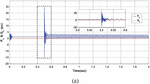
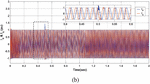
The studied system is verified using known balanced RLC-load whose parameters are given in Table 4. In this case, the controller of the studied system can adjust its real and reactive powers. For this, the initial reference values of real and reactive powers are set to V pu and V pu.
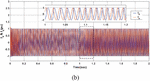
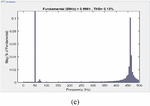
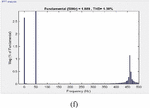
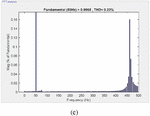
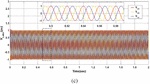
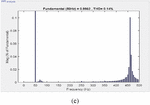
The active and reactive powers of load P and Q for this balanced loading case are shown in Figure 12(a). The dq-axes currents I and I are shown in Figure 12(b). The load voltage and current waveforms are shown in Figure 12(c) and (d) respectively. In these figures, all the waveforms are seen to be a little distorted in transient period and settled with in 10 msecs. For, further verification, FFT analysis of these waveforms has been done as given in Figure 12(e) and (f). From these FFT analysis, it is found that the THD of the load voltage and current are 0.12% and 1.38% respectively. Therefore, it is verified that the output waveforms for the multi-DG-test-system with the proposed controller are settling quickly with very less transient distortion in balanced loading condition.
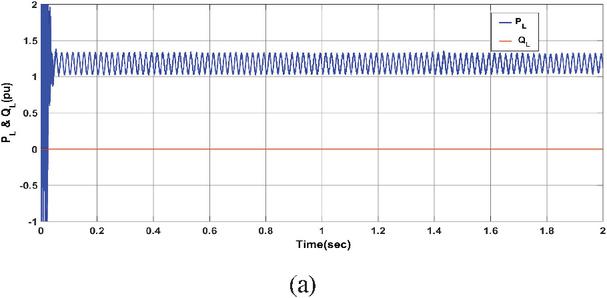
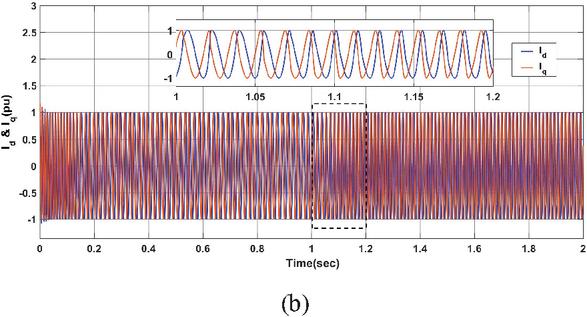
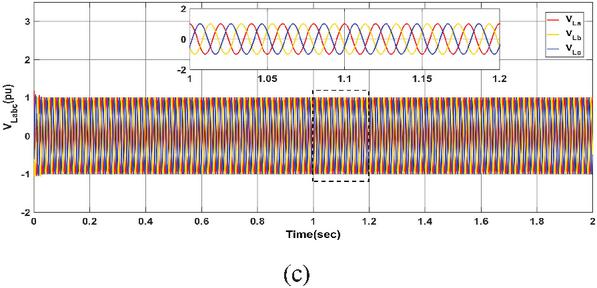
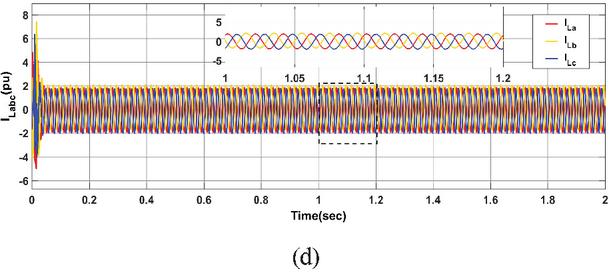
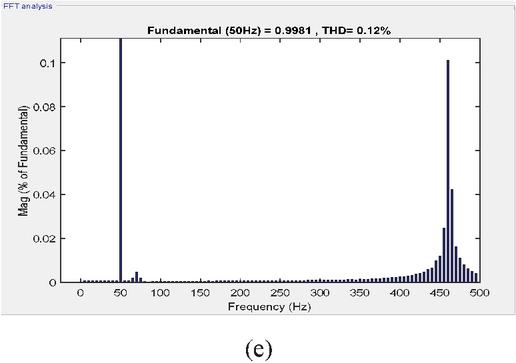
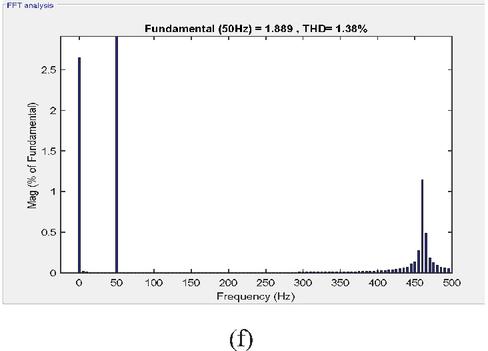
Figure 12 Output waveforms from the studied DGS for case-1 showing (a) Real and Reactive Power at Load Point or PCC Point, (b) dq-axes Currents, (c) load voltage waveform, (d) load current waveform, (e) FFT analysis of load voltage and (c) FFT analysis of load current.
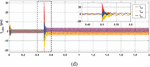
Case-2 (Unbalanced RLC-load)
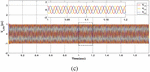
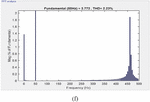
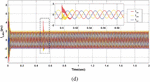
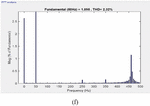
In this case, a three-phase unbalanced RLC-load whose parameters shown in Table 4 is attached parallel to the existing balanced load at 0.5 secs. The reference signals of the DG 1 and DG 3 are set to V pu and V pu. The waveforms of P and Q for this unbalanced loading case are shown in Figure 13(a). From this figure, it can be seen that Q has no disturbances whereas P is recovering within 25 msecs after the attachment of unbalanced load. Similarly, the dq-axes currents I and I are shown in Figure 13(b). Here, also the recovery time is less than 25 msecs. Further, the load voltage and current waveforms are shown in Figure 13(c) and (d) respectively. In these figures, the load voltage and current waveforms are seen to having controllable peak-overshoot in transient period and settled with in 25 msecs. For, further verification, FFT analysis of these waveforms has been done as given in Figure 13(e) and (f). From these FFT analysis, it is found that the THD of the load voltage and current are 0.23% and 2.23% at settling time respectively. Therefore, it is validated that the output waveforms for the multi-DG-test-system with the proposed controller are settling quickly with very less transient distortion in unbalanced loading condition also.
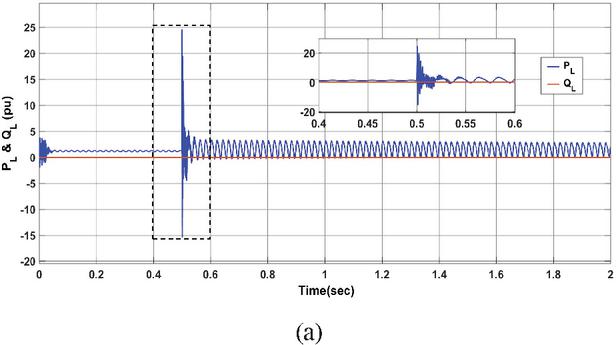
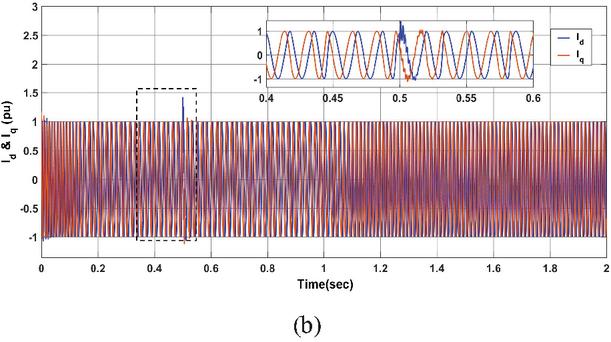
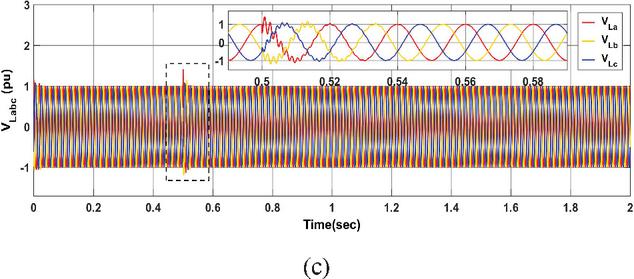
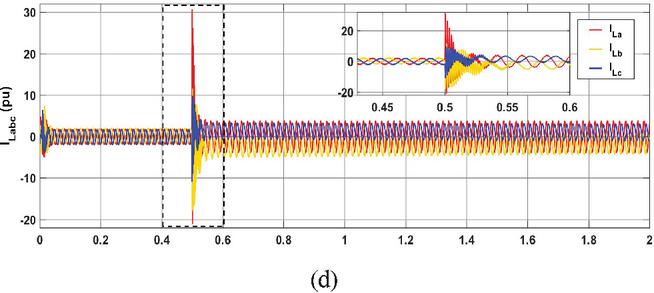
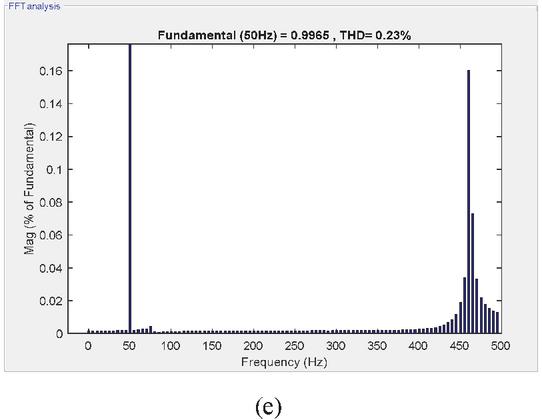
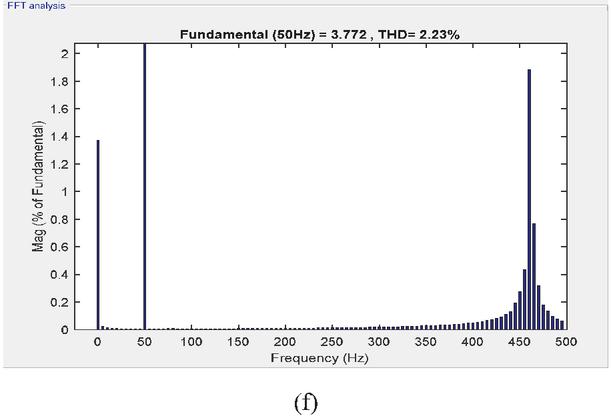
Figure 13 Output waveforms from the studied DGS for case-2 showing (a) Real and Reactive Power at Load Point or PCC Point, (b) dq-axes Currents, (c) load voltage waveform, (d) load current waveform, (e) FFT analysis of load voltage and (c) FFT analysis of load current.
5.4 Case-3 (Inclusion of Nonlinear Load Parallel to Balanced RLC-load of Case-1 at 0.5 secs)
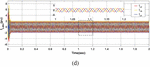
In this case, the considered nonlinear load is a three-phase-diode-bridge rectifier combined to a RC-load as given in Table 4. The dq-voltage reference signals V and V of the DG 1 and DG 2 are initially set to 0.6 pu and 0.8 pu respectively. The results for this loading conditions are shown in Figure 14. The waveforms of P and Q for this unbalanced loading case are shown in Figure 14(a). From this figure, it can be seen that P and Q has no disturbances whereas P is recovering within 30 msecs after the attachment of unbalanced load. Similarly, the dq-axes currents I and I are shown in Figure 14(b). Here, also the recovery time is less than same 30 msecs. Further, the load voltage and current waveforms are shown in Figure 14(c) and (d) respectively. In these figures, the load voltage and current waveforms are seen to having peak-overshoot within control limit during transient period and settled with in 20 msecs.
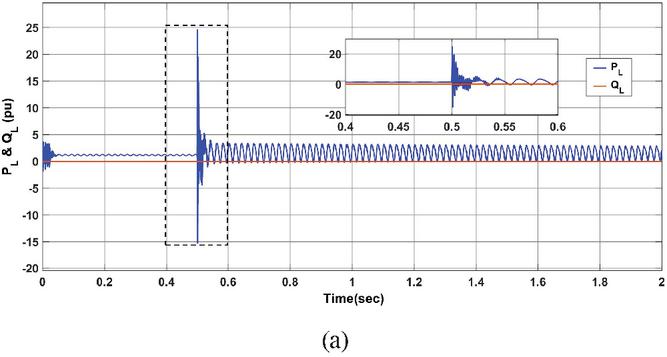

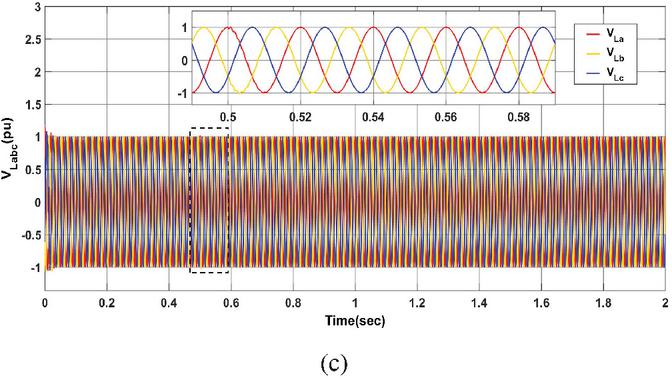
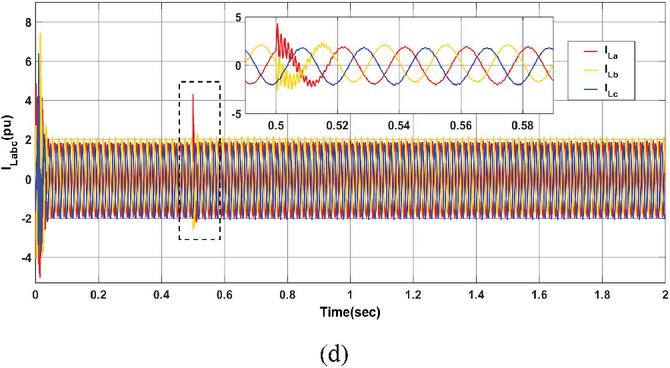
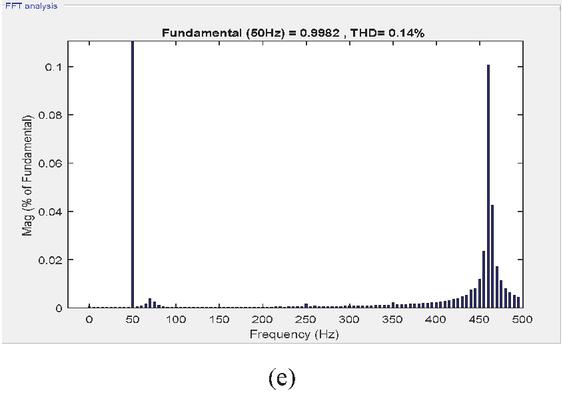
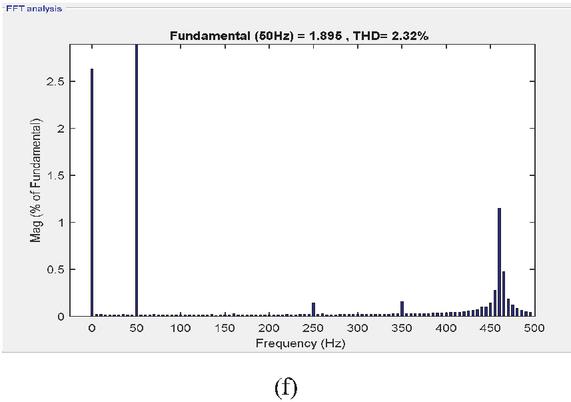
Figure 14 Output waveforms from the studied DGS for case-3 showing (a) Real and Reactive Power at Load Point or PCC Point, (b) dq-axes Currents, (c) load voltage waveform, (d) load current waveform, (e) FFT analysis of load voltage and (c) FFT analysis of load current.
For, further verification, FFT analysis of these waveforms has been done as given in Figure 14(e) and (f). From these FFT analysis, it is found that the THD of the load voltage and current are only 0.14% and 2.32% at settling time respectively. Therefore, it is again validated that the output waveforms for the multi-DG-test-system with the proposed controller are settling quickly with very less transient distortion in nonlinear loading condition also.
Output results of the studied test system with the proposed controller for different loading conditions i.e.; balanced, unbalanced and nonlinear are listed in Table 5. From the table, it can be observed that, for all cases the voltage and current signals recovers very quickly without high surge or swell. The THD values for load current in all the cases are also within admissible limits
Table 5 Comparison of results of the studied multi-DG-test-system with proposed optimal controller for different three-phase loading conditions
| Loading Conditions | |||
| Parameters | Balanced | Unbalanced | Nonlinear |
| P(pu) | 1.2 | 1.2 | 1.2 |
| Q(pu) | 0 | 0 | 0 |
| V(pu) | 0.6 | 0.6 | 0.6 |
| V(pu) | 0 | 0.8 | 0.8 |
| Switching time (sec) | 0.0 | 0.5 | 0.5 |
| Recovery time (msec) | 10 | 25 | 20 |
| THD of load voltage (%) | 0.12 | 0.23 | 0.14 |
| THD of load current (%) | 1.38 | 2.23 | 2.32 |
6 Conclusion
In the paper, an optimal controller-based islanding detection scheme is presented. In this proposed scheme, generation of both active and reactive power simultaneously under constant power control is possible. For checking working of proposed islanding detection scheme, an inverter-based single DG test system is used. In the proposed islanding detection algorithm, five test cases with different variation in voltage and deviation active power are considered. With analysis of these case studies, a reactive power control strategy is formulated to solve the problem of NDZ and effective and quick detection of islanding condition. From the analysis it is again found that the frequency deviation caused by both active and reactive power mismatches results in fastest islanding detection compared to other test cases. This paper further presents an optimal controller for support in the work of islanding detection. The controller is an optimal modified H-based controller. Here, the control parameters are tuned by a modified LMI algorithm. To check efficacy of the new detection scheme with proposed optimal controller, a multi-DG-test-system have been used. For testing this proposed controller, three loading conditions are considered such as balanced, unbalanced and highly non-linear and unbalanced. It is observed that the increase in protection schemes in the system improvises the system islanding detection.
References
[1] Zeng, Z., Yang, H., Zhao, R. and Cheng, C., 2013. Topologies and control strategies of multi-functional grid-connected inverters for power quality enhancement: A comprehensive review. Renewable and Sustainable Energy Reviews, 24, pp. 223–270.
[2] Ghzaiel, W., Ghorbal, M.J.B., Slama-Belkhodja, I. and Guerrero, J.M., 2017. Grid impedance estimation based hybrid islanding detection method for AC microgrids. Mathematics and Computers in Simulation, 131, pp. 142–156.
[3] Sumathi, S., Kumar, L.A. and Surekha, P., 2015. Grid Integration Techniques in Renewable Energy Systems. In Solar PV and Wind Energy Conversion Systems (pp. 471–544). Springer, Cham.
[4] Mishra, M., Chandak, S. and Rout, P.K., 2019. Taxonomy of Islanding detection techniques for distributed generation in microgrid. Renewable Energy Focus, 31, pp. 9–30.
[5] Kim, M.S., Haider, R., Cho, G.J., Kim, C.H., Won, C.Y. and Chai, J.S., 2019. Comprehensive review of islanding detection methods for distributed generation systems. Energies, 12(5), p. 837.
[6] Makkieh, A., Florida-James, A., Tzelepis, D., Emhemed, A., Burt, G., Strachan, S. and Junyent-Ferre, A., 2019. Assessment of passive islanding detection methods for DC microgrids.
[7] Seong-Cheol, K., Ray, P. and Salkuti, S.R., 2020. Islanding detection in a distribution network with distributed generators using signal processing techniques. International Journal of Power Electronics and Drive Systems, 11(4), p. 2099.
[8] Dubey, R., Popov, M. and Samantaray, S.R., 2018. Transient monitoring function-based islanding detection in power distribution network. IET Generation, Transmission & Distribution, 13(6), pp. 805–813.
[9] Mlakiæ, D., Baghaee, H.R. and Nikolovski, S., 2018. Gibbs Phenomenon-Based Hybrid Islanding Detection Strategy for VSC-Based Microgrids Using Frequency Shift, , and . IEEE Transactions on Smart Grid, 10(5), pp. 5479–5491.
[10] Dutta, S., Sadhu, P.K., Reddy, M.J.B. and Mohanta, D.K., 2018. Shifting of research trends in islanding detection method-a comprehensive survey. Protection and Control of Modern Power Systems, 3(1), pp. 1–20.
[11] Rostami, A., Abdi, H., Moradi, M., Olamaei, J. and Naderi, E., 2017. Islanding detection based on ROCOV and ROCORP parameters in the presence of synchronous DG applying the capacitor connection strategy. Electric Power Components and Systems, 45(3), pp. 315–330.
[12] Paiva, S.C., de Araujo Ribeiro, R.L., Alves, D.K., Costa, F.B. and Rocha, T.D.O.A., 2020. A wavelet-based hybrid islanding detection system applied for distributed generators interconnected to AC microgrids. International Journal of Electrical Power & Energy Systems, 121, p. 106032.
[13] Li, Y., Lu, N., Wang, X. and Jiang, B., 2019. Islanding fault detection based on data-driven approach with active developed reactive power variation. Neurocomputing, 337, pp. 97–109.
[14] Chen, X., Wang, X., Jian, J., Tan, Z., Li, Y. and Crossley, P., 2019. Novel islanding detection method for inverter-based distributed generators based on adaptive reactive power control. The Journal of Engineering, 2019(17), pp. 3890–3894.
[15] Manikonda, S.K. and Gaonkar, D.N., 2019. Comprehensive review of IDMs in DG systems. IET Smart Grid, 2(1), pp. 11–24.
[16] Reddy, C.R. and Reddy, K.H., 2017. Islanding detection method for inverter based distributed generation based on combined changes of ROCOAP and ROCORP. International journal of pure and applied mathematics, 117(19), pp. 433–440.
[17] Torres, A.P., Roncero-Sanchez, P. and Batlle, V.F., 2017. A two degrees of freedom resonant control scheme for voltage-sag compensation in dynamic voltage restorers. IEEE Transactions on Power Electronics, 33(6), pp. 4852–4867.
[18] Sedghi, L., Emam, M., Fakharian, A. and Savaghebi, M., 2018. Decentralized control of an islanded microgrid based on offline model reference adaptive control. Journal of Renewable and Sustainable Energy, 10(6), p. 065301.
[19] Kumar, N.K. and Indragandhi, V., 2018. Analysis on various optimization techniques used for load frequency control in power system. Serbian Journal of Electrical Engineering, 15(3), pp. 249–273.
[20] Kaviani, K., Menhaj, M.B. and Fakharian, A., 2018, November. Mixed State-Feedback Control for Islanded DC Microgrids: An LMI Based Approach. In 2018 Smart Grid Conference (SGC) (pp. 1–6). IEEE.
[21] Raeispour, M., Atrianfar, H., Baghaee, H.R. and Gharehpetian, G.B., 2020. Distributed LMI-based control of heterogeneous microgrids considering fixed time-delays and switching topologies. IET Renewable Power Generation, 14(12), pp. 2068–2078.
[22] Murugesan, S. and Murali, V., 2018. Hybrid analyzing technique based active islanding detection for multiple DGs. IEEE Transactions on Industrial Informatics, 15(3), pp. 1311–1320.
[23] Andishgar, M.H., Gholipour, E. and Hooshmand, R.A., 2017. An overview of control approaches of inverter-based microgrids in islanding mode of operation. Renewable and Sustainable Energy Reviews, 80, pp. 1043–1060.
[24] Bullich-Massagué, E., Díaz-González, F., Aragüés-Peñalba, M., Girbau-Llistuella, F., Olivella-Rosell, P. and Sumper, A., 2018. Microgrid clustering architectures. Applied energy, 212, pp. 340–361.
[25] Shrivastava, S., Jain, S., Nema, R.K. and Chaurasia, V., 2017. Two level islanding detection method for distributed generators in distribution networks. International Journal of Electrical Power & Energy Systems, 87, pp. 222–231.
Biographies

Bineeta Soreng, received the M.Tech degree in Electronics and Communication Engineering in 2013 from National Institute of Technology, Rourkela, India and B.Tech degree from College of Engineering and Technology, Bhubaneswar, Odisha in Electrical Engineering in 2010. She is currently working as an Assistant Professor in the Department of Electrical Engineering, Veer Surendra Sai University of Technology, Burla, India Her research interests include distributed generation and its islanding detection techniques and power electronics.

Raseswari Pradhan was born in Bargarh, Odisha, India. She got her Ph.D. degree in control system engineering from National Institute of Technology, Rourkela, India in 2014. She got her B.E. and M.E. degrees in electrical engineering from I.G.I.T., Sarang, Utkal University, Odisha and Jadavpur University, Kolkata, respectively. She has served as faculty in some of the renowned Technical colleges and universities like NIST Berhampur, KIIT Bhubaneswar etc. Currently she is serving as an Assistant Professor in the Department of Electrical Engineering, Veer Surendra Sai University of Technology, Burla, India. She has research publications in various reputed journals, book chapters and conference proceedings. Till the date, she has guided several M.Tech. and B.Tech. research scholars. Now in year 2021, four Ph.D. scholars and two M.Tech. scholars are working under her guidance. Her research interests include control, renewable energy and microgrid stability and industrial Electronics.
Distributed Generation & Alternative Energy Journal, Vol. 36_2, 169–202.
doi: 10.13052/dgaej2156-3306.3625
© 2021 River Publishers