Comparison of Hour-to-Hour and Hour-Block Energy Trading for Networked Microgrids to Optimize Profits
Lokesh Vankudoth* and Altaf Q. H. Badar
Department of Electrical Engineering, National Institute of Technology Warangal, Warangal, Telangana, 506004, India
E-mail: vlokesh@student.nitw.ac.in
*Corresponding Author
Received 18 December 2021; Accepted 18 February 2022; Publication 29 April 2022
Abstract
Networked Microgrids are a concept that emerged as a result of growing microgrid deployments in the distribution network. Microgrids in close geographical or electrical proximity are coupled to build networked microgrids. Networked microgrids offer coordinated energy management, as well as interaction and energy exchange across microgrids. This increases the reliability of microgrids and lowers their running costs. Hour-to-hour, depending on generation and load profiles, Time-of-Use pricing, microgrids can manage energy inside the microgrid and participate in energy trading with linked microgrids to reduce costs. Demand response is also utilized in energy management to achieve the above objectives. In contrast to the preceding hour-to-hour strategy, a unique hour-block-based demand response program in Networked Microgrids is suggested in this paper. In this paper, in contrast, to the above hour-to-hour approach a novel hour block-based demand response program in Networked Microgrids is proposed. Each hour block is formed based on generation and load imbalance, the role of Microgrids and the Time-of-Use tariff system. Both techniques are evaluated in terms of time and complexity using the Particle Swarm Optimization method. The economic benefits of individual microgrids and networked microgrids are also compared.
Keywords: Networked microgrid, energy trading, particle swarm optimization, demand response, renewable energy sources, time-of-use-tariff.
Acronyms
| t | Hour block. |
| B | Set of buyer MGs. |
| S | Set of seller MGs. |
| N | Total number of MGs. |
| b | Buyer MG. |
| s | Seller MG. |
| v | Velocity of Particle. |
| x | Particle position. |
| Particle best position. | |
| Global best position. | |
| Load in during t. | |
| Actual total load in for whole day. | |
| Excess energy generated in during t. | |
| Deficit energy in during t. | |
| Grid selling tariff during t. | |
| Grid buying tariff during t. | |
| NMG energy selling tariff during t. | |
| NMG energy buying tariff during t. | |
| Energy generated in during t in NE-zone. | |
| Load demand in during t in NE-zone. | |
| Energy sold by seller to NMG during t. | |
| Energy bought by buyer from NMG during t. | |
| Total Energy bought by from grid during NE zone. | |
| Total Energy bought by NMG from grid during NE zone. | |
| Energy sold by seller to grid during t. | |
| Energy bought by buyer from grid during t. | |
| Cost incurred to buyer during t. | |
| Profit earned by seller during t. | |
| Total cost incurred to during NE zone. | |
| Total cost incurred to NMG during NE zone. | |
| Total cost incurred to all buyer during t. | |
| Total profit earned by all seller during t. | |
| Total cost for during whole day. | |
| Total cost for NMG during whole day. |
1 Introduction
Distributed Energy Resources (DERs) effectuate is unrivaled recently in the power system to improve resource utilization, increase security, maximize technical, economic advantages and reduce the carbon footprint. The implementation of DERs allows prosumers to actively participate in the market, but the installation of DERs brings technical challenges to the present system. The Microgrid (MG) concept is introduced to effectively integrate DERs in the distribution system. MG within a fixed electrical boundary, allow wide-range integration of DERs with control and operational functions to supply loads. They can operate in both islanded and grid-connected modes. This increases the reliability and benefits in emergency and normal operating condition. The MG acts as a single controllable entity according to the grid with fixed electrical boundaries. The MG provides several advantages to the network as minimized network losses, improved reliability, power quality and minimized investment costs. But the MGs must be able to maintain voltage and frequency in both the operating modes.
With the developments and increased installations of MGs, the concept of interconnecting MGs and forming a Networked Microgrid (NMG) framework is proposed to utilize the full potential of MGs. The NMG framework allows for better utilization of Renewable Energy Sources (RES), increase profits of MGs through trading energy with other MGs, reducing the investment costs, enhancing environmental sustainability and improving the operational aspects like voltage regulation, frequency and reliability [1]. The energy trading in NMGs is performed, if there exist one or more MGs with excess energy and deficit energy. The MGs can be benefitted from implementing Demand Side Management (DSM) along with energy trading among MGs because of their dependence on the RES and Battery Energy Storage System (BESS). Among the DSM techniques, Demand Response (DR) gained popularity in NMG energy management. The DR techniques are classified as price-based and incentive-based DR programs [2]. In the price-based DR method, the loads are shifted based on price signals. In the incentive-based DR method, the consumers are given the incentive to shift the load and or supply more load into the network according to network requirements.
In literature, the application of DR programs for energy management is studied. In [3], the impact of DR intensity and BESS size on the MG cost, trading among MGs, power transfer to loads in MGs and BESS charging is studied. In this, for the NMG framework, both price-based and incentive-based DR methods are considered. The proposed methodology increased the amount of internal trading among MGs, reduced the external energy trading with grid and operational costs. An Energy Management System (EMS) for optimal scheduling of MGs is proposed in [4], where time-based DR is utilized. The time-based DR proposed is based on microeconomics, where load shifting depends on the price differentiated as single price model and multi-sensitivity model. A survivability-oriented DR program is proposed based on the generation and load level in MG [5]. The proposed method depends on the ratio of critical loads and non-critical loads, shiftable loads and fixed loads. This is applied for isolated MGs interconnected with each other. In [6], Real-Time Price (RTP) based DR is applied for NMGs to increase the reliability of the system.
Time-based DR is applied in NMG for reconfiguration of MGs in the distribution network and determining the states of interconnecting switches between MGs and the grid [7]. A step-wise DR program is applied in bi-level EMS proposed for isolated NMG framework [8]. The step-wise DR program here depends upon a stepwise price-demand curve. The application of the DR program minimizes the total cost of NMG and individual MGs. In [9], an incentive-based DR approach is applied to a cooperative-based approach to determine market transactions and the energy trading price of NMGs. A price-based DR is proposed along with adjustable power for NMG [10], to minimize the cost for MGs. In [11], also price-based DR program is included in EMS for NMG to minimize the cost, reduce dependence on the main grid along with other objectives. Two DR programs, time-based and incentive-based DR programs are proposed for networked multi-carrier networked microgrids to improve flexibility and minimize costs [12]. In [13], a hybrid machine learning algorithm based on adaptive neuro-fuzzy inference system (ANFIS), multilayer perceptron (MLP) artificial neural network (ANN), and radial basis function (RBF) ANN has been proposed for forecasting required parameters in residential prosumer MGs. The forecasted load and generation data are utilized for developing a price-based DR program considering BESS degradation for minimizing operational costs. For residential prosumers, considering 2-level corrective forecasting, the cost for purchasing energy from the grid and BESS degradation cost is minimized [14]. A bi-level problem is proposed for optimal operation of multi microgrids (MMGs) while considering the impact of price-based DR, but the energy trading among MGs is absent [15]. The objective of both lower-level and upper-level problems is to minimize the operation costs of individual MGs and utility. A multi-step hierarchical optimization algorithm based on the multi-agent method (MAS) is proposed in [16] to minimize the operating costs considering price based-DR program. The MILP model is used to model and solve the optimization problem.
The literature mentioned above considers an hour-to-hour DR approach which depends on the generation of DGs, BESS, load and price signals from the grid. In this paper, we propose a novel hour-block method to reduce the complexity and amount of time required for the application of the DR program in the NMG framework. The proposed methodology also considers the time-based DR approach but we form hour-blocks based on generation and load imbalance, Time-of-Use (TOU) prices and the role of MGs in the NMG environment in comparison to the literature presented. The proposed method reduces the complexity of the DR problem by reducing the 24 hours optimization approach to a 6-block optimization approach. For this, we give a comparison between the hour-to-hour energy trading and hour-block-based energy trading with DR in NMGs. The NMGs objective is to reduce the operating costs of individual MGs and the dependence on the grid by trading energy among the MGs. For this, the MGs are considered to be interconnected with each other and also connected to the grid. A deterministic approach is considered, with the RES and load values to be constant. Particle Swarm Optimization (PSO), a heuristic method is applied after modelling the problem as an optimization problem, such that customers and the MGs in NMG are satisfied.
This paper is organized into 5 sections, where in the first section the NMGs are introduced and the NMG topology, operating strategy are given in Section 2. PSO is explained in detail in Section 3. Section 4 describes the problem formulation of the problem mentioned and the application of the process proposed. Section 5 contains a detailed comparison of the hour-to-hour and hour-block-based methods findings for minimizing NMG costs and individual MGs. Finally, this study is concluded in Section 6.
2 Networked Microgrids
NMGs are a cluster of MGs i.e., having physical interconnection among two or more MGs and exchanging energy among MGs. In addition to the exchange of energy among MGs, MGs can also trade with the grid. An MG can be ac type or dc type based on the generation type. The NMG framework allows both types of MGs to be connected and also interchange energy. Figure 1 below shows an example topology of the NMG system. Each MG in an NMG has a Microgrid Operator (MGO), who is responsible for managing energy in the MG. The MGO is also responsible for sharing the information about excess/deficit in an MG with the NMG manager/ aggregator. The MGs with excess energy are defined as sellers and the MGs with deficit energy as buyers. The NMG manager/aggregator is responsible for collecting this information and allocating the energy from seller MGs to buyer MGs. Here, the NMG manager or aggregator is also responsible for determining prices for energy trading among MGs.

Figure 1 Topology of NMG system.
At a particular hour t, each MG in the NMG framework will generate power () based on the sources in MG to supply a load (). Depending on the environmental condition and the number of sources available in MG, sometimes in an MG, then the respective MG acts as a seller for that hour t. The seller MGs are assigned as set ‘S’ as in Equation (1). When, for an MG, then the respective MG functions as a buyer for the same corresponding hour t. The buyer MGs are assigned to a set ‘B’ as in Equation (2). The seller MG, after supplying the corresponding load is left with excess energy as in Equation (3). The buyer MG, after receiving energy from its corresponding generation requires additional energy given as Equation (4). The surplus energy with seller MGs in ‘S’ is exchanged with buyers MGs in ‘B’. At the corresponding hour t, if the excess energy with seller MGs is more than the energy required by buyer MGs, it is sold to the grid. Also, if the energy required by buyer MGs is more than the energy with seller MGs, it is bought from the grid.
| (1) | |
| (2) | |
| (3) | |
| (4) |
At an hour t, the TOU prices given by the grid are and . Where, is the price at which the grid sells energy to the customers and is the price which the grid pays for energy sold by the customer to the grid. While, trading energy among the MGs in the NMG framework, the price is in between the range of and . This influences the MGs to trade among them rather than with the grid. Because the price at which energy bought is lesser than the grid selling price and sold to MGs ( at a price greater than the grid buying price as shown in Equation (5). This allows MGs to optimize their profits. In case, this constraint is not satisfied, the MGs shall trade energy with the grid rather than other MGs and the objective of forming NMG for energy trading shall cease to exist.
| (5) |
3 Problem Formulation
Each MG is equipped with either Photo-Voltaic (PV) or wind generation in the NMG framework to supply power to the corresponding loads during each hour t. But, the variable and intermittent nature of RES create a power imbalance in the MGs. This allows for energy trading among the MGs or with the grid. This energy trading is performed based on the hour-to-hour approach in literature. Here, we propose the hour-block-based approach to reduce the complexity and time required as shown below.
3.1 Hour-to-Hour Trading Approach
In MGs, based on the amount of energy generated and utilized, they are classified as buyers and sellers as discussed. In each hour t, the amount of energy generated is calculated for each MG and the power imbalance is calculated to determine the buyers and sellers as given in Equations (3) and (4). The excess energy and deficit energy information is collected by the NMG manager and is responsible to distribute the energy among the MGs based on the proportional approach as discussed below. The NMG also decides the trading prices among the MGs satisfying Equation (5). Along with, energy trading the MGs can also benefit by shifting the loads from one hour to other hours. The amount of load shift is limited by 20% as given in Equation (6) and the total load in a day must be satisfied as in Equation (7) [17].
| (6) | |
| (7) |
While, trading energy among MGs two conditions arise in the NMGs,
1. The total amount of excess energy is greater than or equal to the deficit energy, called excess energy generation.
2. The total amount of excess energy is less than deficit energy, called excess demand.
3.1.1 Excess energy generation
In this case, the excess energy of seller MGs is greater than or equal to the demand of buyer MGs in the NMG framework. The price at which this energy is decided by the NMG manager as in Equation (5). The energy sold by NMG manager from seller MGs to buyer MGs follows a proportional approach as in Equation (8).
| (8) |
If any excess energy remains after proportional trading, is exchanged with the grid as in Equation (9).
| (9) |
The amount each buyer MG is to pay is given by Equation (10) and the total cost for all buyer MGs together is given by Equation (11).
| (10) | ||
| (11) |
The amount each seller MG gains is given in Equation (12). and the total amount gained by all seller MGs is given by Equation (13) respectively.
| (12) | |
| (13) |
3.1.2 Excess demand
In this, the energy demand of buyer MGs is more than the energy generated by seller MGs. The small amount of excess energy from seller-buyer MGs is obtained by buyer MGs from proportional trading and the remaining energy is obtained from the grid. The energy traded in the NMG framework is shown in Equation (14) and the remaining deficit energy is purchased from the grid as given in Equation (15).
| (14) | |
| (15) |
The amount to be paid by individual buyer MG and for all buyer MGs together are given in Equations (16) and (17).
| (16) | |
| (17) |
The amount earned by individual seller MG and by all seller MGs together is given by Equations (18) and (19).
| (18) | |
| (19) |
The total cost incurred to individual MGs and the NMG system for a whole day is given by Equations (20) and (21).
| (20) | |
| (21) |
During some hours, all the MGs could be acting as buyers and buy this energy from the grid as shown in Equation (22). The total cost incurred by NMG for buying this energy is given in Equation (23). Equations (24) and (25) represent the power purchased and the cost incurred by individual MGs.
| (22) | |
| (23) | |
| (24) | |
| (25) |
3.2 Hour-Block Energy Trading Approach
3.2.1 Formation of hour blocks
Different from the above hour-to-hour energy trade, to reduce dependence on utility network hour-block energy trading, based on the generation and load profiles of MGs, two zones are defined: Excessive zone (E-zone) and Non-Excessive zone (NE-zone). In E-zone, energy generated by any of the MGs is more than the load of corresponding MGs in the NMG environment. Conversely, in NE-zone, energy generated by all MGs in the NMG system is less than the load of that individual MG. In the proposed method, it is possible to have multiple E-zones and NE-zones. The NE-zone is further classified based on TOU prices i.e., during off-peak, intermediate and peak tariff periods, whereas the E-zone is divided based on TOU prices and the role of MGs as shown in Figure 2. The blocks cannot be merged or further split once created.
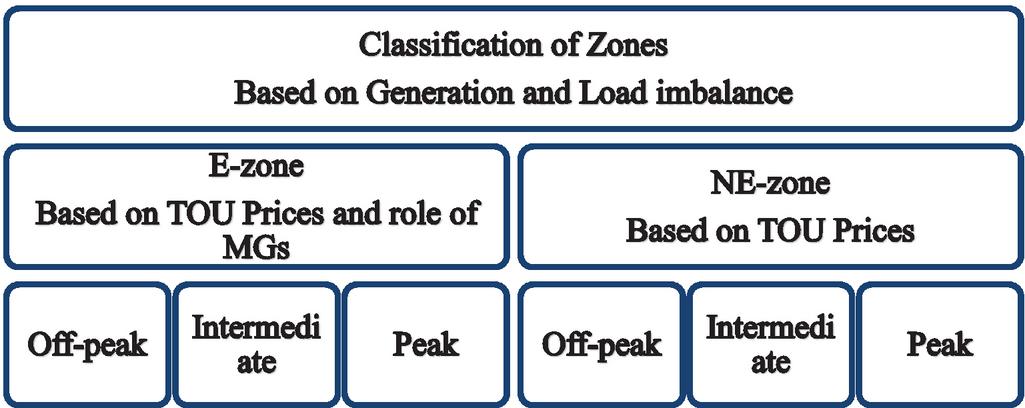
Figure 2 Classification of hour blocks.
So, there are no sellers in the NE-zone, whereas there can be sellers and buyers in the E-zone. The MGs can benefit from shifting the load from one zone to another zone i.e., DR program satisfying the constraint in Equation (6).
The electricity produced in the NE-zone is inadequate to meet the total load of MGs, the entire deficit of energy is purchased from the grid as in Equation (10). The total cost incurred for buying this energy is given in Equation (11). Equations (12) and (13) give the respective power purchased and cost incurred by individual MGs during the NE zones.
| (26) | |
| (27) | |
| (28) | |
| (29) |
In E-zone, the amount of energy generated is higher than the amount of load to be supplied in certain MGs. For a given E-zone there might arise the same two conditions as discussed above excess energy and excess demand. The NMG aggregator will follow the same proportional approach for trading energy among the MGs as in Sections 3.1.1 and 3.1.2. But the total incurred for the MGs and NMG system for a whole day is given by Equations (3.2.1) and (31).
| (31) |
Both the approaches hour-to-hour and hour-block based are implanted using PSO and compared.
4 Particle Swarm Optimization (PSO)
PSO is a population-based evolutionary technique developed for solving continuous non-linear equations [18]. The PSO algorithm was inspired by the social behaviour of animals like inspired by bird flocking, fish schooling, which works in groups to find optimal solution points [19]. PSO navigates through the search space based on the best position found individually and also the best position found by other particles. In PSO, particles are the simple entities that are placed in the search space of the problem and used to find the objective function at its position. The next iteration starts after all particles move from their initial position. PSO has three D-dimensional vectors, the current best position , previous best position and velocity . The current position is considered to be the solution in every iteration and it gives a point in space. If the position found is better than the positions in previous iterations it is stored in the previous best position . The current best position and previous best position are updated by adding the velocity to the current best position. As discussed, PSO works on the interaction among the particles, the position of the particle is affected by the best position found among all the particles in the neighbourhood called the global best position . The velocity is updated in each iteration such that the particle oscillates between the current best position and the global best position as given in Equation (32).
| (32) |
As in Equation (9), the position of the particle changes its location from one position to another position based on the velocity.
| (33) |
The inertia constant (), balance the global and local search for an optimal solution by maintaining its value constant or adjusting dynamically. A higher inertia value assists global search, while a lower value assists local search [20]. A constant inertia value is considered in this study. represents the exploration coefficient, as the exploitation coefficient and is instrumental in finding the global optimal solution. and are considered to be 2.05. Rand and rand are random functions generating a random value between 0 to 1.
4.1 Step-by-Step for Implementation of Proposed Method
(1) Input the values of RES generation, load and TOU prices of the NMG framework for given day.
(2) Determine the zones based on Section 3.
(3) Find the maximum and minimum load limits for each zone and obtain TOU prices for E-zone.
(4) Initialize the particles for loads and TOU prices, set population size, configure the algorithm parameters, number of iterations.
(5) Check if the particles are within limits and satisfy Equation (7).
(6) Solve the objective function, update the current particle position and best particle position as given in Section 3.
(7) According to Equations (32) and (33), update the velocity and particle position.
(8) Repeat steps 5 and 6.
(9) Solve the objective function, for updated particles.
(10) Check if the stopping criterion is reached, i.e., maximum number of iterations, if so, the solution is obtained. Otherwise, repeat step 7.
5 Results
For this study, a modified NMG framework given in [21] is considered, which consists of 4 MGs. Each MG is interconnected to the other and enables trading among MGs through the NMG manager. MG is a 6-bus system, MG is a 9-bus system, MG is an 18-bus system and MG is a 7-bus system respectively. Each MG is equipped with either PV or Wind or both, schedulable loads. The maximum limits of the energy generation in MGs are presented in Table 1. The combined RES generation for MGs for the 12th of February is shown in Figure 3. The load for 24 hours of the same day is as shown in Figure 4. In the system, the grid purchasing price, i.e., the price at which the grid buys energy from the NMG, is maintained at one-third of the grid selling price given by . The TOU prices for all hours of the day are shown in Figure 5. The price of the whole day is classified into 3 categories off-peak, intermediate and peak periods as summarized in Table 2.
The parameters considered for the implementation of the proposed problem are given in Table 3.
Table 1 Power generation limits [21]
| PV Limits (kW) | Wind Limits (kW) | ||||
| MG | Min | Max | Min | Max | Total (kW) |
| MG-1 | 0 | 6400 | 0 | 0 | 6400 |
| MG-2 | 0 | 5600 | 0 | 1300 | 6900 |
| MG-3 | 0 | 5600 | 0 | 1700 | 7300 |
| MG-4 | 0 | 6400 | 0 | 0 | 6400 |
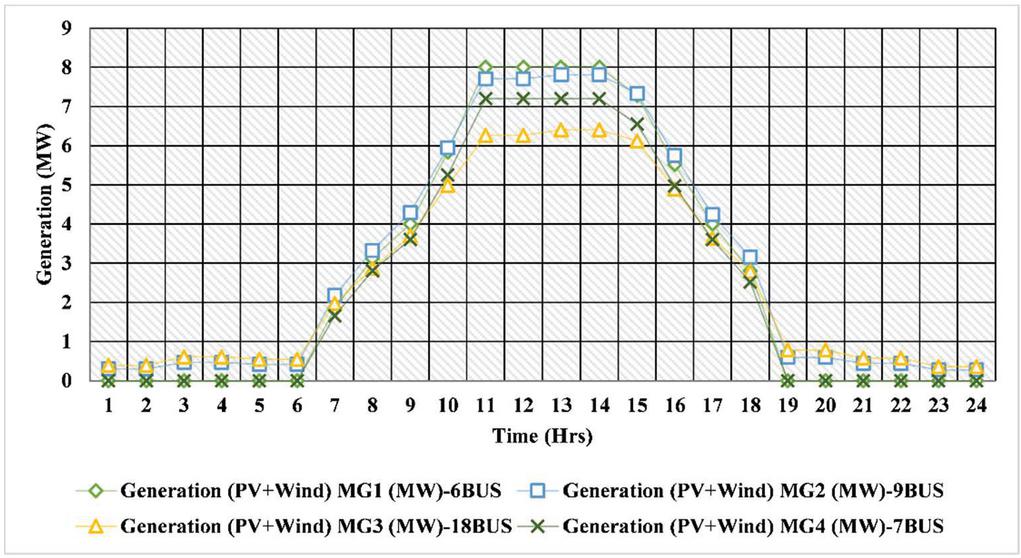
Figure 3 RES Generation in NMGs.
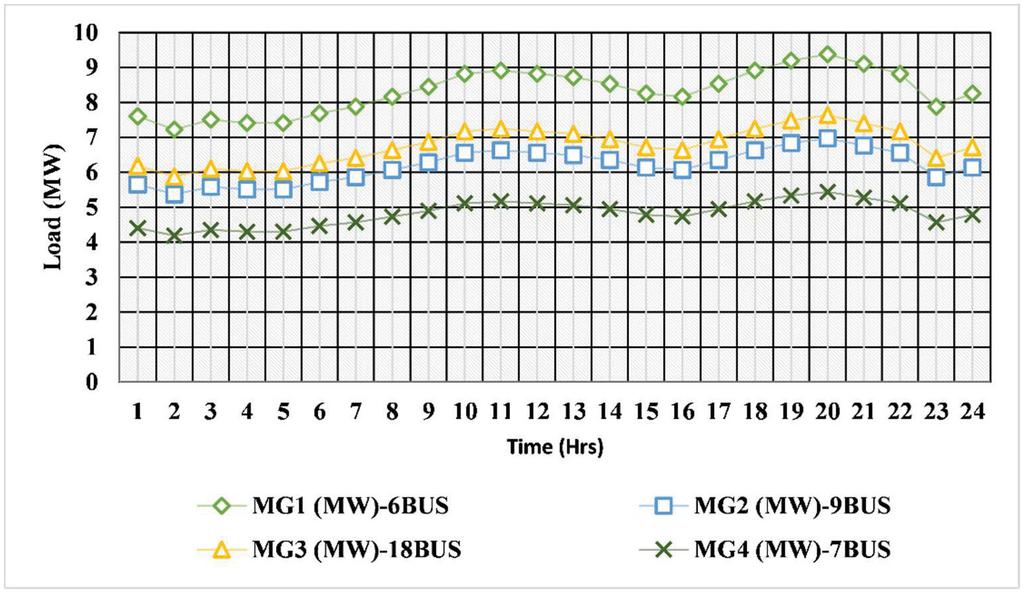
Figure 4 Load in NMGs.
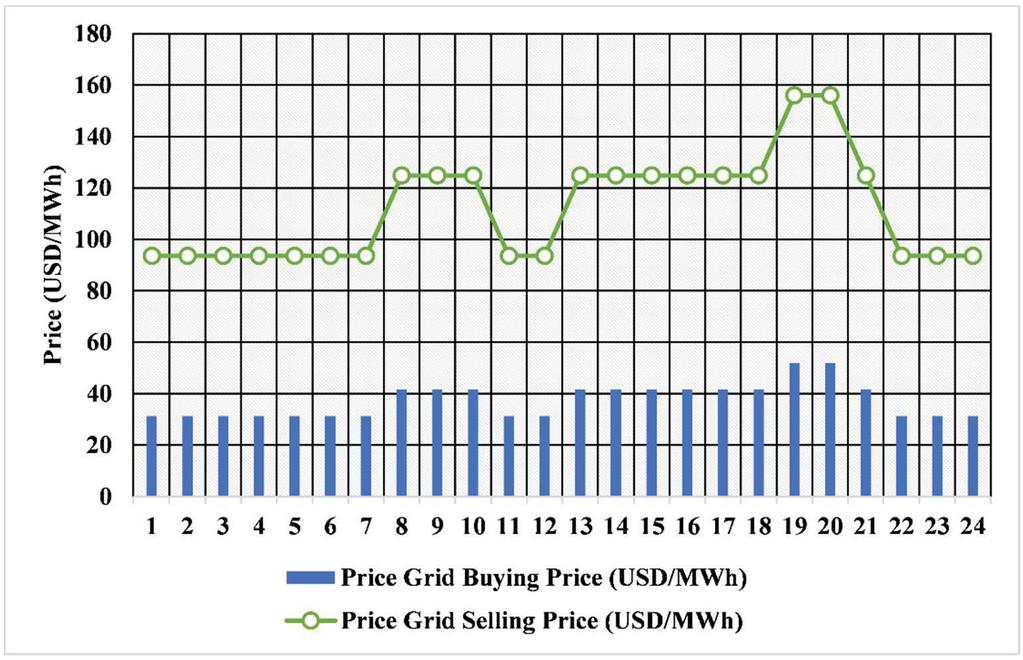
Figure 5 TOU Prices for NMGs.
5.1 Hour-to-Hour Trading Results
For the considered system, on performing hour-to-hour energy trading-based DR application as discussed in Section 3 the load is shifted as shown in Figure 6. For 24-hour the role of MGs is shown in Table 4. The energy trading price obtained for 24 hours between MGs is shown in Figure 7. The total combined cost of each MG for the whole day is MG: 14054.61 (USD/MWh), MG: 8339.865 (USD/MWh), MG: 10942.53 (USD/MWh) and MG: 6159.603 (USD/MWh) respectively. The total operating cost of the whole NMG system is 39410.07 (USD/MWh).
Table 2 TOU prices for the day and their classification
| Grid Selling | Grid Buying | ||
| Period | Time (Hrs) | Price (USD/MWh) | Price (USD/MWh) |
| Off-peak | 1–7, 11–12, 22–24 | 93.6 | 31.2 |
| Intermediate | 8–10, 13–18 and 21 | 124.8 | 41.6 |
| Peak | 19–20 | 156 | 52 |
Table 3 PSO parameters
| Topology | Values |
| Particles | 1000 |
| Iterations | 10 |
| 0.729 | |
| C | 2.05 |
| C | 2.05 |
| rand, Rand | between 0 and 1 |
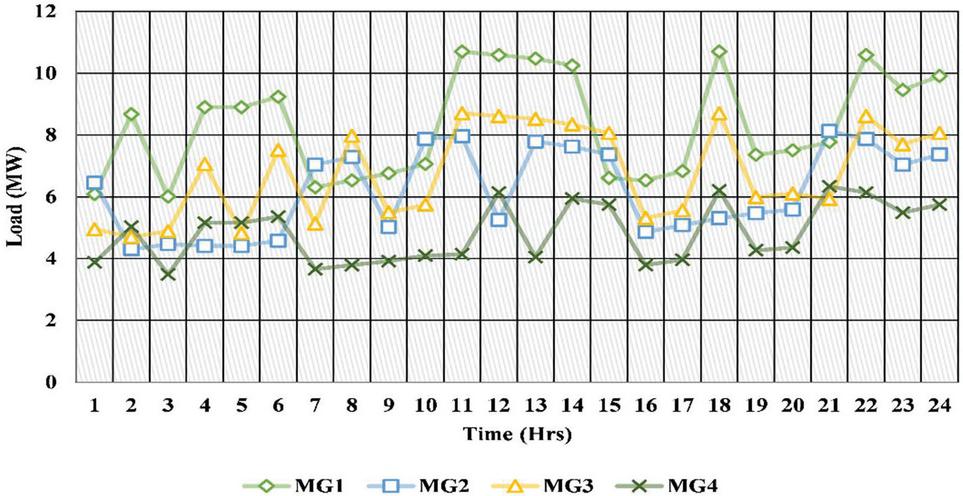
Figure 6 Load in NMGs for hour-to-hour based trading.
Table 4 Role of MGs for hour-to-hour energy trading
| MG1 | MG2 | MG3 | MG4 |
| Buyer | Buyer | Buyer | Buyer |
| Buyer | Buyer | Buyer | Buyer |
| Buyer | Buyer | Buyer | Buyer |
| Buyer | Buyer | Buyer | Buyer |
| Buyer | Buyer | Buyer | Buyer |
| Buyer | Buyer | Buyer | Buyer |
| Buyer | Buyer | Buyer | Buyer |
| Buyer | Buyer | Buyer | Buyer |
| Buyer | Buyer | Buyer | Buyer |
| Buyer | Buyer | Buyer | Seller |
| Buyer | Buyer | Buyer | Seller |
| Buyer | Seller | Buyer | Seller |
| Buyer | Seller | Buyer | Seller |
| Buyer | Seller | Buyer | Seller |
| Seller | Buyer | Buyer | Seller |
| Buyer | Seller | Buyer | Seller |
| Buyer | Buyer | Buyer | Buyer |
| Buyer | Buyer | Buyer | Buyer |
| Buyer | Buyer | Buyer | Buyer |
| Buyer | Buyer | Buyer | Buyer |
| Buyer | Buyer | Buyer | Buyer |
| Buyer | Buyer | Buyer | Buyer |
| Buyer | Buyer | Buyer | Buyer |
| Buyer | Buyer | Buyer | Buyer |
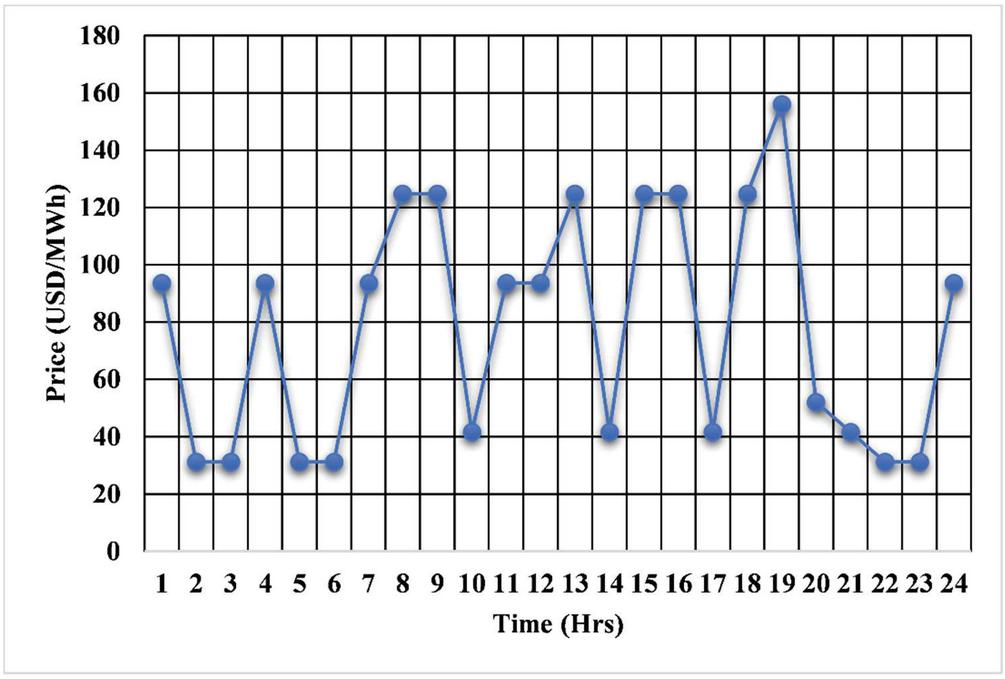
Figure 7 Energy trading prices among MGs in hour-to-hour trading.
PSO is run 40 times and the average amount of time taken for each iteration is 4.578602 seconds. The average and minimum for the objective function are 39674.19 (USD/MWh) and 39410.07 (USD/MWh). The standard deviation for 40 runs is 139.3305.
5.2 Hour Blocks Trading Results
The whole day is divided into 6 blocks based on their classification as Ezone or NE- zone as discussed above. Zone-wise distribution of generation and load is shown in Figures 8 and 9. The 6 zones obtained, consists of 3 NE-zones and 3 E-zones. During (1–7), (8–9), (17–18), (19–20), 21 and (22–24) hrs, all MGs require energy, so these hour blocks are assigned as NE-zones. MG has excess energy at 10 and 16 hrs, MG and MG generate excess energy at (11–12) and (13–15) and these hour blocks are considered as E-zones.
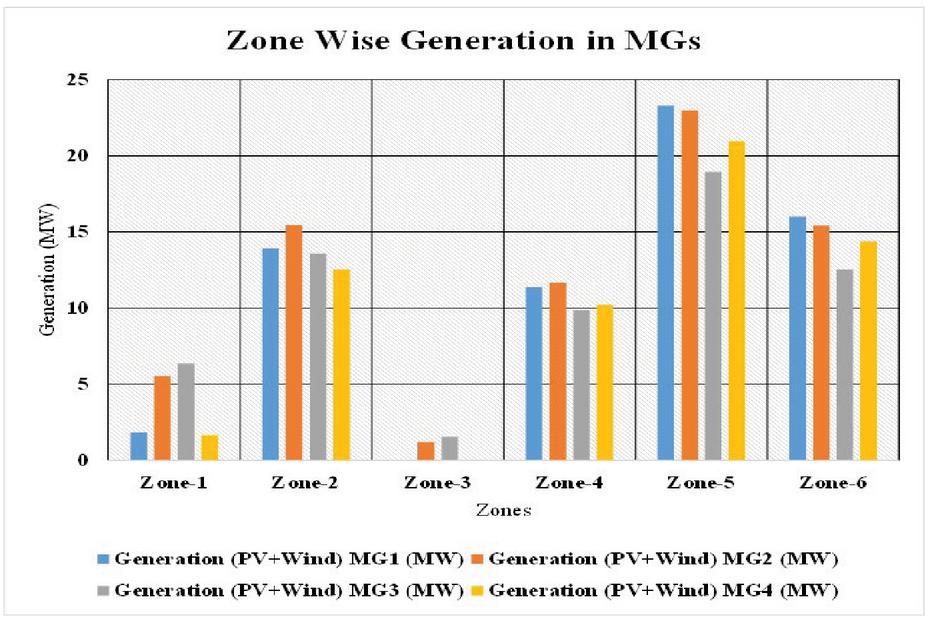
Figure 8 Zone wise generation in NMG.
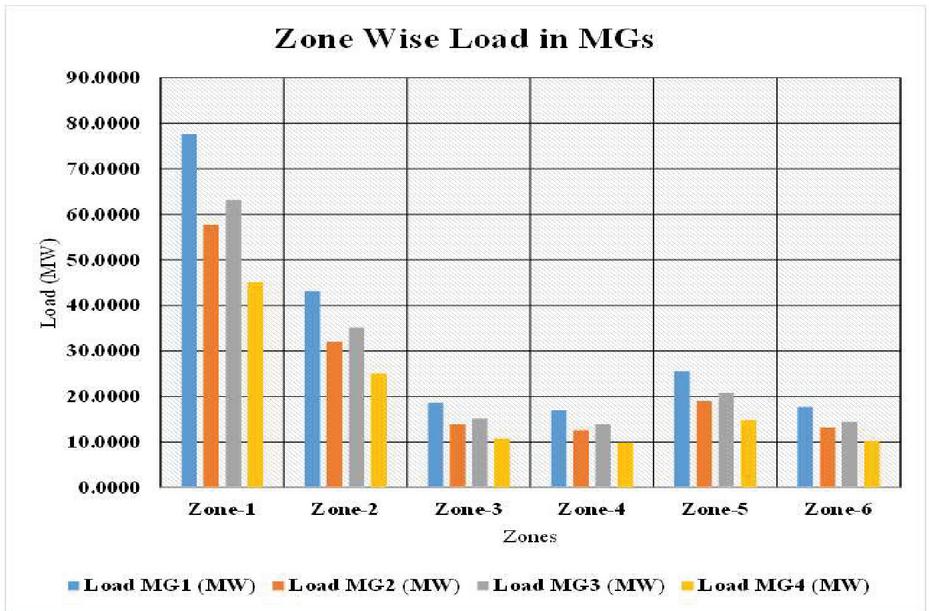
Figure 9 Zone wise load in NMG.
PSO is compiled for 40 times similar to the above case, then results are computed. The zone-wise loads of MGs in NMG based on the proposed method are shown in Figure 10. The role of each MG as a buyer or seller is dependent on the optimal load schedule obtained through PSO which is displayed in Table 5. The optimal costs for energy trading in E zones are obtained as 41.6 (USD/MWh), 41.6 (USD/MWh) and 93.6 (USD/MWh) respectively.
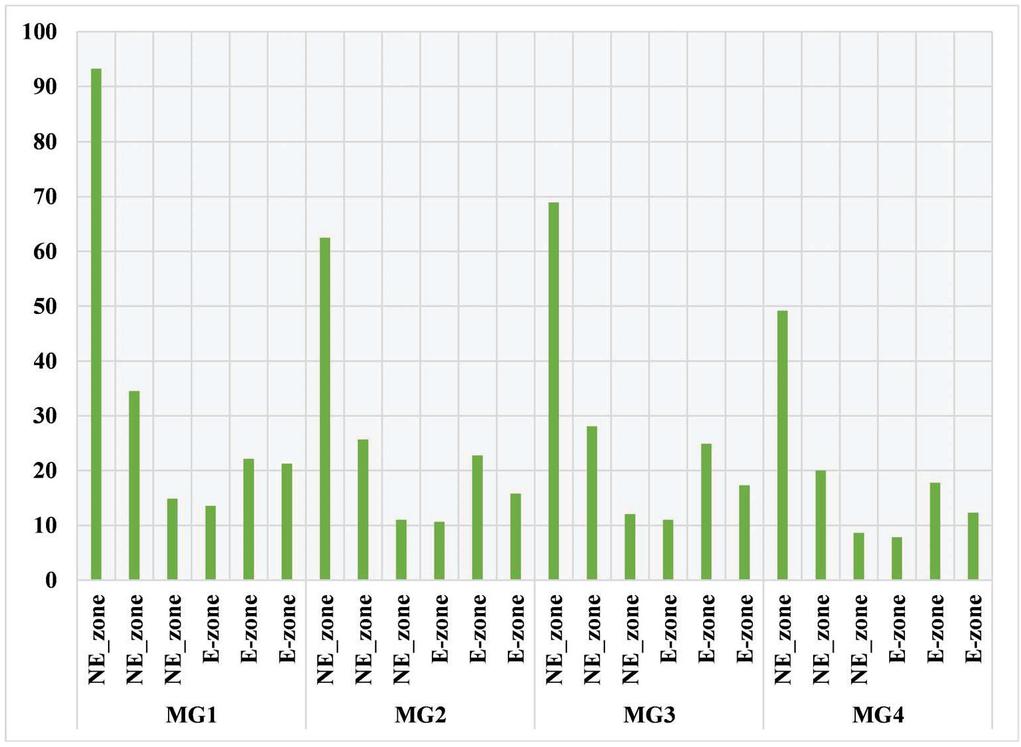
Figure 10 Zone wise loads for hour-block based energy trading.
The total combined cost of each MG for the whole day is MG: 13980.15 (USD/MWh), MG: 8133.47 (USD/MWh), MG: 10186.27 (USD/MWh) and MG: 6304.62 (USD/MWh) respectively. The total operating cost of the whole NMG system is 38604.52 (USD/MWh). The average amount of time taken for each iteration is 1.469999 seconds. The average and minimum for the objective function are 38942.55 (USD/MWh) and 38604.52 (USD/MWh). The standard deviation for 40 runs is 214.1659.
Table 5 Role of each MG
| MG | MG | MG | MG | Zone |
| Buyer | Buyer | Buyer | Buyer | NE-zone |
| Buyer | Buyer | Buyer | Buyer | NE-zone |
| Buyer | Buyer | Buyer | Buyer | NE-zone |
| Buyer | Seller | Buyer | Seller | E-zone |
| Seller | Seller | Buyer | Seller | E-zone |
| Buyer | Seller | Buyer | Seller | E-zone |
6 Conclusion
In this paper, a novel hour block-based DR approach is proposed to reduce the complexity and amount of time taken for the application of the DR program in comparison to the hour-to-hour block period. In the proposed method, the objective is to reduce the cost of each MG and the combined NMG framework. In the comparison of hour-to-hour and block-based energy trading, hour-block-based energy trading zones are formed depending on generation and load imbalance further classified in E-zone based on TOU prices. The comparison of both approaches is presented and results indicate a reduction in operating costs of individual MGs except for MG4 and the NMG network for the proposed method. PSO is applied for obtaining the optimal solution. The average amount of time for execution of each iteration is reduced from 4.578602 seconds to 1.469999 seconds.
References
[1] Liang Che, Xiaping Zhang, Mohammad Shahidehpour, Ahmed Alabdulwahab, and Abdullah Abusorrah. Optimal interconnection planning of community microgrids with renewable energy sources. IEEE Transactions on Smart Grid, 8(3):1054–1063, 2015.
[2] Michael Lee, Omar Aslam, Ben Foster, David Kathan, Jordan Kwok, Lisa Medearis, Ray Palmer, Pamela Sporborg, and Michael Tita. Assessment of demand response and advanced metering. Federal Energy Regulatory Commission, Tech. Rep, 2013.
[3] A. Hussain, V.-H. Bui, and H.-M. Kim, “Impact analysis of demand response intensity and energy storage size on operation of networked microgrids,” Energies, vol. 10, no. 7, p. 882, 2017.
[4] R. Bahmani, H. Karimi, and S. Jadid, “Stochastic electricity market model in networked microgrids considering demand response programs and renewable energy sources,” International Journal of Electrical Power & Energy Systems, vol. 117, p. 105606, 2020.
[5] N. Nikmehr, S. Najafi-Ravadanegh, and A. Khodaei, “Probabilistic optimal scheduling of networked microgrids considering time-based demand response programs under uncertainty,” Applied energy, vol. 198, pp. 267–279, 2017.
[6] N. Nikmehr, L. Wang, S. Najafi-Ravadanegh, and S. Moradi-Moghadam, “Demand response enabled optimal energy management of networked microgrids for resilience enhancement,” in Operation of Distributed Energy Resources in Smart Distribution Networks. Elsevier, 2018, pp. 49–74.
[7] A. Ajoulabadi, S. N. Ravadanegh, and B. Mohammadi-Ivatloo, “Flexible scheduling of reconfigurable microgrid-based distribution networks considering demand response program,” Energy, vol. 196, p. 117024, 2020.
[8] S. E. Ahmadi and N. Rezaei, “A new isolated renewable based multi microgrid optimal energy management system considering uncertainty and demand response,” International Journal of Electrical Power & Energy Systems, vol. 118, p. 105760, 2020.
[9] R. Bahmani, H. Karimi, and S. Jadid, “Stochastic electricity market model in networked microgrids considering demand response programs and renewable energy sources,” International Journal of Electrical Power & Energy Systems, vol. 117, p. 105606, 2020.
[10] M. Movahednia, H. Karimi, and S. Jadid, “Optimal hierarchical energy management scheme for networked microgrids considering uncertainties, demand response, and adjustable power,” IET Generation, Transmission & Distribution, vol. 14, no. 20, pp. 4352–4362, 2020.
[11] H. Karimi and S. Jadid, “Optimal energy management for multi-microgrid considering demand response programs: A stochastic multi-objective framework,” Energy, vol. 195, p. 116992, 2020.
[12] M. Azimian, V. Amir, R. Habibifar, and H. Golmohamadi, “Probabilistic optimization of networked multi-carrier microgrids to enhance resilience leveraging demand response programs,” Sustainability, vol. 13, no. 11, p. 5792, 2021.
[13] J. Faraji, A. Ketabi, H. Hashemi-Dezaki, M. Shafie-Khah, and J. P. Catalão, “Optimal day-ahead self-scheduling and operation of prosumer microgrids using hybrid machine learning-based weather and load forecasting,” IEEE Access, vol. 8, pp. 157 284–157 305, 2020.
[14] J. Faraji, A. Ketabi, and H. Hashemi-Dezaki, “Developing an energy management system for optimal operation of prosumers based on a modified data-driven weather forecasting method,” in 2020 10th Smart Grid Conference (SGC). IEEE, 2020, pp. 1–6.
[15] M. S. Misaghian, M. Saffari, M. Kia, M. S. Nazar, A. Heidari, M. Shafie- khah, and J. P. Catalão, “Hierarchical framework for optimal operation of multiple microgrids considering demand response programs,” Electric power systems research, vol. 165, pp. 199–213, 2018.
[16] V.-H. Bui, A. Hussain, and H.-M. Kim, “A multiagent-based hierarchical energy management strategy for multi-microgrids considering adjustable power and demand response,” IEEE Transactions on Smart Grid, vol. 9, no. 2, pp. 1323–1333, 2016.
[17] Hongbin Wu, Xin Liu, Bin Ye, and Bin Xu. Optimal dispatch and bidding strategy of a virtual power plant based on a stackelberg game. IET Generation, Transmission & Distribution, 14(4):552–563, 2019.
[18] James Kennedy and Russell Eberhart. Particle swarm optimization. In Proceedings of ICNN’95-international conference on neural networks, volume 4, pages 1942–1948. IEEE, 1995.
[19] Qinghai Bai. Analysis of particle swarm optimization algorithm. Computer and information science, 3(1):180, 2010.
[20] Daniel Bratton and James Kennedy. Defining a standard for particle swarm optimization. In 2007 IEEE swarm intelligence symposium, pages 120–127. IEEE, 2007.
[21] Mahamad Nabab Alam, Saikat Chakrabarti, and Xiaodong Liang. A benchmark test system for networked microgrids. IEEE Transactions on Industrial Informatics, 16(10):6217–6230, 2020.
Biographies

Lokesh Vankudoth received the bachelor’s degree in Electrical and Electronics Engineering from Kakatiya University in 2013, the master’s degree in Integrated Power Systems from Visvesvaraya National Institute of Technology Nagpur in 2017, respectively. He is currently working as a Ph.D. Scholar at the Department of Electrical Engineering, National Institute of Technology Warangal.

Altaf Q. H. Badar received his bachelor’s degree in Electrical Engineering from RTM Nagpur University in 2009, the master’s degree in Power Systems from RTM Nagpur University in 2009, and the philosophy of doctorate from Visvesvaraya National Institute of Technology Nagpur 2015, respectively. He is currently working as an Assistant Professor at the Department of Electrical Engineering, National Institute of Technology Warangal. His research areas include Evolutionary Optimization Algorithms, Energy Management, Energy Trading, Smart Grids, Forecasting.
Distributed Generation & Alternative Energy Journal, Vol. 37_4, 1215–1238.
doi: 10.13052/dgaej2156-3306.37413
© 2022 River Publishers