Impact of Fuel Cell System on Under Frequency Load Shedding Scheme Design
Rajeev Jha1 and Baseem Khan2,*
1Department of Electrical & Electronics Engineering, Allenhouse institute of Technology, Kanpur, India
2Department of Electrical and Computer Engineering, Hawassa University, Hawassa, Ethiopia
E-mail: en.rajeevjha@allenhouse.ac.in; baseem.khan04@gmail.com
*Corresponding Author
Received 28 August 2021; Accepted 16 December 2021; Publication 24 May 2022
Abstract
The drop in frequency is a direct consequence of generation deficiency, either due to loss of generation or an increase in load. Therefore, in this work, to compensate for this generation deficiency following large disturbances, a fuel cell system (FCS) could be the most effective counter-measure. With the introduction of a proportional-integral (PI) controller to the FCS, the power output of the FCS can be further modified. In the present work, a two-area hydro-thermal interconnected system is being considered and simulated in MATLAB with and without FCS. From the simulation results, it is found that by using a FCS (with and without PI), the load shedding amount is reduced and the under-frequency load shedding (UFLS) scheme is made more effective.
Keywords: Critical frequency, critical load, fuel cell system (FCS), proportional integral (PI) controller, under frequency load shedding (UFLS).
1 Introduction
The frequency of the power system varies with the consumer load. With the continuous increase in the load demand, the system frequency drops and reaches its minimum allowable limit. The frequency of the power system depends on generation-load balance. Under normal operating conditions, the generation-load balance is maintained and the system frequency is fixed or deviates within limits. For small system upsets, the frequency drop is small and the system.
The frequency can be brought back to its normal operating state. But in large system disturbances, either due to loss of large generation or due to a large increase in the load demand, the system frequency drops quickly or the system may even collapse if proper protection schemes are not used. Load shedding is used to restore the system’s frequency following a large disturbance. Several under-frequency load schemes have been proposed in the literature. The static type was proposed by many authors as part of frequency load shedding schemes based on frequency (f) [1]. The disadvantage of these static under frequency load shedding (UFLS) schemes was that they shed a fixed amount of load irrespective of the system disturbances. Many authors have attempted to improve the adaptability of UFLS schemes by using the frequency rate of change (df/dt) as an additional control index to estimate system disturbances and improve the load shedding scheme [2, 3]. The power system frequency deviation is the direct consequence of the generation deficiency. Hence, in order to restore the frequency to its nominal value, compensation for this generation deficiency is needed, which may be provided by an active power source such as a fuel cell system. The fuel cell system could be a better countermeasure for the compensation of the generation deficiency. The fuel cell system has proven numerous applications in frequency regulation in micro-grid systems also [4, 5].
1.1 Related Work
Different researchers presented the various techniques for under frequency load shedding scheme design. In [6], authors proposed the under-frequency load shedding scheme by utilizing the fuzzy logic algorithm. The authors of [7] suggested an adaptive under-frequency load shedding scheme for a system with high wind power penetration. In [8], the authors proposed real-time time-based under-frequency control and energy management of microgrids. The authors proposed a hierarchical frequency control framework for a remote microgrid with pico-hydel energy storage and a wind turbine in [9]. The authors of [10] looked into the real-time changes and recovery of proton exchange membrane fuel cells during voltage reversal. They studied the influence of hydrogen aqua electrolyzer-fuel cell units on electric grid automatic generation regulation using a novel optimum fuzzy TIDF-II controller in [11]. The real-time alterations and recuperation of a proton exchange membrane fuel cell under voltage reversal were explored in [12]. A complete literature assessment on load frequency regulation with renewable energy integration in the power system is offered in [13]. Ref. [14] describes the interfacing of a solar and hydrogen fuel cell system for sustainable energy harvesting of a university’s ICT infrastructure with an imbalanced electric grid. The optimal operation region of a super-high-speed electrical air compressor in a fuel cell system is presented in [15] for working stability under multiple-time scale excitation. The paper [16] presents a comparison of power control approaches for fuel cell hybrid electric cars. Ref. [17] presents a better VSG management approach based on a combined power generating system with hydrogen fuel cells and super capacitors. Application of a self-adaptive Harris Hawks optimization-based energy management method for a fuel cell-based electric power system is reported in [18]. Ref. [19] presents high gain fuel cell front-end converters for PEMFC power conditioning systems with reduced input current ripple. Ref. [20] presents optimal fuel efficiency solutions for fuel cell hybrid power systems operating under varying renewable and load situations. For higher fuel efficiency, [21] presents optimal airflow of fuel cell hybrid power systems employing fuel flow-based load-following management.
Different fuel cell technologies are developed around the world. Comparative analysis of the various types of fuel cells such as polymer electrolyte membrane (PEM), alkaline (AFC), phosphoric acid (PAFC), molten carbonate (MCFC), and solid oxide (SOFC) are presented in the Table 1.
Table 1 Comparative analysis of the various types of fuel cells
| Operation | |||||||
| Type | Electrolyte | Range in C | Stack Size | Efficiency (lhv) | Uses | Benefits | Issues |
| PEM | Perfluorosulfonic acid | 120C | 1 kW–100 kW | 40% to 60% |
1. Standby generation 2. Portable power 3. Green energy production 4. Electric vehicles |
1. Less corrosion 2. electrolyte related issues 3. Small temperature operation 4. Fast commitment and demand supply |
1. High catalysts cost 2. Affected by fuel pollutant |
| AFC | Lithium Carbonate | 100C | 1–100 kW | 60% |
1. Defence applications 2. Space applications 3. Standby generation 4. Electric mobility |
1. Broad range of stable materials 2. Smaller cost elements 3. Operation at small temperature 4. Fast commitment |
1. Affected by carbon dioxide in air and fuel 2. Management of Electrolyte is also critical issue |
| PAFC | Potassium hydroxide | 150–200C | 5–400 kW, 100 kW module (liquid PAFC) 10 kW (polymer membrane) | 40% | Renewable energy production |
1. useful in combined heat power plants 2. Enhanced acceptance to fuel impurities |
1. High catalysts cost 2. Delayed commitment 3. Sensitive to the Sulfur |
| MCFC | Ceramic Solid oxide ceragadolinia | 600–700C | 300 kW–3 MW | 50% |
1. Grid power production 2. Renewable energy production |
1. High efficacy 2. Flexibility for fuel 3. useful in combined heat power plants |
1. Corrosion at high temperature 2. Failure of cell elements at high temperature 3. Delayed commitment 4. Power density is small |
| SOFC | Ceramic Solid oxide zirconia | 500–1,000C | 1 kW–2 MW | 60% | Auxiliary power Electric utility Distributed generation |
1. High efficacy 2. Flexibility for fuel 3. useful in combined heat power plants 4. Solid type electrolyte |
1. Corrosion at high temperature 2. Failure of cell elements at high temperature 3. Delayed commitment 4. Shutdowns are restricted |
1.2 Research Gap
Most of the research performed for the development of the under frequency load shedding scheme design didn’t consider the fuel cell technique, which is the novel contribution of this work. Further, this work utilized the PI controller in association with fuel cell technique to reduce the shaded amount of the demand.
1.3 Contribution
This work presented the impact of fuel cell system on under frequency load shedding scheme design. the novel contribution of this work are as follows:
1. Fuel cell system is used to design the under frequency load shedding scheme
2. PI controller is utilized in association with fuel cell system to minimize the shaded amount of demand.
3. A detailed comparative analysis is presented to show the effectiveness of the proposed fuel cell system integrated with PI controller.
1.4 Organization of the Manuscript
The remaining of the manuscript is as follows: section two discussed the configuration of the system utilized in this work. Section three discussed the developed model. Section four critically discussed the results, obtained from the proposed model. A comparative analysis is also presented in this section. Last section discussed the conclusion of the manuscript.
2 System Configuration
In this section, a two-area thermal-hydro interconnected system is being considered for load shedding, with load disturbances in both areas. The impact of FCS on load shedding is being modeled and simulated in MATLAB/Simulink Software and results are compared for load shedding steps for three cases; one without FCS, second with FCS (With and Without PI Controller). Numerous high-order models for FCS have been proposed in literature. In the present context, the FCS is being modeled as a single order transfer function. The FCS system consists of a fuel cell and an Aqua Electrolyzer (AE), both of which are modeled as simple single-order transfer functions. The AE produces hydrogen which is used as a fuel for the fuel cell as and when necessary. The FCS system produces a power output proportional to the frequency deviation. The PI Controller further regulates the power production; hence the frequency regulation and load shedding amount.
3 Proposed Work
3.1 Model Without FCS
The block diagram of a two-area thermal hydro power system is shown in Figure 1. The change in demand P is considered to be a step function. The sign of P is such that, for a sudden increase in load demand, P; for a sudden increase in generation, P. The step load change can be expressed as [1, 7],
| (1) |
where, P is disturbance magnitude in per unit on system base S and u(t) is a usually defined step function. In Laplace domain Equation (1) can be expressed as follows,
| (2) |
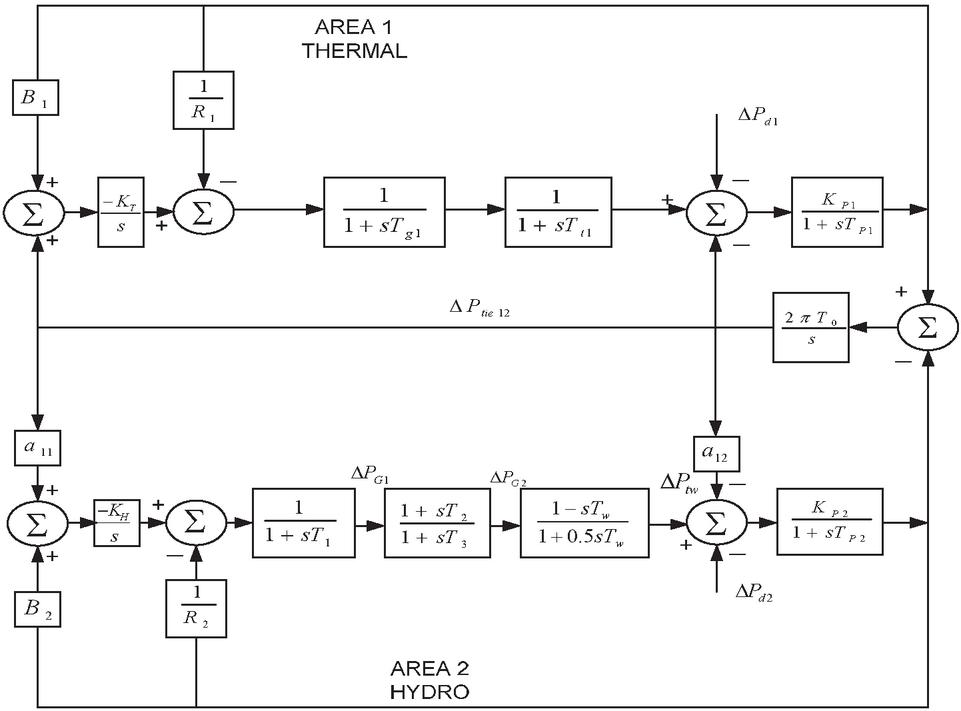
Figure 1 Block diagram of thermal-hydro system without FCS.
3.2 Fuel Cell System (FCS)
A Fuel Cell System is basically an electrochemical energy conversion device which converts the energy from fossil fuels to equivalent electrical energy. They are fossil fuel batteries, but unlike the batteries, there is no need to recharge the fuel cells. They are two to three times more efficient in comparison to the internal combustion engines.
3.2.1 Mathematical modeling of FCS
The mathematical modeling of a fuel cell system can discussed as follows:
(a) Transfer function Equation of fuel cells
The transfer function for the system frequency variation to per unit fuel cell power can be expressed as [7, 11]:
| (3) |
where, is the per unit fuel cell power, is the gain of the fuel cell unit and is the time constant of the fuel cell unit.
(b) Transfer Function Equation of an Aqua Electrolyzer
A fraction of the total generated power is supplied to the Aqua Electrolyzer to produce the available hydrogen for the fuel cell. The transfer function of the Aqua Electrolyzer can be expressed as [7, 11]:
| (4) |
where, is the change in power consumption by the Aqua electrolyzer, is the gain of the aqua electrolyzer and is the time constant of the Aqua electrolyzer.
3.2.2 Model with FCS (without PI Controller)
With FCS (FC and AE) in the thermal area, the block diagram as given in Figure 1, can be modified and shown in Figure 2. In the present section the PI Controller is not included in the FCS.
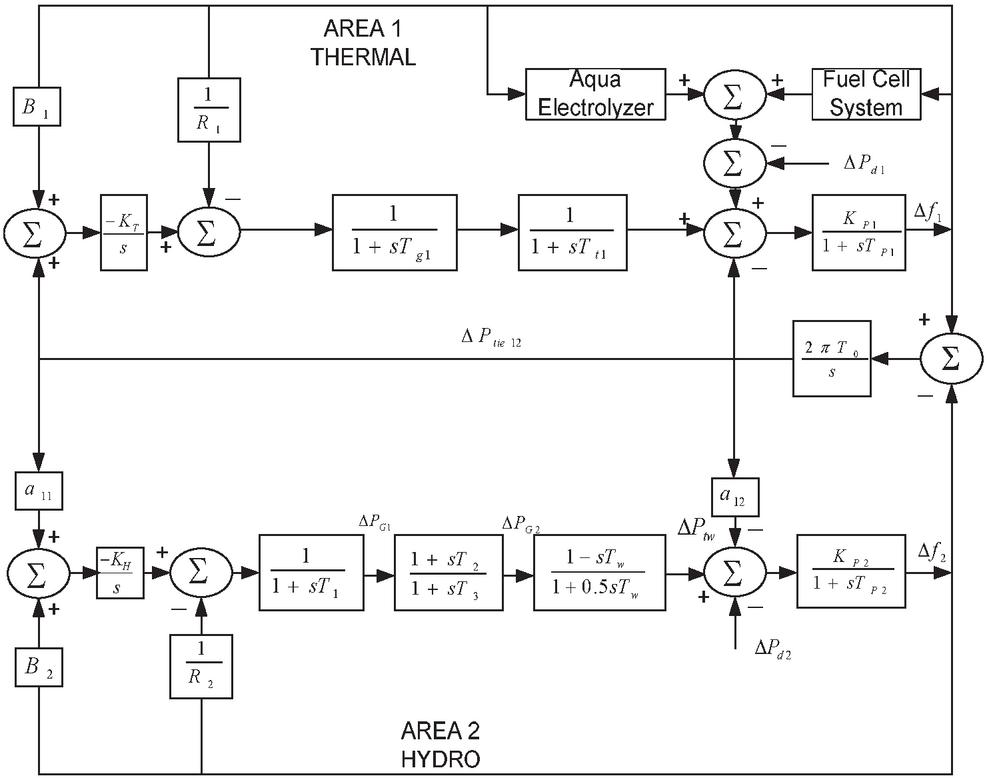
Figure 2 Block diagram of thermal-hydro system with FCS.
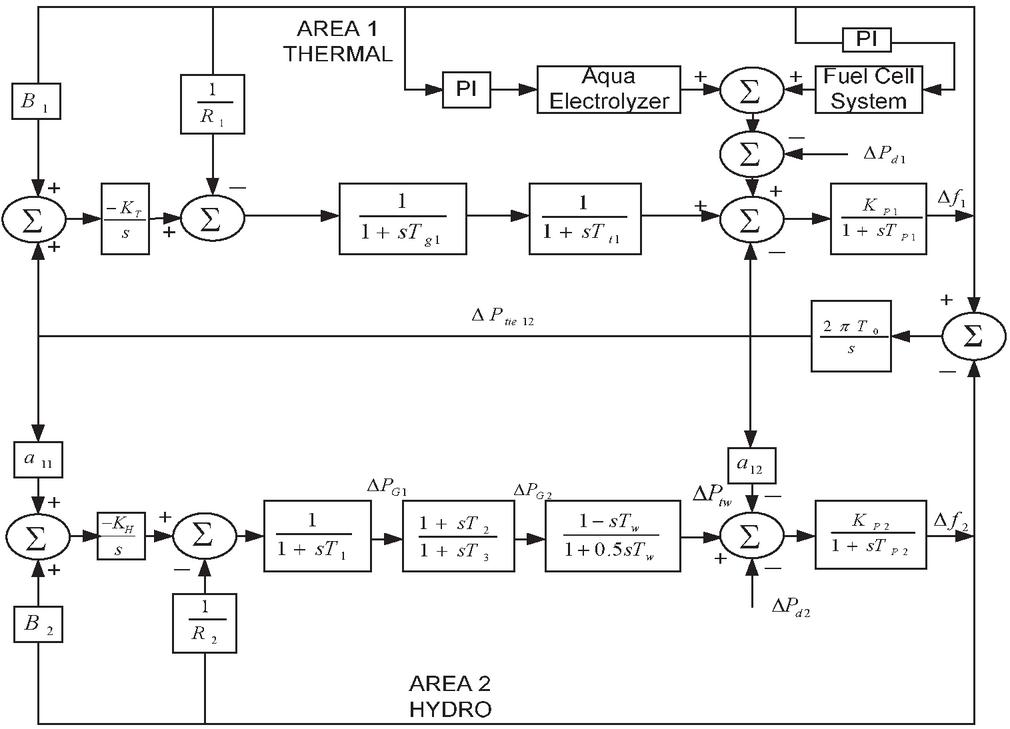
Figure 3 Block diagram of thermal-hydro system with PI controller based FCS.
3.2.3 Model with FCS (with PI Controller)
With FCS (FC and AE) in the thermal area, the block diagram as given in Figure 1, can be modified and shown in Figure 3. In the present section, the PI Controller is included in the FCS (FC and AE).
The different system parameters based on the above discussed models are presented in the Table 2.
Table 2 System parameters
| S N | Parameters | Values |
| 1 | K, K | 120 Hz/(pu. MW) |
| 2 | T, T | 20 sec. |
| 3 | R, R | 2.4 Hz/ (pu. MW) |
| 4 | B, B | 0.4249 |
| 5 | T | 0.08 sec |
| 6 | T | 0.3 sec |
| 7 | T | 0.0866 sec |
| 8 | T | 41.6 sec |
| 9 | T | 5 sec |
| 10 | T | 0.513 sec |
| 11 | T | 1 sec |
| 12 | D, D | 8.333 pu. MW/Hz |
4 Simulation Result and Discussion
Simulation of a two-area interconnected thermal-hydro system has been carried out in three scenarios: first without FCS, second with the introduction of FCS (FC and AE) without PI controllers, and third with a fuel cell system with PI controller. The three system models have been simulated in the time domain using MATLAB/Simulink software and results have been compared for the three scenarios. Different fuel cell time constant utilized in this work are presented in the Table 3. Out of these 4 FC time constant values, authors got the adequate results for T. Further, Table 4 presented the FCS parameters and controller gains.
Table 3 Different FC time constants (T)
| S. No. | Constant Value |
| 1 | 0.98 |
| 2 | 0.99 |
| 3 | 1 |
| 4 | 1.02 |
Table 4 FCS parameters and controller gains
| S. No. | Constant/Gain | Value |
| 1 | Gain Constant of FC (K) | 500 |
| 2 | Time Constant of FC (T) | 1 |
| 3 | Gain Constant of AE (K) | 500 |
| 4 | Time Constant of AE (T) | 0.03 |
| 5 | Proportional Gain of FC | 1 |
| 6 | Integral Gain of FC | 1 |
| 7 | Proportional Gain of AE | 2 |
| 8 | Integral Gain of AE | 1 |
4.1 Scenario 1: Effect of Change in Load Without FCS Facility
In the scenario 1, effect of the change in the load, without FCS facility is presented in Table 5.
Table 5 Frequency variation of Area 1 and Area 2 with corresponding load shed w.r.t equally varying load in both areas without FCS
| Case No. | P (pu) | P (pu) | F (Hz) | F (Hz) | LSA | LSA |
| 1 | 0.2 | 0.2 | 48.97 | 48.71 | NA | NA |
| 2 | 0.3105 | 0.3105 | 48.41 | 48.00 | NA | NA |
| 3 | 0.3921 | 0.3921 | 48.00 | 47.50 | NA | 0.0816 |
| 4 | 0.45 | 0.45 | 47.69 | 47.10 | 0.0579 | 0.1395 |
| 5 | 0.5 | 0.5 | 47.42 | 46.80 | 0.1079 | 0.1895 |
| 6 | 0.6 | 0.6 | 46.92 | 46.14 | 0.2079 | 0.2895 |
| 7 | 0.645 | 0.645 | 46.70 | 45.90 | 0.2529 | 0.3345 |
| 8 | 0.8 | 0.8 | 45.90 | 44.85 | 0.4079 | 0.4895 |
| 9 | 1.0 | 1.0 | 44.90 | 43.60 | 0.6079 | 0.5759 |
Following observations can be drawn from Table 5:
(1) The critical load for Area 1 (thermal area) is 0.3921 pu. While for Area 2 (hydro area), it is found to be 0.3105 pu. Thus the critical load for Area 2 is lower than for Area 1.
(2) For Area 1, case 1–3, do not require any load shedding as up to the critical load, no load shedding is required. But as the load increases beyond the critical load, the frequency decreases below its minimum allowable frequency i.e. critical frequency.
(3) For Area 2, case 1–2, do not require any load shedding as up to the critical load, no load shedding is required. But as the load increases beyond the critical load, the frequency decreases below its minimum allowable frequency i.e. critical frequency.
(4) Load shedding steps for Area 2 (Hydro area) is more than for Area 1 (Thermal area).
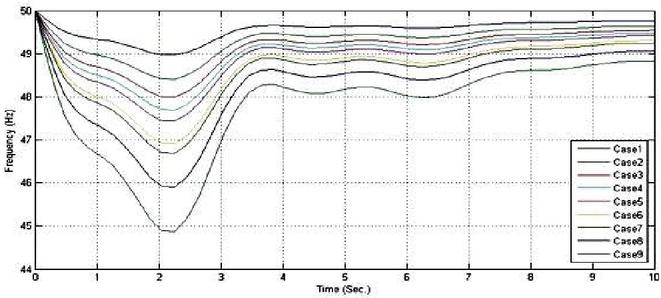
Figure 4 Frequency Response of Area 1 without FCS.
From Figure 4, it can be seen that, for Area 1, the maximum change in frequency is computed and found to be fP and time instant of maximum frequency change is found to be t sec.
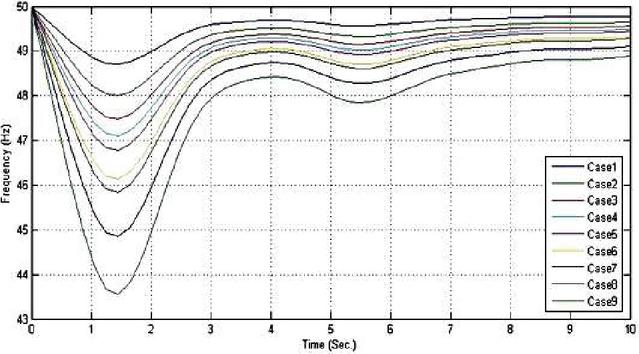
Figure 5 Frequency Response of Area 2 without FCS.
From Figure 5, it can be seen that, for Area 2, the maximum change in frequency is computed and found to be f P and time instant of maximum frequency change is found to be t sec.
4.2 Scenario 2: Effect of Change in Load with Fuel Cell System Without PI Controller
In the scenario 2, effect of the change in the load, with Fuel cell system without PI controller is presented in Table 6.
Table 6 Frequency variation of Area 1 and Area 2 with corresponding load shed w.r.t equally varying load in both areas with Fuel cell system
| Case No. | P (pu) | P (pu) | F (Hz) | f (Hz) | LSA (pu) | LSA (pu) |
| 1 | 0.2 | 0.2 | 49.36 | 49.22 | NR | NR |
| 2 | 0.3105 | 0.3105 | 49.0 | 48.79 | NR | NR |
| 3 | 0.3921 | 0.3921 | 48.75 | 48.47 | NR | NR |
| 4 | 0.45 | 0.45 | 48.57 | 48.24 | NR | NR |
| 5 | 0.5128 | 0.5128 | 48.36 | 48 | NR | NR |
| 6 | 0.625 | 0.625 | 48 | 47.55 | NR | 0.1122 |
| 7 | 0.7 | 0.7 | 47.8 | 47.27 | 0.075 | 0.1872 |
| 8 | 0.8 | 0.8 | 47.45 | 46.87 | 0.175 | 0.2872 |
| 9 | 1.0 | 1.0 | 46.80 | 46.10 | 0.375 | 0.4872 |
Following observations can be drawn from Table 6:
The critical load for Area 1 (thermal area) is 0.625 pu. While for Area 2 (hydro area), it is found to be 0.5128 pu. Thus the critical load for Area 2 is lower than for Area 1.
(1) For Area 1, case 1–6, do not require any load shedding as up to the critical load, no load shedding is required. But as the load increases beyond the critical load, the frequency decreases below its minimum allowable frequency i.e. critical frequency.
(2) For Area 2, case 1–5, do not require any load shedding as up to the critical load, no load shedding is required. But as the load increases beyond the critical load, the frequency decreases below its minimum allowable frequency i.e. critical frequency.
(3) Load shedding steps for Area 2(Hydro area) is more than for Area 1(Thermal area).
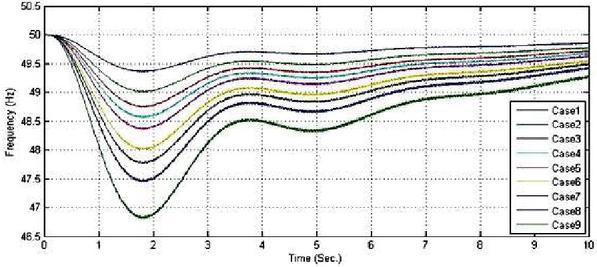
Figure 6 Frequency Response of Area 1 with FCS (without PI).
From Figure 6, it can seen from that, for Area 1 the maximum change in frequency is computed and found to be f P and time instant of maximum frequency change is found to be t sec.
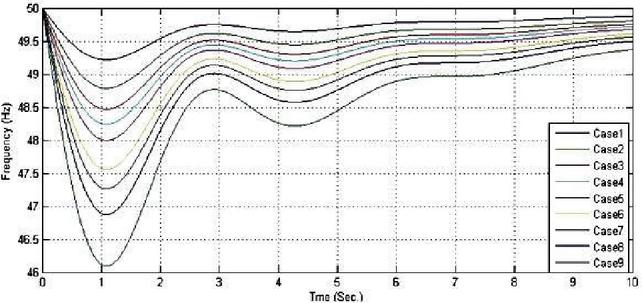
Figure 7 Frequency Response of Area 2 with FCS (without PI).
From Figure 7, it can seen from that, for Area 2 the maximum change in frequency is computed and found to be f P and time instant of maximum frequency change is found to be t sec.
4.3 Scenario 3: Effect of Change in Load with Fuel Cell System with PI Controller
In the scenario 3, effect of the change in the load, with Fuel cell system and PI controller is presented. In this work, PI controller is tuned as per the trial and error method.
Table 7 Frequency variation of Area 1 and Area 2 with corresponding load shed w.r.t equally varying load in both Areas with Fuel cell system with PI Controller
| Case No. | P (pu) | P (pu) | F (Hz) | f (Hz) | LSA (pu) | LSA (pu) |
| 1 | 0.20 | 0.20 | 49.44 | 49.26 | NR | NR |
| 2 | 0.3105 | 0.3105 | 49.13 | 48.85 | NR | NR |
| 3 | 0.3921 | 0.3921 | 48.90 | 48.54 | NR | NR |
| 4 | 0.45 | 0.45 | 48.75 | 48.33 | NR | NR |
| 5 | 0.5376 | 0.5376 | 48.50 | 48.0 | NR | NR |
| 6 | 0.6 | 0.6 | 48.30 | 47.77 | NR | 0.0624 |
| 7 | 0.714 | 0.714 | 48.0 | 47.35 | NR | 0.1764 |
| 8 | 0.80 | 0.80 | 47.75 | 47.03 | 0.086 | 0.2624 |
| 9 | 1.0 | 1.0 | 47.20 | 46.28 | 0.286 | 0.4624 |
Following observations can be drawn from Table 7:
(1) The critical load for Area 1 (thermal area) is 0.714 pu. While for Area 2 (hydro area), it is found to be 0.5376 pu. Thus the critical load for area 2 is lower than for area 1.
(2) For Area 1, case 1–7, do not require any load shedding as up to the critical load, no load shedding is required. But as the load increases beyond the critical load, the frequency decreases below its minimum allowable frequency i.e. critical frequency.
(3) For Area 2, case 1–5, do not require any load shedding as up to the critical load, no load shedding is required. But as the load increases beyond the critical load, the frequency decreases below its minimum allowable frequency i.e. critical frequency.
(4) Load shedding steps for Area 2 (Hydro area) is more than for Area 1 (Thermal area).
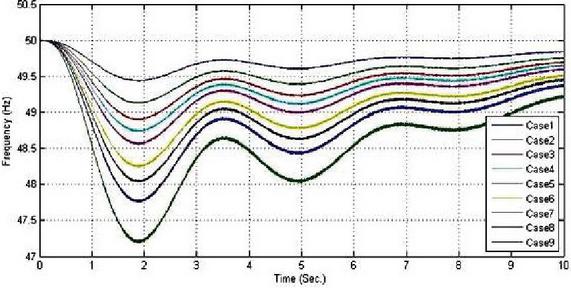
Figure 8 Frequency Response of Area 1 with FCS (with PI).
From Figure 8, it can be seen that, for Area 1 the maximum change in frequency is computed and found to be f P and time instant of maximum frequency change is found to be t sec.
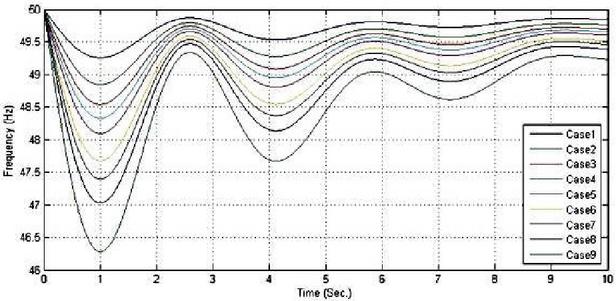
Figure 9 Frequency Response of Area 2 with FCS (with PI).
From Figure 9, it can be seen that, for Area 2 the maximum change in frequency is computed and found to be f P and time instant of maximum frequency change is found to be t sec.
4.4 Comparative Analysis
To compare the various discussed schemes Figures 10–11 can be considered.
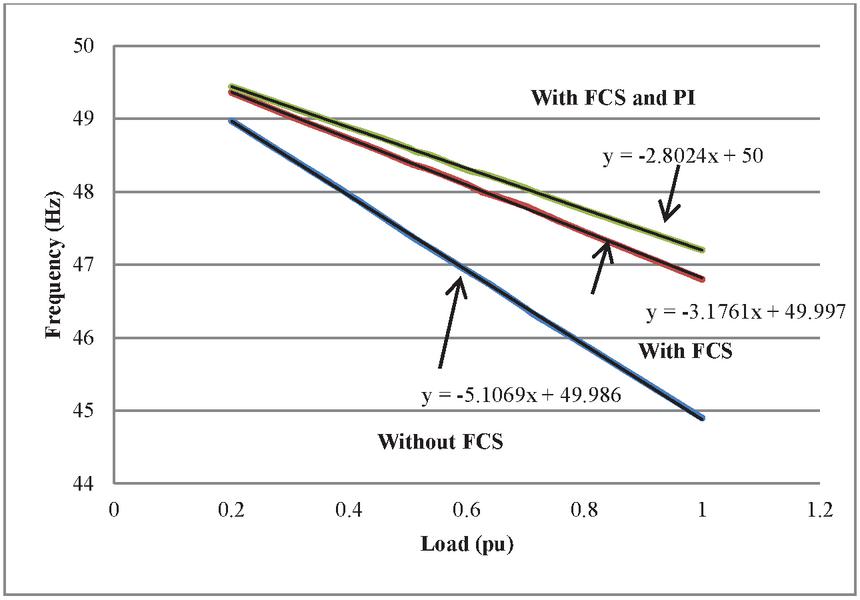
Figure 10 Minimum frequency variation of area 1 for different case schemes.
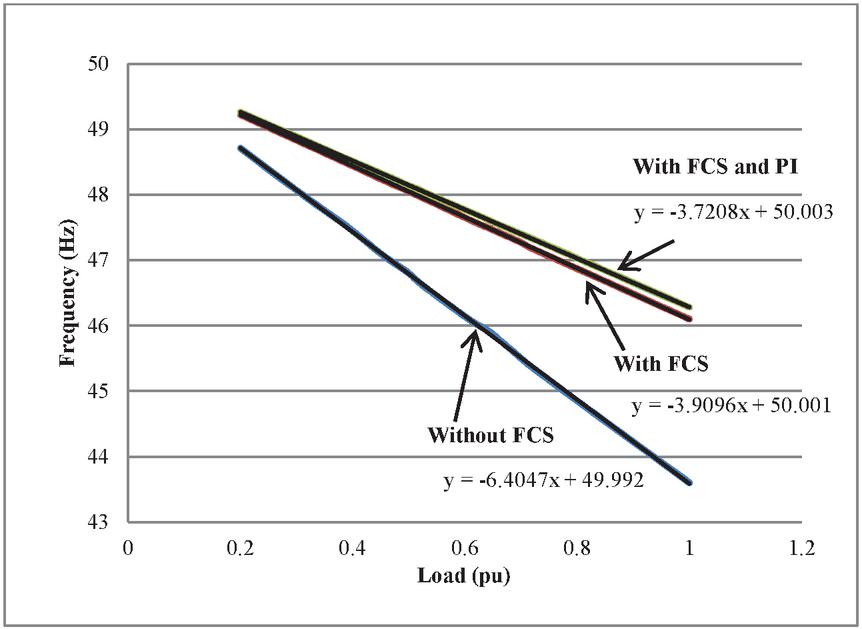
Figure 11 Minimum frequency variation of area 2 for different case schemes.
Figures 10 and 11 compare the frequency responses of the two areas for the different case study schemes. It can be concluded from the above mentioned figures that with the introduction of FCS (with and without PI Controller), the variation of minimum frequency w.r.t the varying load is improved and hence less load shedding results with the introduction of FCS (with and without PI Controller). It shows that the schemes incorporating FCS with PI Controller show the best results among the three discussed cases or schemes. This is only because of the modulation of the FCS power output with the introduction of the PI Controller.
4.5 Comparison of Fuel Cell Technology with Battery Energy Storage System
Fuel cells are basically fossil-fuelled batteries, but unlike batteries, they do not require charging and may operate eternally as long as they are provided with a supply of fuel (most often hydrogen) and an oxidant (usually air). They provide a fundamentally different method of generating electricity than fossil fuels, such as natural gas or gasified coal. A fuel cell is an electro-chemical energy conversion device that converts fuel to electricity two to three times more efficiently than an internal combustion engine. Fuel cells based on modern technology are capable of producing electric power more consistently and quietly, with less pollution and incredible fuel efficiency – up to 50%, or half as excellent as the finest steam turbine units. Additional benefit is that, like battery energy storage systems, fuel cells may be built on an assembly line, in the form of small capacity stacks – as little as 1 kW – and combined in groups if a bigger capacity is required. Because of its versatility, the fuel cell is more suited to “distributed power resource” applications. One or two can be utilized if just a little amount of electricity is necessary, while hundreds can be installed if a large amount of power is required. Because fuel cells are a source of electric power, they may be utilized to compensate for a lack of production and moderate significant frequency excursions, reducing the amount of load shedding and making the load shedding scheme more effective.
5 Conclusion
This work proposed the fuel cell technology, integrated with the PI controller to design the under frequency load shedding scheme. Different results were obtained under three different scenarios. A further nine different cases are considered based on the load variation. A detailed comparative analysis of three proposed scenarios is presented, which shows that the under frequency load shedding scheme with fuel cell technology integrated with the PI controller reduced the shaded load amount more compared to the other two scenarios.
As a future enhancement of the work, the proposed technique can be utilized for the multi area system, but in such cases the operation, control and net power inter-change of tie lines plays major role and also affect the working of the proposed FCS.
References
[1] Kumar B.S., Mishra S., Bhende C.N., Chauhan, M.S., “PI controller based frequency regulator for distributed generation”, TENCON 2008, IEEE Region 10 Conference, pp. 1–6.
[2] Concordia C, Fink L H, Poullikkas G., 1995. “Load shedding on an isolated system”, IEEE Transactions on Power Systems, vol. 13, No. 3, pp. 1467–1472.
[3] You H and Vittal V., 2003. “Self-healing in power systems: an approach using islanding and rate of frequency decline-based load shedding”, IEEE Transactions on Power Systems, vol. 18, No. 1, pp. 174–181.
[4] Thompson J G, Fox B. Adaptive load shedding for isolated power systems. IEE Proceedings of Generation, Transmission and Distribution, vol. 141, No. 5, pp. 491–496, 1994.
[5] Ray P K, Mohanty S R, Kishore N, 2009. “Frequency Regulation of Hybrid Renewable Energy System for Large Band wind Speed Variation, International Conference on Power Systems, pp. 1–6.
[6] Małkowski, R.; Nieznañski, J. Underfrequency Load Shedding: An Innovative Algorithm Based on Fuzzy Logic. Energies 2020, 13, 1456.
[7] Li, S.; Tang, F.; Shao, Y.; Liao, Q. Adaptive Under-Frequency Load Shedding Scheme in System Integrated with High Wind Power Penetration: Impacts and Improvements. Energies 2017, 10, 1331.
[8] Worku, M.Y.; Hassan, M.A.; Abido, M.A. Real Time-Based under Frequency Control and Energy Management of Microgrids. Electronics 2020, 9, 1487.
[9] Krishnakumar R. Vasudevan, Vigna K. Ramachandaramurthy, Gomathi Venugopal, J.B. Ekanayake, S.K. Tiong, Hierarchical frequency control framework for a remote microgrid with pico hydel energy storage and wind turbine, International Journal of Electrical Power & Energy Systems, Volume 127, 2021, 106666.
[10] Rui Lin, Hang Yu, Di Zhong, Lihang Han, Ying Lu, Shenghao Tang, Zhixian Hao, Investigation of real-time changes and recovery of proton exchange membrane fuel cell in voltage reversal, Energy Conversion and Management, Volume 236, 2021, 114037.
[11] Yogendra Arya, Impact of hydrogen aqua electrolyzer-fuel cell units on automatic generation control of power systems with a new optimal fuzzy TIDF-II controller, Renewable Energy, Volume 139, 2019, Pages 468–482.
[12] Rui Lin, Hang Yu, Di Zhong, Lihang Han, Ying Lu, Shenghao Tang, Zhixian Hao, Investigation of real-time changes and recovery of proton exchange membrane fuel cell in voltage reversal, Energy Conversion and Management, Volume 236, 2021, 114037.
[13] Mrinal Ranjan, Ravi Shankar, A literature survey on load frequency control considering renewable energy integration in power system: Recent trends and future prospects, Journal of Energy Storage, Volume 45, 2022, 103717.
[14] M.S. Okundamiya, Integration of photovoltaic and hydrogen fuel cell system for sustainable energy harvesting of a university ICT infrastructure with an irregular electric grid, Energy Conversion and Management, Volume 250, 2021, 114928.
[15] Donghai Hu, Wenshuo Hou, Leli Hu, Lei Yang, Qingqing Yang, Jiaming Zhou, Optimal operation region of super-high-speed electrical air compressor in fuel cell system for working stability under multiple-time scale excitation, International Journal of Hydrogen Energy, Volume 46, Issue 38, 2021, Pages 20054–20064.
[16] Mohamed Nacereddine Sid, Mohamed Becherif, Abdenacer Aboubou, Amel Benmouna, Power control techniques for fuel cell hybrid electric vehicles: A comparative study, Computers & Electrical Engineering, 2021, 107602.
[17] Yuyan Zhu, Huaiyuan Wang, Zhenshan Zhu, Improved VSG control strategy based on the combined power generation system with hydrogen fuel cells and super capacitors, Energy Reports, Volume 7, 2021, Pages 6820–6832.
[18] M.A. Ebrahim, Besanti Talat, E.M. Saied, Implementation of self-adaptive Harris Hawks Optimization-based energy management scheme of fuel cell-based electric power system, International Journal of Hydrogen Energy, Volume 46, Issue 29, 2021, Pages 15268–15287
[19] Yigeng Huangfu, Yuhui Ma, Hao Bai, Liangcai Xu, Aiben Wang, Rui Ma, A family of high gain fuel cell front-end converters with low input current ripple for PEMFC power conditioning systems, International Journal of Hydrogen Energy, Volume 46, Issue 53, 2021, Pages 27156–27172.
[20] Nicu Bizon, Efficient fuel economy strategies for the Fuel Cell Hybrid Power Systems under variable renewable/load power profile, Applied Energy, Volume 251, 2019, 113400.
[21] Bizon N, Mazare AG, Ionescu LM, Thounthong P, Kurt E, Oproescu M, Serban G, Lita I. Better Fuel Economy by Optimizing Airflow of the Fuel Cell Hybrid Power Systems Using Fuel Flow-Based Load-Following Control. Energies. 2019; 12(14):279.
Biographies

Rajeev Jha is currently an Assistant Professor in Electrical & Electronics Engineering Department at Allenhouse Institute of Technology, Kanpur, India. He has more than 8 years of experience in academics. He received his graduation degrees (Bachelor of Engineering) from Rajiv Gandhi Technical University in 2011 & his Master degree (Masters of Technology) from School of Energy & Environment Management, UTD, RGPV, Bhopal in 2013. His area of interest is on Renewable energy, Power electronics converters, Smart grid technology & optimization techniques.

Baseem Khan (Senior Member, IEEE) received the B.Eng. degree in electrical engineering from Rajiv Gandhi Technological University, Bhopal, India, in 2008, and the M.Tech. and PhD degrees in electrical engineering from the Maulana Azad National Institute of Technology, Bhopal, in 2010 and 2014, respectively. He is currently working as a Faculty Member at Hawassa University, Ethiopia. His research interests include power system restructuring, power system planning, smart grid technologies, meta-heuristic optimization techniques, reliability analysis of renewable energy systems, power quality analysis, and renewable energy integration.
Distributed Generation & Alternative Energy Journal, Vol. 37_5, 1329–1348.
doi: 10.13052/dgaej2156-3306.3752
© 2022 River Publishers