Optimal Electricity Price of TOU Demand Response Program for Distribution Grid Reliability Improvement
Mehrdad Tahmasebi1,*, Jagadeesh Pasupuleti2, Hamed Foodaji3 and Mohammad Tolou Askari4
1Department of Electrical Engineering, Ilam Branch, Islamic Azad University, Ilam, Iran
2Department of Electrical Power Engineering, Universiti Tenaga Nasional, Jalan IKRAM-UNITEN, 43000 Kajang, Selangor, Malaysia
3South Khorasan IRIB, Birjand, Iran
4Department of Electrical Engineering, Semnan Branch, Islamic Azad University, Semnan, Iran
E-mail: mtahmasebi@aut.ac.ir
*Corresponding Author
Received 31 October 2021; Accepted 27 December 2021; Publication 24 June 2022
Abstract
Nowadays, the power systems and distribution network’s reliability are critical issues from electric companies’ and consumers’ perspectives. As suppliers of the power required by the consumers, electric companies are trying to deliver the power to customers on a continuous and reliable basis. The existence of customers’ power interruptions causes damage to the customer; moreover, it may cause damage to the electric company due to the lack of energy sales during the hours of a power outage. In this paper, the reliability issue was investigated by examining the two indices EENS and ECOST, on the test distribution network to evaluate the impact of electricity prices in TOU demand response on the reliability of the distribution network has been investigated. Also find the optimal electricity prices for the best distribution network reliability. In this research, simulation studies were conducted on the Roy Billinton Test System (RBTS) distribution network using the GAMS software. From the analysis of the simulation results, the distribution grid reliability was improved by implementing optimal electricity prices of the TOU demand response program.
Keywords: Reliability, demand response, time of use, optimal price.
1 Introduction
Energy generated by large-scale power plants in the power system reached the transmission lines to the conventional distribution network and supplied customers. In recent times, researchers are keen on implementing demand response programs (DRPs) in power grids. This interest is due to a courier in the distribution curve of the distribution network, resulting in a reduction of peak load and smoothing of load curve by implementing demand response programs. Researchers have implemented DRPs in determining the reliability of distribution networks. A comprehensive methodology for evaluating the price and risk of nodes is given in terms of the direct relationship between power system reliability and price [1]. The results reveal that power system reliability and prices are inherently related. In [2], a method for analyzing the impact of smart measurement power consumption technology on the system’s long-term market reliability and prices has been introduced. The results that the reliability has improved by utilizing demand response. Real-time pricing (RTPs) benefits to consumers have been examined by a framework based on a statistical elastic model of maximizing social welfare as an objective [3]. The DR model has been developed under the incentive and the penalty in [4] so that the behavior of customers under the DRP types is fully modeled. The simulation results on a real network and the test network indicate the improvement of energy and load peak technical characteristics in different scenarios than the base state. In [5], the reliability model of the demand response source is constructed according to customers’ behaviour, such as conventional production units, in which access and inaccessibility are made with two-state and multi-state models.
In this way, the reduction in demand due to the application of demand response programs is considered equivalent to conventional production resources. The results improve DR availability compared with increasing the DR value for increasing the system reliability. The reference [6] explores DR effects on the household distribution networks’ reliability. Numerical results on a distribution network and several probability faults are applied at different points in the network. Indicate that by interrupting a portion of the distribution network due to fault and providing it by manoeuvring points, reliability is improved in all distribution substations by executing DR programs. Study [7] examines demand response management of a network connection with a wind farm. Integration DR and wind farms reduce the potential wind turbine capacity, especially when renewable resources are high.
An improved model for optimal demand response programs is presented in [8]. A honey colony artificial algorithm and a pseudo-static tree scenario technique have been used to solve this optimization problem. Numerical results from these methods indicate that cost savings and reliability improvements smart grids. A two-state optimization framework for customer energy planning and management with battery power systems and demand response programs is presented [9]. This method can help the customer choose more valuable programs to join DR programs. In [10], the TOU program that focuses on consumption is combined with a dynamic supply-side economics dispatch problem. The optimal pricing mix is determined to minimize fuel costs for the power plant and optimal prices at different charge response times. In [11], the impact of emergency demand response programs (EDRP) on the reliability improvement of the power system under failures of generation units was investigated. The [12] strategic behaviour energy service provider (ESP) effective decision model illustrates how the day ahead market power is divided into smart distribution networks. In [13], a case study on DR performance to improve system reliability and maintain network stability on the Pennsylvania, Jersey, and Maryland networks in North America has shown a high impact of DR in adverse weather conditions. It Displays the difference between demand response programs. In [14], the Monte Carlo simulation method has been repeated, and airlines are modeled using seasonal thermal rating (STR) or real-time thermal ratings (RTTR). Wind units are connected to verify the uncertainty of wind energy. The optimal pricing of real-time pricing encourages customers’ participation in electricity market operation in [15]. Different load response programs impact the power system reliability and distribution networks by methods such as Monte Carlo-Security restrictions models. The fault analysis model – Two-state models for planning and operation of a customer-algorithm Bee colony artificial – Models based on statistical elasticity - Considering customer behavior in DR programs as conventional sources by researchers in literature. What has not been studied is optimal prices for demand response programs to improve distribution network reliability. The current topic of the TOU program is discussed in this article.
2 The Linear Demand Response Model
Demand response programs can reduce high energy prices in power markets or improve power system reliability. In this research, the effect of demand response programs and consumer participation on reliability improvement is examined—the US Department of Energy (DOE) definition of Demand Response. As follows: The change in the consumer’s electricity consumption of the normal amount of consumption pattern in response to a change in the price of electricity over time or the cost of the incentive definition to reduce power consumption in times of market power or system reliability [16]. In this paper, the linear load model for demand response is used in (1) [16].
| (1) |
Where d(i) is load amount after the demand response program [kWh]. d0(i) is load amount before demand response program [kWh]. P(i) is the Electricity price after the demand response program. P0(i) is the price of electricity before demand response program implementation; A (i) is the customer reward for executing the demand response program at i [$/kWh]. Pen(i) is a penalty at i [$/kWh]. E(i,i) is the price of self- elasticity, and E(i,j) is the price of cross-elasticity of the i-th period versus the j-thperiod. In time-based applications such as the TOU used in this research, electricity prices vary depending on the cost of supply for different times.
For example, the high price in the peak time, the average price in off-peak time, and the low price in low load time. Time-based programs have no penalty and rewards [17]. Thus, Equation (1) can be rewritten as in (2):
For the TOU demand response program, Equation (2) can be written as Equation (3) for three different time periods.
Where in (3):
| (3) |
: The number of hours in low load period
: The number of hours in off-peak period
: The number of hours in peak period
: Electricity prices in low load period
: Electricity prices in off-peak period
: Electricity prices in peak period
: Self-and cross elasticities
3 Reliability Indicators
3.1 Expected Energy Not Served (EENS)
Expected energy not served is the amount of energy that is not supplied due to power outages at customer points. Electric companies to assess the economic strength and power system reliability uses the EENS index [18]. The EENS index is calculated according to (4):
| (4) |
Where k is the average failure rate of the customer at the k point, rk is the failure time at the k load point, Lk is the average load at the load point k [MW], and n is the load points.
3.2 Expected Interruption Cost (ECOST)
The expected Interruption cost index indicates the reliability of the system financially. According to (5) [19], this index depends on the failure rate, load amount, and customer interruption cost.
| (5) |
Where is the average failure rate of the customer at the point, is the average load at the load point k [MW], is the cost of customer interruptions during the interruption time ($/KW) and n is the load points.
The cost of customer interruptions is difficult and subjective, requiring significant information from each customer and distribution system. The cost of customer interruptions includes economic costs of power outages in various customers; these costs include unpaid worker wages, equipment damage, loss of sales, food spoilage, in-product deterioration, cost of generators, and other commercial costs. Household customers are also affected by the loss of well-being, equipment failure, and food breakdown [20]. The cost of customer interruption can be described as the customer’s loss function, which is a function of the load type and interruption duration. Table 1 shows an example of the values of the Canadian customer’s loss compensation function in terms of the type of load and the duration of the interruption.
Table 1 An example of the value of the customer loss function for Canada ($/KW) [21]
| Interruption Time | Agricultural | Commercial | Residential | Industrial | Gov. |
| 2 sec | 0.232 | 0.782 | 1.21 | ||
| 1 min | 1.63 | 1.87 | |||
| 20 min | 0.0487 | 4.83 | 0.0241 | 2.67 | 2.39 |
| 1 hr | 0.243 | 13.0 | 0.141 | 5.65 | 5.30 |
| 2 hr | 27.3 | 10.0 | |||
| 4 hr | 2.02 | 65.7 | 1.57 | 20.6 | 15.6 |
| 8 hr | 5.64 | 106 | 3.46 | 38.1 | |
| 1 day | 127 | 15.8 | 60.7 |
4 Formulation
The main objective of this research is to minimize distribution system power outage costs. For this reason, the objective function of [18] is developed in this paper. The objective function to evaluate the demand response effect of on distribution network reliability and obtain optimal electricity prices can be written as (6):
| (6) |
Where suffix 0 represents before implementing the demand response program and suffix DR represents after implementation of the demand response program.
Because the objective function is cost-effective, the EENS index must be converted into cost, ke coefficient, which is the cost of energy not supplied (CENS), is used to convert EENS units from MWh/yr to $/yr. This objective function maximizes savings costs by comparing the indices before and after the demand response program with optimized prices.
Lk in EENSDR and ECOSTDR is the average annual load at k point after executing the demand response program. It is obtained from Equation (7):
| (7) |
Where:
Lk: Average annual load in kWh (kWh).
: The amount of load on day d and hour i with electricity price Pm (kW)
The constraints of the objective function are as follows:
i. Load constraints
| (8) |
This constraint specifies the upper and lower limit of power at load points.
ii. Price constraints
| (9) | ||
| (10) |
Where:
P: Electricity price
Plow load: Electricity prices in low load period
Poff-peak: Electricity prices in off-peak period
Ppeak: Electricity prices in peak period
Equation (9) represents the minimum, and maximum prices, and Equation (10) shows the price situation at low load, off-peak, and peak periods.
Table 2 Self-and cross elasticities [17]
| Peak | Off-peak | Low load | |
| Peak | 0.10 | 0.016 | 0.012 |
| Off-peak | 0.016 | 0.10 | 0.01 |
| Low load | 0.012 | 0.01 | 0.10 |
5 Numerical Simulation Results
Simulation on the Roy Billinton Test System (RBTS) modified network is done by programming in the GAMS software. Then the calculated reliability indices are extracted and evaluated for different scenarios. Bus 2 of the RBTS test system has been selected as the distribution network studied in this paper. Bus 2 is a radial distribution network with 4 main feeders and 22 load points, and peak load of 20 MW. Other data from the test network is extracted from [22].
The self-and cross-elasticity values for the TOU demand response program are selected according to Table 2. According to the information provided on Tavanir website in 2018, the basic price of electricity in Iran is 0.0049 $, and the price of electricity at low load, off-peak and peak periods is 0.00245 $, 0.0049 $ and 0.0098 $, respectively.
Simulation in this research is based on the following assumptions:
– Feeders are radial.
– There are two tie switches at the end of the feeders 1 and 2 and the feeders 3 and 4.
– In the event of failure, the transformers will be repaired.
– Ignored from any faults in the 33 kV station and the 11/33 transformers and 11 kV breakers.
– The reliability of the upstream network is considered being 100%.
For this simulation, 2 scenarios are defined below:
Scenario 1: Basic mode without demand response program
Scenario 2: Implementing the TOU demand Response Program
The results of implementing 2 scenarios defined is inserted for 0.00245 $ for low load hours (24–6 hours) and 0.0049 $ for the off-peak period (7–13 hours) and 0.0098 $ for the peak period (14–23 hours) in Table 3.
Table 3 Simulation results for different scenarios and prices
| Base Case | With DR | |
| EENS (kWh/yr) | 37745 | 27048 |
| ECOST ($/yr) | 94607 | 67795 |
| Cost Saving ($) | 0 | 85646 |
| Improved EENS (%) | – | 28.338 |
| Improved ECOST (%) | – | 28.339 |
Table 4 Maximum and minimum pricing ($)
Table 5 The optimal price values obtained for each time period
| Periods | Price ($) |
| Low load | 0.00367 |
| Off-peak | 0.00735 |
| Peak | 0.00980 |
According to Equation (2), implementing the TOU demand response program reduces the distribution network demand. As a result, the reduction of the demand and the amount of load (Lk), under Equations (4) and (5), decreases the EENS and ECOST indices and improve reliability. In the next step, by specifying the price constraints of Equation (9), which is initialized in Table 4, the optimal price values are obtained in Table 5. The values of reliability indices with optimal prices are shown in Table 6.
Table 6 Values of reliability indices in different scenarios for optimal prices
| Base Case | With DR | |
| EENS (kWh/yr) | 37745 | 23725 |
| ECOST ($/yr) | 94607 | 59467 |
| Cost Saving ($) | 0 | 112248 |
| Improved EENS (%) | – | 37.141 |
| Improved ECOST (%) | – | 37.142 |
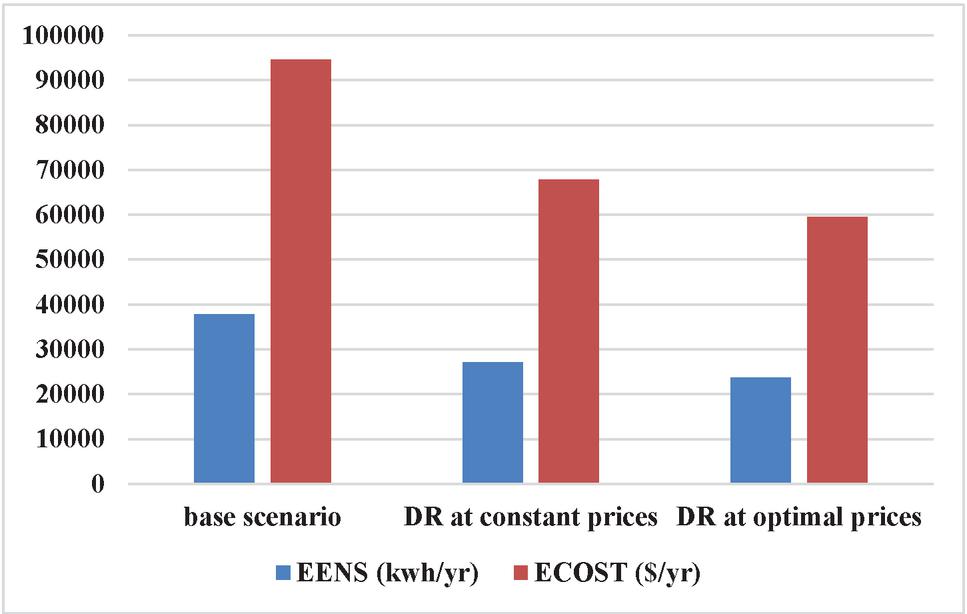
Figure 1 Comparison of reliability indicators in different scenarios.
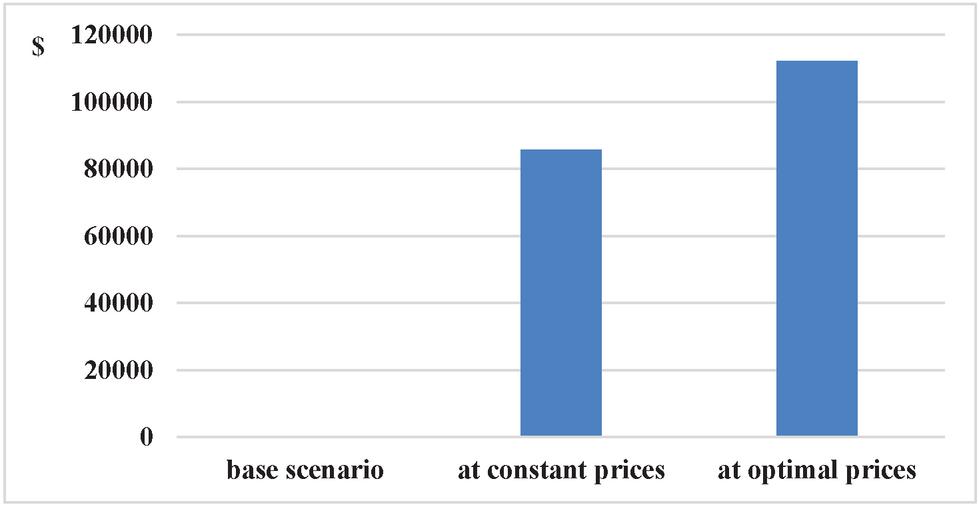
Figure 2 Comparison of saving costs in different scenarios.
Comparing Tables 3 and 6, decreasing reliability indices and increasing the cost-saving at optimal prices are shown in Table 6. Figures 1 and 2 show the values of indices in different scenarios and the amount of cost savings. In the second scenario, there is an improvement in reliability indices and an increase in cost savings relative to the baseline scenario. In the second scenario, due to demand response program implementation, the average annual power of load points will decrease, which will reduce the reliability indexes.
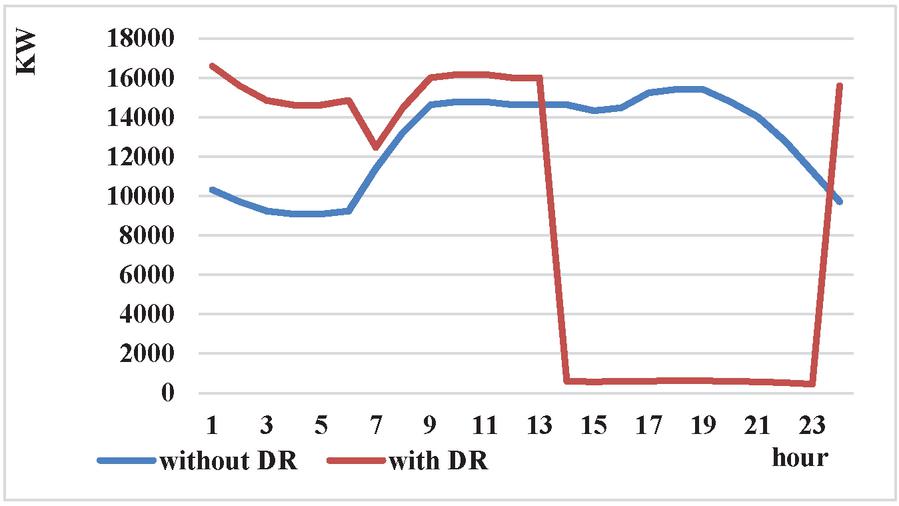
Figure 3 The effect of the TOU demand response program on the total daily load curve at prices of 0.00245 $, 0.00490 $ and 0.00980 $.
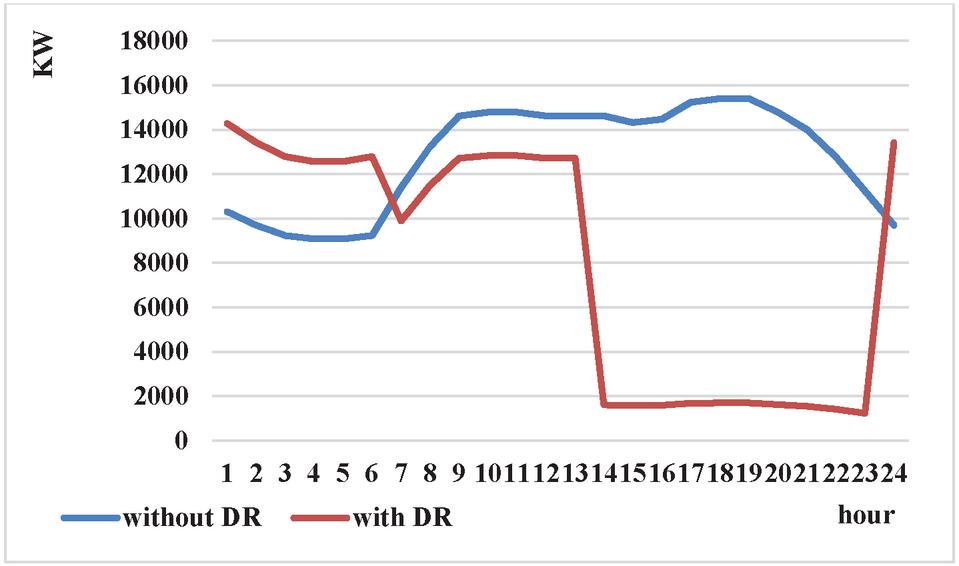
Figure 4 The effect of the TOU demand response program on the total daily load curve at optimal prices.
In Figure 3, the effect of the demand response program with prices of 0.00245 $, 0.00490 $, and 0.00980 $ for different periods are shown on the daily load curve. Although implementing demand response programs has led to a significant reduction in peak hours, consumption in low load and off-peak periods is increased.
Figure 4 illustrates the TOU program implementation impact on the daily load curve of the entire distribution network with optimized prices. Implementing a demand response program at optimal prices and reducing consumption in the peak period, decreasing consumption in other courses, and decreasing the average daily consumption are observed.
6 Conclusion
In this paper, the reliability of the distribution network was evaluated by implementing the TOU demand response program. The linear model of the demand response program was used, and the electricity price was based on the prices of the low load-off-peak and peak periods in 2018 in Iran. Simulations were performed on the Roy Billinton Test System (RBTS) using GAMS software. The simulation results show the reduction of the EENS and ECOST indices and improve the distribution network’s reliability by implementing the TOU demand response program due to the reduction of average load. Next, optimal prices were obtained for three different periods: low load, off-peak, and peak. The results of studies on the test system show that implementing a TOU demand response program at optimal prices improves reliability and reduces the distribution network’s daily load curve during peak and off-peak hours. It is recommended for future research to investigate other demand response models such as nonlinear, logarithmic, exponential models and compare them with linear models. Also, evaluate other demand response programs.
References
[1] Wang, P., Y. Ding, and Y. Xiao, Technique to evaluate nodal reliability indices and nodal prices of restructured power systems. IEE Proceedings-Generation, Transmission, Distribution, 2005. 152(3): p. 390–396.
[2] Joung, M. and J. Kim, Assessing demand response and smart metering impacts on long-term electricity market prices and system reliability. Applied Energy, 2013. 101: p. 441–448.
[3] Yang, W., R. Yu, and M. Nambiar, Quantifying the benefits to consumers for demand response with a statistical elasticity model. IET Generation, Transmission, Distribution, 2014. 8(3): p. 503–515.
[4] Nikzad, M. and B. Mozafari, Reliability assessment of incentive-and priced-based demand response programs in restructured power systems. International Journal of Electrical Power Energy Systems, 2014. 56: p. 83–96.
[5] Kwag, H.-G. and J.-O. Kim, Reliability modeling of demand response considering uncertainty of customer behavior. Applied Energy, 2014. 122: p. 24–33.
[6] Safdarian, A., et al., Distribution network reliability improvements in presence of demand response. IET Generation, Transmission, Distribution, 2014. 8(12): p. 2027–2035.
[7] Cicek, N. and H. Delic, Demand response management for smart grids with wind power. IEEE Transactions on Sustainable Energy, 2015. 6(2): p. 625–634.
[8] Safamehr, H. and A. Rahimi-Kian, A cost-efficient and reliable energy management of a micro-grid using intelligent demand-response program. Energy, 2015. 91: p. 283–293.
[9] Wang, Z. and Y. He, Two-stage optimal demand response with battery energy storage systems. IET Generation, Transmission, Distribution, 2016. 10(5): p. 1286–1293.
[10] EhsanDehnavi and HamdiAbdi, Optimal pricing in time of use demand response by integrating with dynamic economic dispatch problem. Energy, 2016. 109: p. 1086–1094.
[11] Aghaei, J., et al., Contribution of emergency demand response programs in power system reliability. Energy, 2016. 103: p. 688–696.
[12] Mahboubi-Moghaddam, E., M. Nayeripour, and J. Aghaei, Reliability constrained decision model for energy service provider incorporating demand response programs. Applied Energy, 2016. 183: p. 552–565.
[13] Wang, F., et al., The values of market-based demand response on improving power system reliability under extreme circumstances. Applied energy, 2017. 193: p. 220–231.
[14] Kopsidas, K., A. Kapetanaki, and V. Levi, Optimal demand response scheduling with real-time thermal ratings of overhead lines for improved network reliability. IEEE Transactions on Smart Grid, 2017. 8(6): p. 2813–2825.
[15] Jiangfeng Jiang, Yu Kou, Zhaohong Bie, Gengfeng Li, Optimal Real-Time Pricing of Electricity Based on Demand Response. Energy Procedia, 2019. 159: p. 304–308.
[16] Energy, U.D.O., Benefits of demand response in electricity markets and recommendations for achieving them. 2006.
[17] Aalami, H., M.P. Moghaddam, and G. Yousefi, Demand response modeling considering interruptible/curtailable loads and capacity market programs. Applied energy, 2010. 87(1): p. 243–250.
[18] Adefarati, T. and R. Bansal, Reliability assessment of distribution system with the integration of renewable distributed generation. Applied energy, 2017. 185: p. 158–171.
[19] Allan, R.N., Reliability evaluation of power systems. 2013: Springer Science & Business Media.
[20] Leite, J.B., et al. The impact of time series-based interruption cost on online risk assessment in distribution networks.in Transmission & Distribution Conference and Exposition-Latin America (PES T&D-LA). 2016. IEEE PES.
[21] Casteren, J.v., Assessment of Interruption Costs in Electric Power Systems using the Weibull-Markov Mode. Ph.D. Thesis, 2003, Chalmers University of Technology.
Biographies

Mehrdad Tahmasebi received his bachelor’s degree in Power Electrical Engineering from Islamic Azad University, South Tehran branch, Iran in 2002, and the master’s degree in Power Electrical Engineering (Electrical Energy Management) from the Amirkabir University of Technology, Tehran, Iran in 2010. He received Ph.D. degree in Power Electrical Engineering from The National Energy University of Malaysia in 2015. Currently, he is an Assistant Professor in the Department of Electrical Engineering, Islamic Azad University (Ilam Branch). His research interests include power system operation, microgrid, renewable energy, system reliability and demand side management.

Jagadeesh Pasupuleti is the Head of Hybrid Renewable Energy Systems, Institute of Sustainable Energy, Universiti Tenaga Nasional, Malaysia. He is a Senior Member of IEEE (USA), Member of IET (UK), Chartered Engineer (UK), Professional Review Interviewer for CEng (UK), Member of EI (UK), Member of BEM (Malaysia) and Member of ISTE (India). He has supervised 30 postgraduate students, published over 100 papers and involved in 50 research and consultancy projects funded around $3 million in renewable energy.

Hamed Foodaji received the master of power system engineering from Islamic Azad university in 2019. His research interests include power system operation, system reliability and demand side management.

Mohammad Tolou Askari received his bachelor’s degree in Power Electrical Engineering from University of Applied Sciences and Technology of Mashhad in 2005, and the master’s degree in Power Electrical Engineering in 2008. He received Ph.D. degree in Power Electrical Engineering from Universiti Putra Malaysia in 2014. Currently, he is a senior lecturer in the Department of Electrical and Electronics Engineering, Faculty of Engineering, Islamic Azad University.
Distributed Generation & Alternative Energy Journal, Vol. 37_5, 1417–1432.
doi: 10.13052/dgaej2156-3306.3756
© 2022 River Publishers