A Study of Encapsulation Temperature Field of Dry-type Air-core Reactor with the Structure of Equivalent and Aluminum Wire-Insulation
Xiaorong Wan1, 2, Han Wang1, Yingna Li1, 2, Chuan Li1, 2,*, Zhengang Zhao1, 2 and Zhigang Cui3
1Faculty of Information Engineering and Automation, Kunming University of Science and Technology, Kunming 650500, China
2Yunnan Key Laboratory of Computer Technology Applications, Kunming 650500, China
3Electric Power Research Institute of Yunnan Power Grid Co. Ltd, Kunming 650217, China
E-mail: 1625677252@qq.com
*Corresponding Author
Received 10 August 2021; Accepted 24 August 2021; Publication 24 June 2022
Abstract
During the operation of the Dry-type Air-core Reactor (DAR), the insulation material deteriorates due to local overheating of the encapsulation, and the reactor is burned in severe conditions. Therefore, studying the temperature rise of the reactor plays an important role in the reliability of its operation and the economy of design and production. According to the structural characteristics of the reactor, the three-dimensional thermal field model of the aluminum wire-insulation structure of the reactor is established, and the encapsulation temperature field distribution of the reactor under steady state is obtained. Compare the simulation result with the encapsulation temperature field distribution of the equivalent structure. The results show that the highest temperature of the aluminum wire-insulation structure encapsulation rises to 73.51C, which is located in the middle of the reactor. Each encapsulation hotspot is located about 20% from the upper edge of the encapsulation. In the temperature rise test, a Fiber Bragg Grating (FGB) temperature sensor is installed about 20% from the upper edge of the encapsulation. The test shows that the most significant value of temperature rise of the reactor is 73C, which is located in the middle of the reactor. The temperature rise test results verify the accuracy of the simulated calculation value of the temperature field of the aluminum wire-insulated reactor and provide a reference for the temperature rise calculation and temperature rise monitoring of the DAR.
Keywords: Dry-type air-core reactor, aluminum wire-insulation structure, hotspot, Fiber Bragg Grating temperature sensor.
1 Introduction
Hydropower is one of the most eco-friendly renewable energy technologies. Now most substations of 110 kV and above use the Dry-type Air-core Reactor (DAR) for compensation to achieve local compensation and local balance to ensure the safe operation of the hydropower plants system (Levieux et al., 2019; Ricardo et al., 2018; Seyedi and Tabei, 2012). However, according to Montsinger’s law, when an insulating material operates under a temperature exceeding a threshold, it will rapidly deteriorate (H. Nie et al., 2019; Zhang et al., 2013; Zhao et al., 2013). After operating for a period of time, many DARs will suffer surface dendrite discharge, partial burning, and even burning up (Seyedi and Tabei, 2012). It is mainly due to that the local temperature in the dry resistance is too high and the temperature rise of the windings of each layer is not uniform (differ by a dozen degrees or even more). During the operation, the energy losses generated by the DAR are converted into heat such that the resistance loss and additional loss in each layer of the conductor constitute the heat source of the DAR. The DAR forms a space-dependent temperature distribution through heat dissipation, natural convection and radiation (J. Rodríguez D et al., 2020; P. Gning et al., 2020). In terms of the temperature rise of DARs, Deng et al. established a two-dimensional thermal field model that regards the reactor encapsulation as an aluminum-epoxy mixed equivalent layer and an insulating mixed equivalent layer. The pick value of temperature of the reactor is in the middle encapsulation (Deng et al., 2013). Wang et al. established a three-dimensional temperature field simulation model of the DAR using the FEM, considering the influence of the star frame and rain cap on the temperature rise of the reactor. The temperature rise test of the prototype verifies the accuracy of the calculation method (Wang et al., 2017). Yuan et al. treated the encapsulation as an isotropic material and considered the rain cap to establish a heat-flow coupling model. The temperature rise of a DAR is achieved. (Yuan et al., 2018).
In the modeling of reactors, the commonly used method is to treat the encapsulation (including aluminum wire and insulating material) as the isotropic material. The thermal conductivity of the aluminum wire and the insulating medium are quite different, and the different thermal conductivity leads to different thermal resistances in the encapsulation. In this paper, a three-dimensional thermal field model of a DAR with an aluminum wire-insulating material structure is established. The temperature field distribution of each encapsulation of the DAR is obtained, and compared the test results with the simulation results.
Methods
This section presents three parts: (1) the DAR structure description, (2) the reactor temperature field calculation modeling, and (3) the finite element simulation modeling.
1.1 DAR Structure
A DAR has multiple layers of encapsulation. Each layer of encapsulation is formed by winding multiple strands of aluminum wires in parallel. The inner and outer walls of the encapsulation are all surrounded by glass ribbons impregnated with epoxy resin, and a certain width of air passage is left between the encapsulation for heat dissipation. Figure 1 shows the parallel structure of the multi-cylinder coaxial winding of the DAR. Figure 2 shows the encapsulated cross-sectional structure.
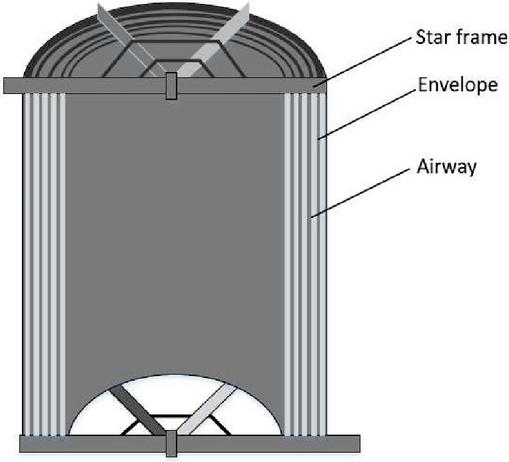
Figure 1 Internal structure.
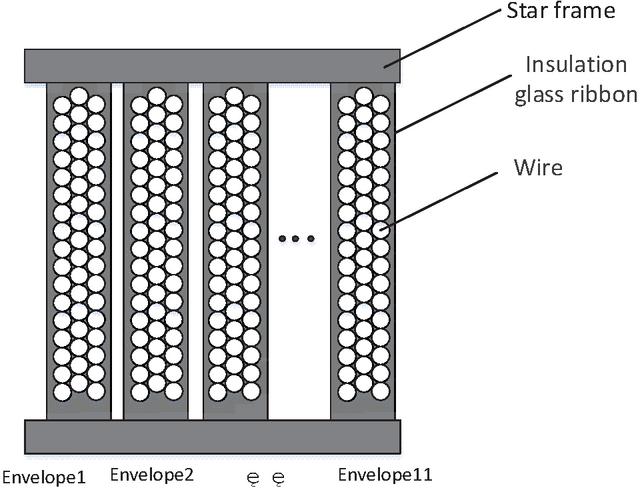
Figure 2 Profile structure of encapsulations of dry-type air-core reactor.
1.2 Reactor Temperature Field Calculation Model
Reactor resistance heat generation P mainly includes aluminum wire resistance loss P and eddy current loss P (Yan et al., 1999).
| (1) |
where the eddy current loss P in the reactor is generally 0.8 to 1 times the resistance loss, and the average value is 0.9 times here.
The temperature field of the DAR is a stable temperature field with internal heat source axis symmetry, and the temperature distribution at each point will no longer change after the power supply is stabilized. In cylindrical coordinates, the temperature distribution formula is as follows:
| (2) |
where is the strength of the heat source in the reactor, is conductivity coefficient of air, h is the heat transfer coefficient, and is the ambient air temperature.
The local convective heat transfer coefficient h is a variable, which can be calculated by the following formula (Incropera and Dewitt, 1988):
| (3) |
where is the local Nusselt coefficient, and h is the variable related to the variable z. For accurate solution, the encapsulation can be divided into m equal parts from the bottom to the top along the height z, and the corresponding (i 1, 2, 3,…, m) can be calculated.
Finite Element Simulation Model
The 35 kV parallel DAR with a capacity of 20000 kvar has a total of 11 encapsulations, and the rated current is 990 A. The encapsulation height is z 1.9 m, the maximum radius is r 1.4 m. In order to find the distribution law of the temperature field inside the reactor, and to simplify the calculation, the reactor is divided into 6 encapsulations on average. The inner to the outer encapsulation are numbered 1 to 6. Two structural models are established as shown in Figure 3. The thermal conductivity of aluminum wire and insulating material is significantly different. Two structural models are established. Figure 3(b) shows the encapsulation structure model composed of aluminum wires and insulating materials. Figure 3(c) shows the structural model of the encapsulation equivalent to the same material.
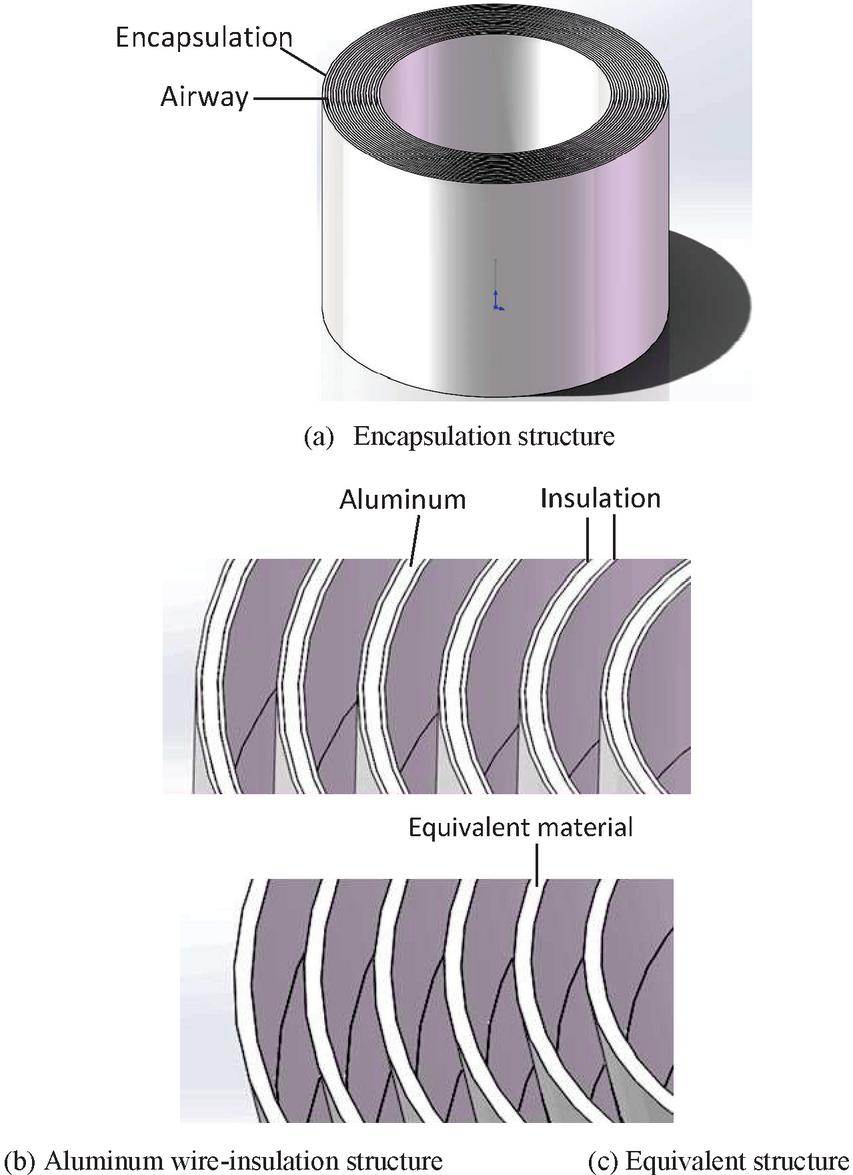
Figure 3 Reactor encapsulation structure.
For a single encapsulation, it is equally divided into 5 equal parts from bottom to top according to the height. Select the corresponding local Nusselt coefficient N, and calculate the local heat transfer coefficient hi of the sixth encapsulation according to Equation (3), h, h, h, h, h. Other encapsulated convective heat transfer coefficients can also be calculated by Equation (3). The ambient temperature is 27C. The parameters of materials include (conductivity coefficient), c(heat capacity), (density) are listed in Table 1.
Table 1 Parameters of materials
| Materials | Air | Aluminum Wire Layer | Insulation Layer |
| (WmK) | 0.0242 | 273 | 0.5 |
| (kgm) | Varies with temperature | 2700 | 2200 |
| c (JkgK) | 1006.43 | 880 | 500 |
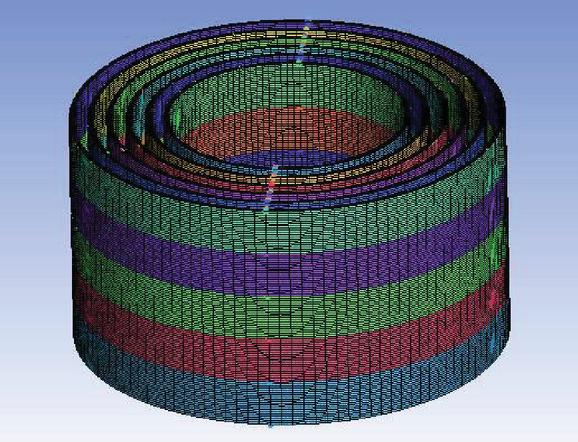
Figure 4 Reactor envelope meshing.
Results
The reactor is meshed by using ICEM. Firstly, the O-block is used to dicing the encapsulation of the reactor, and then splitting it to realize all the structured grids. After division, the number of mesh model units is 2,130,912, the number of nodes is 1,545,264, and the mesh quality is 0.9. As shown in Figure 4.
Simulation Result Analysis
With the parameters given in Table 1, the temperature distribution of DARs with two structures can be calculated as shown in Figure 5. Figure 5(a) is the aluminum-insulation structure temperature distribution. the hotspot temperature of the aluminum wire of the reactor is in the fourth encapsulation, which is the middle encapsulation of the reactor, and the temperature is 100.51C; The insulation hotspot temperature is in the fourth encapsulation, and the hotspot temperature is 100.32C. The highest temperature of each layer of encapsulation is in the aluminum wire part, and the lowest temperature is in the insulating material part. The temperature attenuation difference between aluminum wire and insulation is 0.03C0.15C. As shown in Figure 6. Figure 5(b) is the equivalent structure temperature distribution. the hot spot temperature of the reactor is in the fourth encapsulation,which is near the top of the encapsulation. The hotspot temperature is 67.73C Figure 7 depicts the temperature distribution along the vertical direction in the aluminum wire-insulation structure. The reactor hotspot is in the 4th encapsulation. The temperature is 100.51C, and the encapsulation height is about 1.56 m. The maximum temperature of each encapsulation of the reactor is about 20% from the upper edge of the encapsulation.

Figure 5 Temperature distribution of the DAR.

Figure 6 Temperature distribution for insulation and aluminum wires of encapsulation 4.
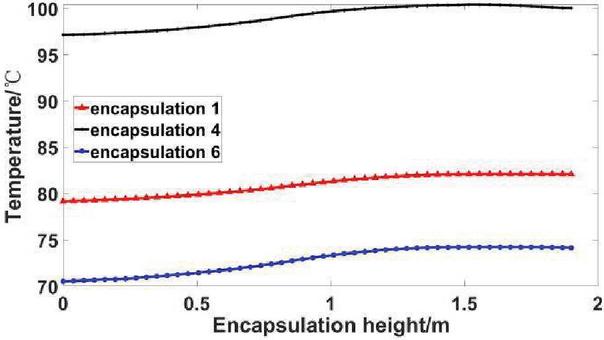
Figure 7 Temperature distribution along the vertical direction for encapsulation 1, 4 and 6 in the aluminum wire-insulation structure.
Comparison of Simulation and Experiment Results
Taking advantage of the fiber-grating sensor’s good insulation and resistance to electromagnetic field interference, an embedded fiber Bragg grating temperature sensor has been developed for the typical structure of the coaxial multiple encapsulation of the dry-type air-core reactor (Zhou et al., 2015). The 35 kV parallel dry-type air core reactor in the test has an enveloping height of 190 cm and a total of 11 envelopes. The test measures the hotspot temperature of the first, third, sixth, seventh, ninth and eleventh layers of encapsulation. According to the simulation results, the hotspot is slightly more than 20% away from the envelope, that is, about 40 cm from the upper edge of the envelope. In the process of wrapping and enveloping, first coat a layer of gray insulating rubber with an area of about 5 cm 43 cm to the upper edge of the outer envelope; then embed the fiber grating temperature sensor along the 40 cm area from the envelope. Then cover a layer of 15 cm 45 cm mesh cloth, and take out the sensor’s pigtail; finally, use a glass ribbon to wrap. After the reactor embedded in the fiber Bragg grating sensor is heated and solidified by the heating furnace, the entire winding is encapsulated to form a solid whole. Figure 6 shows the principle and physical diagram of the temperature rise test to detect the temperature changes of the various layers of the reactor. As shown in Figure 8, the broadband light is injected into the fiber Bragg gratings via a circulator, then the lights reflected from the gratings are returned. The peak detection is employed to determine where the photo-detector receives the maximum back-reflected light from the FBG sensor. The wavelength measurement accuracy of the modulator is 1 pm.
In the temperature rise test, the highest operating voltage of 23.5 kV is applied to the reactor. The maximum operating current is 1135 A under a continuous pressurization for 6 h. Finally it is powered off for 2 h. The ambient temperature during the test is 27C.
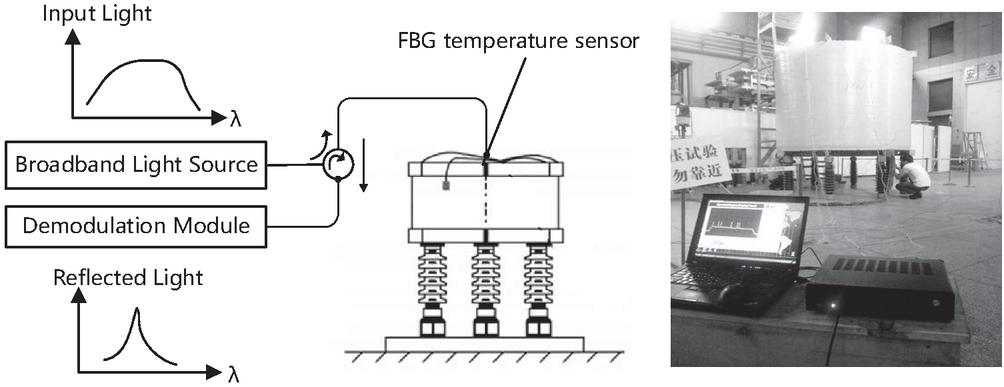
Figure 8 Principle of temperature rise monitoring and physical of dry-type air-core reactor.
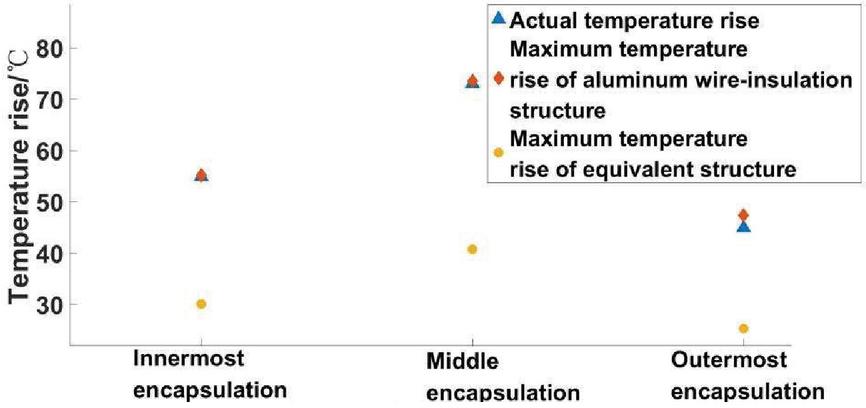
Figure 9 Comparison of encapsulation stable temperature rise in the test and the simulation.
In the temperature rise test, the encapsulation temperature takes 5 hours to reach a stable state, and the stabilized temperature value is compared with the maximum encapsulation temperature value obtained by simulation. As shown in Figure 9. The highest temperature of the measured DAR is located in the middle encapsulation of the entire reactor (the 6th encapsulation), the measured temperature rise is 73C. The maximum simulated temperature rise of the aluminum wire-insulation structure encapsulation is located in the middle encapsulation. The temperature rise is 73.51C, which is 0.51C different from the highest measured value; The maximum simulated temperature rise of the equivalent structure is 40.73C, which is 32.27C different from the highest measured value.The experiment shows that the simulated calculation value of the aluminum wire-insulation structure encapsulation temperature adopted in this paper is closer to the measured value.
Discussion
The analysis of the results shows that the reactor hotspot is in the 4th encapsulation, the temperature is 100.51C, and the encapsulation height is about 1.56 m in aluminum wire-insulation structure. In equivalent structure, the hotspot temperature of the reactor is in the fourth encapsulation,which is near the top of the encapsulation. The hotspot temperature is 67.73C.
Conclusions
According to the difference in thermal conductivity between aluminum and insulating materials in the encapsulation, a three-dimensional thermal field model of the aluminum wire-insulation structure of the DAR was established. The simulation results show that the highest temperature of the DAR is located in the middle encapsulation of the entire reactor, and the encapsulation hotspot is about 20% away from the upper edge of the encapsulation. In the temperature rise test, a fiber Bragg grating temperature sensor is installed about 20% (40 cm) from the upper edge of the encapsulation. The temperature rise test shows that the highest temperature of the DAR is located in the middle of the entire reactor. The comparison result shows that the correlation coefficient between the simulated calculated value and the measured value of the aluminum wire-insulation structure encapsulation temperature is 0.995. Taking into account the anisotropy caused by the difference in thermal conductivity of different materials in the encapsulation, it provides a more accurate monitoring location for the temperature rise monitoring of the reactor.
Acknowledgments
This work is partially supported by the National Natural Science Foundation of China (61962031 and 51667011), and the Applied Basic Research Program of Yunnan (2018FB095).
References
[1] Deng, Q.; Li, Z. B., and Yin, X. G. et al., 2013. Steady Thermal Field Simulation of Forced Air-Cooled Column-Type Air-Core Reactor. High Voltage Engineering, 39(4): 839–844.
[2] H. Nie, X. Liu, Y. Wang, Y. Yao, Z. Gu, and C. Zhang, 2019. Breaking overvolt-age of dry-type air-core shunt reactors and its cumulative effect on the interturn insulation. IEEE Access 7, 55707–55720.
[3] Incropera, F.P. and Dewitt, D.P., 1988. Fundamentals of Heat and Mass Transfer. Wiley, 290–293.
[4] J. Rodríguez D, G. Alonso Orcajo, J. M. Cano, J. G. Norniella, and A. Vicente, 2020. Thermal analysis of dry-type air-core coils for the optimization of passive filtering systems. Energies 13, 4540.
[5] Levieux, L. I., Inthamoussou, F. A., and De Battista, H., 2019. Power dispatch assessment of a wind farm and a hydropower plant: A case study in Argentina. Energy Conversion and Management, 180, 391–400.
[6] P. Gning, V. Lanfranchi, and N. Dauchez, 2020. Influence of the multi-component electrical feed of air-core industrial reactors on their sound radiation. Acta Acust. 4, 14.
[7] Ricardo Manuel Arias Velásquez, and Jennifer Vanessa Mejía Lara, Life estimation of shunt power reactors considering a failure core heating by floating potentials, Eng. Fail. Anal. 86 (2018) 142–157.
[8] Seyedi, H. and Tabei, B., 2012. Appropriate Placement of Fault Current Limiting Reactors in Different HV Substation Arrangements. Circuits and Systems, 3(3): 252–262.
[9] Wang, Y., Chen X.Y., and Pan Z.H. et al., 2017. Theoretical and Experimental Evaluation of the Temperature Distribution in a Dry Type Air Core Smoothing Reactor of HVDC Station. Energies, 10(5):617–621.
[10] Yan, H., Guo, Y.J., and Lin, Z.Z., 1999. Simulation Research on Internal Temperature Field Distribution of Resin Insulated Dry-type Transformer. Journal of Tsinghua University. 39(7):1–4.
[11] Yuan, F.T., Yuan, Z., Wang, Y., Liu, J.X., He, J.J., and Pan, Y., 2018. Thermal Optimization for Nature Convection Cooling Performance of Air Core Reactor with the Rain Cover. IEEJ Transactions on Electrical and Electronic Engineering, 13(7):995–1001.
[12] Zhang, Y. J., Huang, X. F., Hu, G., Huang, T., and Ruan, J. J., 2013. Calculation of Temperature Rise in Dry-type Air-core Reactors Using Strong Coupling of Fluid-Temperature Field. Research Journal of Applied Sciences, 5: 2941–2945.
[13] Zhao, Y., He, J. J., Pan, Y., Yin, X. G., Ding, C., and Ning, S. F.. Thermal Analysis of Air-Core Power Reactors. ISRN Mechanical Engineering, 2013: 1–6.
[14] Zhou, Y.H. and Zhao, Z.G. et al., 2015. Research on Temperature Measurement of Fiber Bragg Gembedded in 35kV Dry-type Air-core Reactor. Journal of Electrotechnical Technology. (30):142–146.
Biographies

Xiaorong Wan was born in Hubei, China, in 1979. She received the M.Sc. degree from Kunming University of Science and Technology, Kunming, China, in 2006. She is currently a Lecturer with Faculty of Information Engineering and Automation, Kunming University of Science and Technology, China, Her research interests mainly include micro-electro-mechanical system, intelligent information processing.

Han Wang was born in Jilin, China, in 1994. She is currently pursuing the Master of Engineering degree with the Faculty of Information Engineering and Automation, Kunming University of Science and Technology, Kunming, China. She is presently working in the fields of optical fiber sensors and measurement technology.

Yingna Li was born in Yunnan, China in 1973. She received a master’s degree from Kunming University of Science and Technology, Kunming, China in 2009. She is currently a professor with the School of Information Engineering and Automation, Kunming University of Science and Technology, China. Her research interests include industrial Internet of things and fusion computing, data mining and data processing.

Chuan Li was born in 1971. In 2002, he was entitled Ph.D of optical engineering from Tianjin University. At Sep. 18th, 2002, he was awarded WANG DAHENG’S OPTICAL PRIZE of the Chinese Optical Society, 2001. In 2008, he was entitled a leader of science and technique leader in Yunnan province. Nowadays, he is a professor of Kunming University of Science and Technology, the PhD supervisor of microelectromechanical system. He has published 3 monographs and 100 journal papers. He has 23 accredited patents. His current research interests involve in measurement technique and system, data processing and calculation.

Zhengang Zhao was born in Inner Mongolia, China, in 1981. He received the B.Eng., M.Eng., and Ph.D. degrees in electronic science and technology from the University of Harbin Institute of Technology, Harbin, China, in 2005, 2007, and 2012, respectively. He is currently a professor with the Faculty of Information Engineering and Automation, Kunming University of Science and Technology, Kunming, China. His current research interests include micronano detection technology, optical fiber sensors, and measurement technology.

Zhigang Cui was born in 1964. In 1985, he received a bachelor’s degree from Sichuan University. He is senior engineer (professor-level) with Yunnan Power Grid Co., Ltd. Electric Power Research Institute. His current research interests involve in power system and automation.
Distributed Generation & Alternative Energy Journal, Vol. 37_5, 1665–1680.
doi: 10.13052/dgaej2156-3306.37515
© 2022 River Publishers