Optimal Dispatch of CCHP Microgrid Considering Carbon Trading and Integrated Demand Response
Hong Li* and Lanxin Lin
State Key Laboratory of Alternate Electrical Power System with Renewable Energy Sources, North China Electric Power University, Baoding 071003, China
E-mail: lxy.lh@163.com
*Corresponding Author
Received 06 August 2021; Accepted 24 August 2021; Publication 24 June 2022
Abstract
With the development concept of “low-carbon economy”, both the emission reduction and energy conservation has comes the important development direction of power industry. In this context, we provide a CCHP microgrid optimal dispatching model that considers the integrated demand response and the carbon trading mechanism. This paper presents a carbon trading mechanism into the microgrid model that includes electricity-to-gas equipment. Posteriorly, a price-based power demand response model and a cooling and heating load demand response model that takes into account heating comfort ambiguity are established, and the demand response of cooling, heating and electricity load is constrained through users’ satisfaction. Subsequently, a low-carbon economic dispatching model of the CCHP microgrid with the minimum objective function of the operating total cost including electricity interactive cost, natural gas energy cost, renewable energy abandonment cost, carbon trading cost, power-to-gas operating cost and users’ compensation cost was established. It is solved by the adaptive differential evolution algorithm. In the end, we provide an toy example to illustrate the effectiveness of the proposed microgrid model.
Keywords: CCHP microgrid, integrated demand response, carbon trading mechanism, adaptive differential evolution algorithm.
Introduction
Sustainable development is an important goal that China is committed to achieve. Therefore, China strives to achieve carbon peak by 2030 and carbon neutral by 2060. As one of the main sources of carbon dioxide emissions, the power industry has huge potential for carbon emission reduction. Therefore, it is of great significance to vigorously promote low-carbon power and promote the sustainable development of power [1, 2]. Research on microgrid provides new ideas for the development of low-carbon economy [3]. Based on the energy ladder concept, the cogeneration microgrid improves the comprehensive utilization efficiency of energy [4, 5], promotes the consumption of renewable energy, reduces the consumption of fossil energy on the supply side, and further reduces carbon emissions [6]. Therefore, a cogeneration microgrid with multi-energy synergy is feasible way to achieve China’s carbon emission reduction targets.
There are many researches on low-carbon operation, mainly focusing on the policy level, that is, establishing a carbon trading mechanism. In [7], the authores introduced a carbon trading mechanism into the wind power system, and a low-carbon economic dispatch model is provided. Unfortunately, it is har to strictly control the total amount of carbon emissions for such model.
To further constrain carbon emissions, a stepped carbon trading cost calculation model was developed in recent study [8, 9]. Cui et al. [10] provide a stepped carbon trading mechanism for the source side of the electricity-gas-heat integrated energy system, conduct centralized dispatch, and reduce carbon emissions and system costs. Another attempt considers a stepped carbon trading mechanism in a multi-region integrated energy system connected to the heating network to increase the consumption rate of wind and solar energy and reduce carbon emissions [11]. Such methods of reducing carbon emissions at the source by introducing a carbon trading mechanism does not consider coordination and optimization on the load side, and thus cannot give full play to the low-carbon economy of the system.
In recent years, more and more attention has been paid to the practical application of demand side response. The economy of the system can be signigicantly improved by traditional demand response (DR), which adjust the user’s electricity consumption behavior, and reduce the load peak-to-valley difference.
However, in CCHP microgrid, the load side has many kinds of energy forms including electricity, heat, cold, and so on. The traditional power DR can not fully tap the potential of the demand side, so it is considered to fully coordinate and optimize the integrated demand response (IDR) of different energy sources on the load side. IDR combines energy conversion device, energy storage device and multi energy form load to realize the conversion of different energy types and time transfer, make full use of the controllable potential of multi energy users on the demand side, and realize efficient energy use and promote the consumption of renewable energy. Therefore, Jin et al. [12] constructs a virtual energy storage system model in CCHP building microgrid, and optimizes the scheduling of CCHP building microgrid considering power purchase cost, maintenance cost and users’ temperature comfort; In [13], an integrated energy system model with levelizable load, discountable load, transferable load and thermally flexible load was established to reduce the allocation of energy storage capacity and improve the economy of the system; Cui et al. [14] introduced ground-source heat pumps and electro-thermal demand response into a regional integrated energy system to effectively improve the wind power consumption capacity. In [15], an IDR strategy with load transfer and energy substitution is proposed, which makes full use of the demand side flexibility of intelligent buildings; In [16], an IDR model is established to analyze the influence of controllable electric load and adjustable cooling and heating load on the configuration cost of energy hub; According to the complementarity of cold, heat and electric energy in time and space in [17], the coupling relationship between systems is enhanced, and the stability of industrial park is improved. In [18], a stepped carbon trading mechanism and demand response virtual units were introduced into the wind power system to reduce the energy consumption and carbon emission costs of the system. In addition, the power to gas (P2G) equipment can convert the surplus electric energy generated by wind and solar energy into natural gas for storage and sale, which is equivalent to increasing the power load, and is conducive to improving the ability of microgrid to accept wind and solar energy. In its operation, carbon dioxide is used as raw material, which can help to further reduce carbon emissions [19]. Therefore, the introduction of P2G equipment can further develop the wind and solar energy consumption capacity and low-carbon benefits of microgrid.
The above references only improve the low-carbon economy from a single side or only for a single energy system, and lack of coordination and optimization on both sides of the source and load. Pursuing the former, this paper provides a novel carbon trading mechanism and IDR into CCHP microgrid scheduling model with P2G. First of all, in order to strengthen the carbon emissions constraints, we provide a ladder-type carbon trading mechanism. On this basis, the demand response model of price-based electricity load and the demand response model of heating and cooling load considering thermal inertia and temperature ambiguity are established considering the users’ response intention, and the CCHP type microgrid optimal scheduling model of low-carbon economy is constructed. Then, the adaptive differential evolution algorithm is address the problem at hands. In the end, a toy example is provided to confirm the effectiveness and rationality of the model.
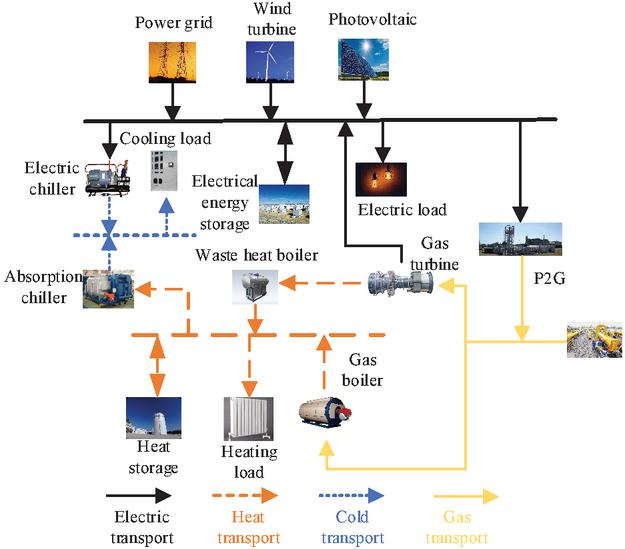
Figure 1 Structure diagram of CCHP microgrid.
1 Structure Design of CCHP Microgrid
The basic structure of the cooling, heating and power triple-supply microgrid constructed in this paper is shown in Figure 1. The model adopts the operation mode of “self-generation and online surplus”, in which the electric load is provided by the grid, distributed wind turbines, photovoltaic generators and gas turbines; the P2G equipment converts part of the electricity to natural gas. Gas-fired boilers (GB) are used for gas turbine waste heat; electric chillers (EC) and absorption chillers (AC) work together to meet the cooling load requirements. Energy storage equipment contains the thermal energy storage (HS) and the electrical energy storage (EES).
2 Carbon Trading Mechanism and Cost Analysis
By establishing a carbon trading mechanism, the government or regulatory authorities can legally establish carbon emission rights and freely trade carbon emissions, thus reducing carbon emissions and improving the environment. Carbon trading quotas are first allocated to each carbon emission source for controlling the total amount of carbon emissions. According to the allocated share, each carbon emission source makes and adjusts its production plan accordingly. Based on the stipulated carbon emission allowances, if the actual emissions are less than the given allowances, the excess allowances will be sold on the market to obtain additional income. In contrast, if the actual emissions are greater than the given allowances, excess emissions allowances ruquire to be purchased from the market to subsidize Environmentally friendly company [19, 20].
Translated with www.DeepL.com/Translator (free version)This paper considers that in the whole CCHP microgrid, the electricity from the grid is generated by thermal power generation, while the carbon emission of natural gas in production and transmission is small, so the carbon emission of natural grid is not considered. Therefore, the carbon emission sources considered in this paper include power grid, GT and GB. The equation of free carbon emission of the system is as follows [21]:
| (1) | |
| (2) | |
| (3) | |
| (4) |
where is the carbon emissions of CCHP at time t; , and are the free carbon quota from thermal power, GT and GB at time t; is carbon emission quota per unit of electricity at time t, is carbon emission quota per unit of heat at time t, is the conversion coefficient of converting unit power generation into unit heating supply; , and are electrical power output of GT, heating power of GT and thermal power output of GB; is the power of the microgrid and the power grid interaction. Since the purchase of power from the grid or to the grid cannot be conducted simultaneously, the interaction state amount n 1 indicates power purchase from the grid, and n 0 means power sale to the grid.
The actual carbon emissions of CCHP microgrid are as follows:
| (5) | |
| (6) |
Where is the actual carbon emissions of CCHP microgrid at time t; , and are the actual carbon emissions of thermal power generation, GT and GB at time t respectively; is the power consumption of P2G equipment, because P2G has the carbon absorption capacity, value is negative; is the carbon capture coefficient, characterizing the carbon capture capability of P2G.
The actual carbon emission of the generator unit or heating unit is proportional to its power generation or heating amount, and Equation (5) is then expressed as:
| (7) |
Where is the carbon emission calculation coefficient of the unit power generation of thermal power units, is the calculated coefficient of carbon emissions in unit heating amount.
In order to strengthen the control of total carbon emissions, this article defines several carbon emissions ranges. When the allocated carbon emission allowances are higher than the actual carbon emission, companies can earn income by selling excess carbon emissions. In addition, if the company’s carbon emissions are reduced to a certain level, a certain subsidy will be given to the company; when the company’s carbon emissions are higher than the allocated carbon emission allowances, it means that the company needs to purchase carbon emission allowances. The larger the carbon emission range, the higher the carbon trading price. The stepped carbon transaction cost calculation model is given as follows:
| (8) |
C is the cost of carbon trading; is the carbon trading price of time t. is the incentive factor for rewarding environmental protection enterprises [20]; is the growth range of the ladder-type carbon trading mechanism; w is the carbon emission interval length.
3 IDR Mathematical Model
Traditional demand response is based on the power interaction between customers and the grid. However, it should be noted that in the combined cooling, heating and power microgrid, the load has multiple forms, e.g., cooling, heating, and electricity. Considering only a single demand response cannot maximize the potential of the demand side. Therefore, in order to meet the integrated demand of customers for multiple loads, the controllability and flexibility of cold, heat and electricity loads should be fully utilized.
Electricity Load Model
Electricity demand response (DR) can be summarized into price response and incentive response. Specifically, price response guides users’ electricity consumption behavior through changes in electricity prices, prompting users to change their electricity consumption in order to achieve the purpose of adjusting the load within a certain period of time. After implementing price-based demand response, the load changes are as follows:
| (9) | |
| (10) |
Where and are the electricity load before and after the optimization at time t, respectively. Among them, when , is a self-elastic coefficient; when , is a cross-elastic coefficient; and are the electricity price before participating in the demand response and the increase relative to the electricity price after participation at time t; and are the electricity amount before participating in the demand response and the increase relative to the electricity amount after participating at time s.
For describing the influence of the changes in electricity usage plans on users, the concept of electricity comfort is introduced. If the users arrange according to the original power consumption plan, the power consumption comfort is the highest at this time; If the power arrangement is adjusted, the greater the gap between the actual electricity usage plan and the user’s original electricity usage plan, the lower the user’s power comfort level. The electric comfort is related to the regulation ability of flexible electricity load, the expression for its model is:
| (11) |
Where T is the scheduling time to participate in demand response; is the users’ electricity comfort with a value range of [0,1], when indicates that it does not change the original electricity mode, that is, the users’ electricity comfort is the greatest. The greater the change in the actual electricity plan, the lower the electricity consumption comfort, and the extreme case of the users is 0.
Temperature Control Load Model
The temperature control load model is mainly aimed at realizing the accurate control of cooling and heating load on the basis of meeting people’s appropriate temperature demand. The establishment of the model is conducive to further analysis of IDR comprehensive demand response model.
Heating Load
The adjustment of heating load is mainly based on the users’ adaptability to temperature, that is, the temperature can be accepted to change within a certain range, which is called the ambiguity of users’ temperature comfort. And the heating system usually has a great delay characteristic, that is, the change of the temperature of the heating medium is affected by the specific heat capacity and quality of the medium, which will lag the change of the temperature of the heat transfer medium in time. The demand response model of heating load is as follows [22]:
Where and are the indoor temperature of heating buildings at time t and t 1, respectively; is the outdoor temperature at time t; c and are the specific heat capacity and density within the building; V is the outer volume of the building, D is the exterior area of the building, and , is a shape factor, is the heat dissipation coefficient of the temperature difference between inside and outside of the heating building.
Temperature is a measure of the way heat is used. In this paper, the predicted mean voltage (PMV) is used to express the users’ acceptance of temperature change.
From reference [16], the comfort of the indoor environment depends on the metabolic rate, the clothing and indoor temperature, so the relationship between PMV () and the indoor temperature is obtained as follows:
| (13) |
Where M is the human metabolic rate, which can be taken as a fixed value, if the human body does not undergo strenuous exercise in the building; is the heat resistance of the human body wearing in a certain season.
According to ISO7730, the range of PMV is [23]:
| (14) |
When the heating load is adjusted, the users’ heat habits have made a certain change. In order to measure the satisfaction of the heat change, the heat comfort is introduced, and the equation refers to Equation (11).
3.1.1 Cooling Load
The adjustment of cooling load is similar to that of heating load. Based on the ambiguity of temperature comfort, the cooling load can be changed by adjusting the set temperature as follows [24]:
| (15) |
Where and are the indoor temperature of cooling buildings at time t and respectively; R and C are equivalent heat capacity and thermal resistance of the cooling buildings.
In summer, the cooling users are mainly the human body, and the indoor temperature can be controlled by PMV index. In winter, the cooling users are mainly the warehouse, and there are certain requirements for the temperature of goods preservation, as follows:
| (16) |
Similarily, the measurement of the users’ cold comfort refers to Equation (11).
4 Optimal Scheduling Model of CCHP Microgrid
Objective Model
The objective function of the CCHP microgrid optimal dispatch model is constructed by total operating cost of the CCHP microgrid, including power interaction cost, natural gas cost, renewable energy abandonment cost, carbon trading cost, P2G operating cost, and customer compensation cost, which is given below:
| (17) |
The electricity cost of interaction between microgrid and power grid is as follows:
| (18) |
Where and are the electricity price of purchase and sale at time t respectively.
The purchasing the natural gas cost is given below:
| (19) |
Where is the unit price of natural gas at time t; and are the power generation efficiency of GT and the heat supply efficiency of GB, respectively.
The cost of renewable energy abandonment is:
| (20) |
Where and are the unit wind abandonment cost and the unit PV abandonment cost, respectively; and are the predicted wind power and PV output, respectively.
The operating cost of P2G can be formulated to:
| (21) |
Where , and are CO coefficient of unit natural gas consumption, unit CO cost, and conversion efficiency of P2G equipment, respectively. The values of , are shown in [25].
The users’ compensation cost after the heating and cooling load demand response is:
| (22) |
Where and are the unit compensation cost of heating and cooling load respectively; and are the heating load difference and the cooling load difference before and after the demand response, respectively.
4.1 Constraints
4.1.1 Equipment output constraints
| (23) |
Where is the power generation efficiency of GT; and are the output thermal power and heat supply efficiency of the waste heat boiler; and are the heat supply efficiency and input power of GB respectively; , and are the output cold power, energy efficiency ratio and input thermal power of AC, respectively; , and are the output cold power, energy efficiency ratio and input electric power of EC, respectively; is the natural gas power generated by the P2G equipment.
4.1.2 Power Balance Constraints
(1) Electricity power balance constraints
| (24) |
Where and are the battery charging power and discharge power.
(2) Thermal power balance constraints
| (25) |
Where and are storage and release power of HS equipment.
(3) Cold power balance constraints
| (26) |
4.1.3 Upper and lower limit constraints of equipment
| (27) |
Where and are the minimum and maximum power of GT; and are the minimum and maximum power of GB, respectively; , and are the maximum power of AC, EC and P2G.
4.1.4 Power interaction constraints
| (28) |
Where and are the minimum and maximum power for microgrid and grid contact line interaction.
4.1.5 Energy storage device constraints
(1) EES constraints
| (29) |
Where and are the storage capacity of battery at time t and t 1; and are the charge and discharge efficiency of the battery, respectively; and are the 0–1 variable of battery charge and discharge, 0 indicates shutdown and 1 indicates operation; , , and are the upper and lower limits of charging and discharging of the battery, respectively; and are the upper and lower limits of the battery savings. The battery does not generate electricity, and the storage capacity remains unchanged during the whole cycle.
(2) HS constraints
| (30) |
Where and are the HS capacity of HS equipment at time t and t 1 respectively; and are the heat storage and heat release efficiency of HS, respectively; is the loss rate of the HS; and are the 0–1 variables representing the heat storage and heat release of HS equipment, in which, 0 indicates shutdown and 1 indicates operation; , , and are the upper and lower limits of heat storage and the upper and lower limits of HS equipment respectively; and are the upper and lower limit of heat storage for HS equipment. The HS equipment does not generate heat energy, and the heat storage capacity remains constant throughout the cycle.
4.1.6 Users’ Comfort Constraints
| (31) |
Where and are heating comfort and cooling comfort; , and are the minimum satisfaction with electricity, heating and cooling.
The users’ comfort constraints consist of Equations (14) and (16).
4.2 Solution Method
To obtain the optimal dispatch of the cogeneration microgrid, an adaptive differential evolution algorithm is adopted. Based on the standard differential evolution algorithm, the adaptive variation operator is introduced to improve the global search ability and population diversity at the early iteration and the local search and convergence speed at the late iteration.
5 Case Studies
5.1 Basic Data
The cold-heat-electric microgrid constructed in this paper is improved on the basis of the literature [24, 26]. This paper chooses a typical winter day in a region as the study object. The scheduling time is taken as one day, and one hour as the unit scheduling time. The electricity, heating and cooling load curves, wind power and PV output curves are provided in Figure 2.
There is interactive power between microgrid and large power grid, but electricity sales to external power grid is not the main profit channel of CCHP microgrid, so the unit price of power purchase is higher and the unit price of power sales is lower. Before demand response, the unit price of purchasing electricity, and the price of selling electricity are 100 $/MWh and 30 $/ MWh, respectively. The real-time electricity price is in the form of peak-valley electricity price, in which the self-elastic coefficient in the electricity price elasticity matrix is 0.2, and the cross-elastic coefficient is 0.03. The peak, valley and flat electricity prices are shown in Table 1.
In the demand response model of cooling and heating load, c is 1.004 9 c/(kJkgC), is 1.2 kgm, is 0.33 m, D is 1.026 km, is 0.654 W/mC, R is 1.85C/MW, C is 0.537 MWh/C.
The temperature of the heating building is maintained at 23C, and the temperature of the cooling building is maintained at 20C before the DR. After the DR, the temperature of the cooling building changes from 18C to 23C. The specific values of the M and are shown in [16]. And the lower limit of users’ satisfaction with electricity, heating and cooling is 0.9.
The price of carbon emissions is 15 $/t, the increase rate of carbon trading price in each stage is 0.25, and the reward coefficient is 1.4, is 0.648, carbon emission interval length w is taken by 5 t, the unit carbon emission quota and carbon emission calculation coefficient of each unit are referred to [21, 27]. The unit price of natural gas is 36 $/MWh, the unit error costs of WT and PV output are 95 $/MWh and 124 $/MWh, respectively. The unit compensation costs of heating load and cooling load are 70 $/MWh and 40 $/MWh, respectively.
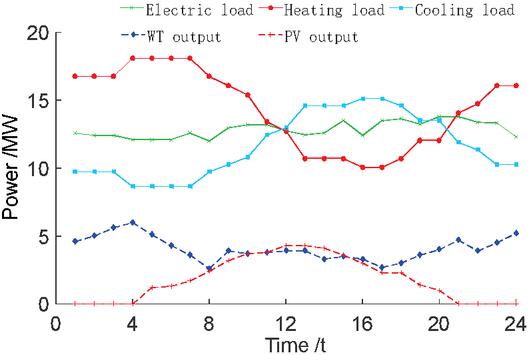
Figure 2 Forecast curves of wind turbine, PV and load outputs in a typical day in winter.
Table 1 Time-of-use electricity price for CCHP microgrid
| Period | Electricity Purchase | Electricity Sale | |
| Subsection | of Time/h | Price/($/MWh) | Price/($/MWh) |
| Peak period | 07:00—09:00 | 125 | 38 |
| 18:00—22:00 | |||
| 09:00—14:00 | |||
| Flat period | 16:00—18:00 | 100 | 30 |
| 22:00—24:00 | |||
| Valley time | 00:00—07:00 | 75 | 22 |
| 14:00—16:00 |
5.2 Comparative Analysis of Different Cogeneration Microgrid Optimization and Dispatch Models
To confirm the effectiveness of the carbon trading mechanism and IDR to strengthen the system economy, reduce the rationality of carbon emissions and improve the consumption capacity of wind power and PV, four optimal scheduling models are established, and the optimization results of different scheduling models are compared and analyzed. The models are as follows: (1) CCHP traditional economic dispatch model without considering carbon trading mechanism and IDR. (2) CCHP microgrid optimal scheduling model considering IDR only. (3) The optimal scheduling model of CHP microgrid considering only carbon trading mechanism. (4) The optimal scheduling model of CHP microgrid considering carbon trading mechanism and IDR. Among them, model 4 is the low-carbon economy optimal dispatch model established in this paper. The optimal dispatching results and actual carbon emissions of the four models are provided in Tables 2 and 3. The energy cost is the sum of interaction cost between microgrid and grid and natural gas cost.
Table 2 Analysis of operating costs under the four models
| Renewable | Carbon | P2G | Users’ | Total | ||
| Energy | Energy | Trading | Running | Compensation | Operating | |
| Cost/ | Abandonment | Costs/ | Costs/ | Costs/ | Cost/ | |
| Model | (103 $) | Cost/(103 $) | (103 $) | (103 $) | (103 $) | (103$) |
| 1 | 33.88 | 0.29 | 0 | 0.22 | 0 | 34.39 |
| 2 | 32.97 | 0.14 | 0 | 0.15 | 0.59 | 33.85 |
| 3 | 33.63 | 0.14 | 1.43 | 0.2 | 0 | 32.54 |
| 4 | 31.85 | 0.07 | 1.47 | 0.13 | 0.47 | 31.05 |
Table 3 Actual carbon emissions under the four models
| Model | Actual Carbon Emissions/t |
| 1 | 226.25 |
| 2 | 223.25 |
| 3 | 220.44 |
| 4 | 208.42 |
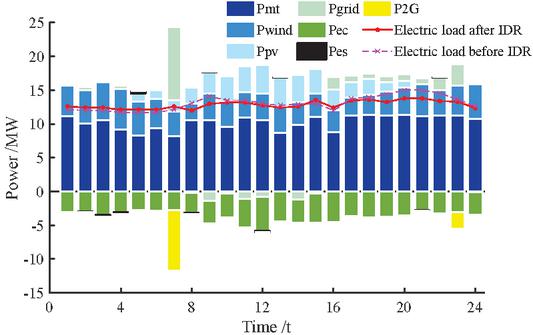
Figure 3 Scheduling results of electric power in model 4.
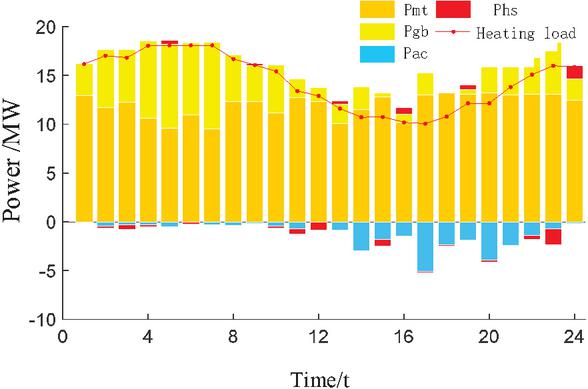
Figure 4 Scheduling results of heating power in model 4.
As shown in Table 2, compared with model 1, model 2 after considering IDR increases the utilization rate of generating capacity of units, and the utilizationrate of PV and wind power is further improved, so that the energy cost is reduced by 2.7%, and the wind and solar abandonment cost is reduced by 51.7%. In model 3, after considering the ladder-type carbon trading mechanism based on model 2, the system tends to choose GT and GB with low carbon emission but high energy supply cost, which makes the energy cost slightly higher than model 2. However, under the carbon trading mechanism, the total operating costs can be sold through the remaining carbon emission allowances, which is reduced by 3.9%, reducing actual carbon emissions. After considering IDR and carbon trading mechanism in model 4, wind power and PV are fully utilized, wind power and PV abandonment cost is further reduced, and energy supply cost is reduced. The results can be found in Table 3 which illustrates the effectiveness of carbon emission of model 4, with 5.5% cost decreased than model 3.
The CCHP microgrid low-carbon economy scheduling optimization results established in this paper are shown in Figures 3, 4 and 5. Figure 3 shows the power dispatching results of CCHP microgrid, which is composed of seven parts: EES charging and discharging, PV power generation, P2G power consumption, wind power generation, GT power generation, EC power consumption, and interactive power between microgrid and grid. Due to the constraints of carbon trading mechanism, most of the electricity load supply and EC power consumption are borne by GT with low carbon emission coefficient. Adding P2G and EES can absorb wind power and PV output more effectively. Due to the impact of peak and valley electricity price, users tend to use electricity in low hours while reduce the electricity consumption in peak hours, which smoothes the electricity load curve and makes the output of GT more stable. Figure 4 shows the thermal power scheduling results of CCHP microgrid, which is composed of GT, GB, AC heat consumption and HS heat storage and release. GT waste heat is used to satisfy the heat load demand, and the insufficient part is supplemented by GB. so the output of GB is limited by the output of GT, heating load and the heat consumption of AC. At the same time, HS transfers the load indirectly, which is conducive to improving improve the utilization rate of energy. Figure 5 shows the cold power scheduling results of CCHP microgrid. The cooling load is supplied by EC and AC. From 17:00 to 23:00, for the reason of the increased demand for electricity load, the output of wind power and photovoltaic power is small, GT runs at almost full power, and the output of EC is reduced, and it is not enough to be provided by AC.

Figure 5 Scheduling results of cooling power in model 4.
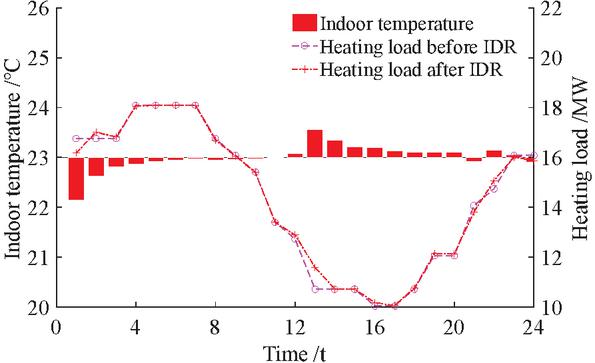
Figure 6 Optimization effect of heating load before and after demand response.

Figure 7 Optimization effect of cooling load before and after demand response.
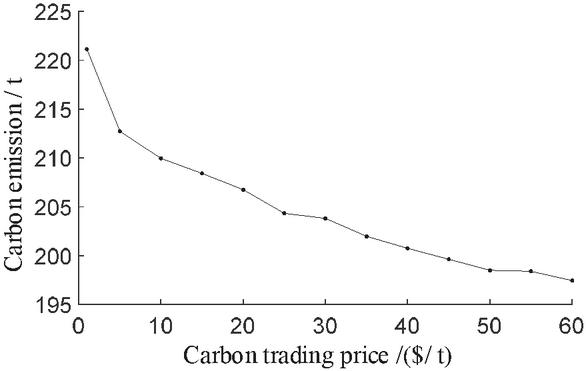
Figure 8 Relationship between carbon emissions and carbon trading price.
Figures 6 and 7 show the optimization curve of heating load and cooling load before and after DR and the change curve of room temperature respectively. In the model without considering the DR, the room temperature is maintained at a constant value, while the human body’s perception of temperature is fuzzy, and the storage temperature of goods can also change in a certain range. Therefore, the setting of the indoor temperature is varied in a certain range, and the heating load and cooling load also change accordingly.
Figure 8 provides the relationship betwwen the actual carbon emissions ad carbon trading prices. As shown in Figure 8, the actual carbon emission gradually increased with the carbon trading price decreased. Further, with the increase in carbon trading prices, the trend of carbon emission reduction has slowed down.
6 Conclusion
CCHP microgrid can make use of cold, heat, electricity and other energy sources, achieve high-efficiency energy consumption, Increasing the consumption capacity of wind and solar energy plays a core role in promoting energy conservation and emission reduction. A CCHP microgrid optimal dispatching model considering IDR and carbon trading mechanism is proposed. In addition, we also provide a thorough analysis of the impact of carbon trading price changes. The toy example analysis illustrates that the incorporation of the carbon trading mechanism into the source side can effectively control carbon emissions, and the flexible scheduling of various loads at the demand side can release the controllable potential of multifunctional users at the load side and reduce the cost of the system. By realizing the joint optimization of both sides of the source and load, the low-carbon economy of CCHP microgrid can be brought into full play.
References
[1] Kang Chongqing, Cheng Qixin, Xia Qing, et al. Prospects of low-carbon electricity[J]. Power System Technology, 2009, 33(02):1–7.
[2] Zhang Gang, Zhang Feng, Zhang Li, et al. Two-stage robust optimization model of day-ahead scheduling considering carbon emissions trading[J]. Proceedings of the CSEE, 2018, 38(18):5490–5499.
[3] Lubna Mariam, Malabika Basu, Michael F. Conlon. Microgrid: Architecture, policy and future trends. 2016, 64:477–489.
[4] Heejin Cho, Amanda D. Smith, Pedro Mago. Combined cooling, heating and power: A review of performance improvement and optimization[J]. Applied Energy, 2014, 136(dec.31):168–185.
[5] Jiang Ziqing, Hao Ran, Ai Qian. Interaction mechanism of industrial park based on multi-energy complementation [J]. Electric Power Automation Equipment, 2017, 37(06):260–267.
[6] Cheng Yaohua, Zhang Ning, Kang Chongqing, et al. Research framework and prospects of low-carbon multiple energy systems[J]. Proceedings of the CSEE, 2017, 37(14):4060–40694285.
[7] Zhang Xiaohui, Yan Keke, Lu Zhigang, et al. Carbon trading based low-carbon economic dispatching for power grid integrated with wind power system[J]. Power System Technology, 2013, 37(10):2697–2704.
[8] Qin Ting, Liu Huaidong, Wang Jinqiao, et al. Carbon trading based low-carbon economic dispatch for integrated electricity-heat-gas energy system[J]. Automation of Electric Power Systems, 2018, 42(14): 8–1322.
[9] Che Quanhui, Wu Yaowu, Zhu Zhigang, et al. Carbon trading based optimal scheduling of hybrid energy storage system in power systems with large-scale photovoltaic power peneration[J]. Automation of Electric Power Systems, 2019, 43(03):76–83154.
[10] Cui Yang, Zeng Peng, Zhong Wuzhi, et al. Low-carbon economic dispatch of electricity-gas-heat integrated energy system based on ladder-type carbon trading[J]. Electric Power Automation Equipment, 2021, 41(03):10–17.
[11] Li Xiaolu, Shan Fuzhou, Song Yanmin, et al. Optimal dispatch of multi-region integrated energy systems considering heating network constraints and carbon trading[J]. Automation of Electric Power Systems, 2019, 43(19):52–59131.
[12] Jin Xiaolong, Mu Yunfei, Jia Hongjie, et al. Optimal scheduling method for a combined cooling, heating and power building microgrid considering virtual storage system at demand side[J]. Proceedings of the CSEE, 2017, 37(02):581–591.
[13] Xu Zhou, Sun Yonghui, Xie Dongliang, et al. Optimal configuration of energy storage for integrated region energy system considering power/thermal flexible load[J]. Automation of Electric Power Systems, 2020, 44(02):53–63.
[14] Cui Yang, Jiang Tao, Zhong Wuzhi, et al. Source-load coordination economic dispatch method for regional integrated energy system considering wind power accommodation[J]. Power System Technology, 2020, 44(07):2474–2483.
[15] Shao C, Ding Y, Siano P, et al. A Framework for Incorporating Demand Response of Smart Buildings Into the Integrated Heat and Electricity Energy System[J]. IEEE Transactions on Industrial Electronics, 2018, 66(2):1465–1475.
[16] Cui Pengcheng, Shi Junyi, Wen Fushuan, et al. Optimal energy hub configuration considering integrated demand response[J]. Automation of Electric Power Systems, 2017, 37(06):101–109.
[17] Xu Hang, Dong Shufeng, He Zhongxiao, et al. Electro-thermal comprehensive demand response based on multi-energy complementarity[J]. Power System Technology, 2019, 43(02):480–489.
[18] Lu Zhigang, Guo Kai, Yan Guihong, et al. Optimal dispatch of power system integrated with wind power considering virtual generator units of demand response and carbon trading[J]. Automation of Electric Power Systems, 2017, 41(15):58–65.
[19] Dou Xun, Zhao Wenhao, Lang Yizihe, et al. A review of operation of natural gas-electricity coupling system considering power-to-gas technology[J]. Power System Technology, 2019, 43(01):165–173.
[20] Zhang Xiaohui, Liu Xiaoyan, Zhong Jiaqing. Integrated energy system planning considering a reward and punishment ladder-type carbon trading and electric-thermal transfer load uncertainty[J]. Proceedings of the CSEE, 2020, 40(19):6132–6142.
[21] Qu Kaiping, Huang Linni, Yu Tao, et al. Decentralized dispatch of multi-area integrated energy systems with carbon trading [J]. Proceedings of the CSEE, 2018, 38(03):697–707.
[22] Yulong Yang, Kai Wu, Hongyu Long, et al. Integrated electricity and heating demand-side management for wind power integration in China[J]. Energy, 2014, 78:235–246.
[23] International Organization for Standardization. Ergonomics of the thermal environment-analytical determination and interpretation of thermal comfort using calculation of the PMV and PPD indices and local thermal comfort criteria: ISO7730[S]. Geneva, Switzerland: ISO, 2005.
[24] Zou Yunyang, Yang Li, Li Jiayong, et al. Robust optimal dispatch of micro-energy grid with multi-energy complementation of cooling heating power and natural gas[J]. Automation of Electric Power Systems, 2019, 43(14):65–77.
[25] Dong Shuai, Wang Chengfu, Liang Jun, et al. Multi-objective optimal day-ahead dispatch of intrgrated energy system considering power-to-gas operation cost[J]. Automation of Electric Power Systems, 2018, 42(11):8–15121.
[26] Cui Mingyong, Wang Chutong, Wang Yucui, et al. Optimal configuration of multi-energy storage system in standalone microgrid[J]. Automation of Electric Power Systems, 2018, 42(04):30–3854.
[27] Xu Zhiheng, Zhang Yongjun, Chen Zexing, et al. Bi-level optimal capacity configuration for power to gas facilities considering operation strategy and investment subject benefit[J]. Automation of Electric Power Systems, 2018, 42(13):76–84.
Distributed Generation & Alternative Energy Journal, Vol. 37_5, 1681–1702.
doi: 10.13052/dgaej2156-3306.37516
© 2022 River Publishers