Dynamic Analysis of VSC-HVDC System with Disturbances in the Adjacent AC Networks
Ravi Shankar Tiwari1, 2,*, Rahul Kumar1, Om Hari Gupta1 and Vijay K. Sood3
1NIT Jamshedpur, 831014, India
2GLA University, Mathura, Uttar Pradesh, 281406, India
3Ontario Tech University, Oshawa, ON, Canada
E-mail: 2018rsee017@nitjsr.ac.in; ravishankar.tiwari@gla.ac.in; 2020pgeepe12@nitjsr.ac.in; omhari.ee@nitjsr.ac.in; vijay.sood@ontariotechu.ca
*Corresponding Author
Received 21 August 2022; Accepted 01 December 2022; Publication 10 July 2023
Abstract
VSC-HVDC systems are widely used to integrate wind farms, asynchronous generations and networks operating at different frequencies. The Multi-terminal (MT) and multi-fed (MF) HVDC’s are the system mainly constituted of VSC’s, to integrate renewable sources and transmitting bulk power to conventional AC grids. A sudden change in the steady state even in adjacent networks may create severe disturbances in the operation of such HVDC systems. The disturbances in AC or DC networks directly influence the performance of systems, particularly in MT-HVDC and MF-HVDC systems. However, the HVDC systems are known for their intelligent control in modulating operational states as and when required. This paper presents the dynamic analysis of MF-HVDC system due to load changes, faults and other disturbances in the adjacent AC networks. The result indicates that VSC-HVDC provides decoupled control of active and reactive power with capability in adjusting operational mode during various minor and major disturbances. Based on the results obtained, the paper proposed a novel sensitivity factor indicating percentage coupling among various line parameters during disturbances. Furthermore, the VSC’s injects harmonic signals on both AC and DC sides of HVDC system. These harmonics voltage or currents signals may get amplified to a dangerously high magnitude at resonance frequencies. Thus, the frequency characteristics of different subsystems are also analyzed using FFT. A 100 kV, 200 MW bipolar MF VSC-HVDC test systems is used to simulated the results in MATLAB/Simulink software.
Keywords: Voltage source converters, HVDC line, multi-terminal HVDC, multi-fed HVDC, vector control, protection system, faults, frequency response, transient voltage regulation, efficiency, wind farm.
1 Introduction
High voltage direct current (HVDC) transmission systems are nowadays popular for the integration of renewable together with bulk power transmission. The foremost commercial HVDC was established in 1954. It was used to transmit electricity from the Swedish mainland to the island Gotland. The Gotland HVDC link includes converters of rating 20 MW, 100 kV, and a submarine cable of 96 miles [1]. Traditionally, the HVDC is used for point-to-point transmission using cables whenever it is difficult to construct overhead transmission lines. However, these days HVDC is popularly used for long and short-distance and single and multi-in-feed transmissions. The attraction of using HVDC is zero transmission line charging currents, lower losses, reduced right of way (RoW), and the ability to connect asynchronous systems. The ability to control power flow, blocking faults from propagation, and no radio interference are the additional features of power transmission using HVDC systems [2–4]. Earlier, the current source converter (CSC) based HVDC was in use. The CSCs are thyristor-based converters of larger power rating and lower losses. However, the thyristor is a semi-controlled switch that can only be turned on with no turn-off capability. Thus, the fault currents cannot be controlled to interrupt the faults. Simultaneously, a CSC HVDC has large filter requirements, resulting in higher transmission cost and increase in vulnerability to AC side faults, and thus commutation failures. Hence, voltage source converter (VSC) based HVDC that uses fully controlled switches such as IGBT and GTO, are in trend. Typically, series-connected GTOs or IGBTs with anti-parallel diodes exhibit four-quadrant operation and higher blocking voltage [5].
A VSC-HVDC based on IGBT or GTO can operate with weak AC networks such as onshore and offshore wind farms [6]. This is possible due to fast and robust VSC control. The 2 250 MW, 200 kV Maritime Link is the world’s first bipolar VSC HVDC with an overhead line [7]. The VSC-HVDC can maintain a constant DC voltage under reversed power flow and avoid load shedding under critical network contingencies. Furthermore, the VSCs in HVDC transmission can be further classified into two and three-level [8, 9]. The modular multilevel converters (MMC) are the next major breakthough in VSC-HVDC technology, minimizing the losses in two and three-level converters. In [10], proposed a hybrid five level converter topology (H5LC) having additional low cost flying capacitors (FC’s). The FC’s provides addition voltage level and in H5LC the switching losses reduces significantly compared to PWM, two and three-level converters.
In VSC, the fast and independent control of active and reactive power is achieved using the pulse width modulation (PWM) technique [11, 12]. The principle characteristics of VSC-HVDC are decoupled control of active and reactive power flows [13]. The point-to-point VSC-HVDC has two converter stations, i.e., rectifier and inverter stations. The rectifier controls DC link voltage to maintain the input power factor nearly at unity [4]. However, in comparison to the CSC-HVDC, VSC-HVDC is more vulnerable to short circuit faults. The CSC-HVDC can limit the fault current due to the presence of smoothing reactors at both ends. However, the presence of shunt capacitance on each terminal in VSC-HVDC leads to severe faults. Therefore, HV cables are frequently used with VSC-HVDC applications.
The protection of the VSC-HVDC system is challenging due to small line impedance, high current during faults, limited overload capacity of IGBT diodes, and absence of natural zero crossing points in DC fault currents. The delay in fault detection, isolation of faulty sections using DC breakers, and controlling fault current may result in poor stability and dynamic performance. Thus, high-speed fault detection, classification, and isolation techniques are essential [14]. The converters are the source of harmonics and inject small signals of harmonic frequencies into the AC and DC systems. Due to AC-DC system interaction at PCC, a disturbance on either AC or DC network causes harmonic current or voltage of fundamental or second harmonic injected into the DC lines. Thus, a DC circuit of resonant frequency at fundamental or second harmonics results in amplified oscillation in those harmonic currents or voltages. This may lead to the damage of substation equipment. Reference [15] analyzed the resonant characteristics of the DC network and studied the effect of short circuit ratio (SCR), firing angle, filter type, smoothing inductance, transmitted power, and DC loop impedance. The aim was to shift the natural resonant frequency of DC circuit away from second and fundamental frequencies. And hence, avoids the damage of equipments from amplified oscillations of harmonics signals. The integration of large scale renewable using VSC and large number of power electronics devices may cause a risk of different type of oscillations. In [16], analyzed the risk of various types of oscillations and dynamic characteristics using Zhangbei MT VSC-HVDC system in Northern China power grid operation. And studied the response of AC/DC during fault and recovery process. The small signal dynamics in DC lines also cause stability problems. Reference [17] develops the linear state time domain model of small signal dynamics in an HVDC system. The signals of 2-200 Hz on the DC side are identified to detect the stability problems and can suggest designing faster control to overcome the stability threats. In [18], studies the sub-synchronous oscillation due to small parametric disturbance in VSC-HVDC system using participation factors instability phenomena. Finally, damping controller design and optimal location are analyzed for minimizing the sub-synchronous oscillations. Reference [19] shows the transfer functions of subsystems with frequency dependence of subsystem impedance. These subsystems are converters of HVDC, AC network, and DC network including or excluding filters, smoothing reactors, etc. In [20], the authors performed the linear and non-linear frequency response analysis of DC circuits to determine the dominant resonance frequencies and the amplification factor. The voltage or current at frequencies similar to the resonant frequency of a DC circuit encounters severe amplification. This may lead to the damage of station equipment during a disturbance in AC/DC networks. The effect of control and network impedance on modulating amplification factors at resonance frequencies are also analysed in [20]. At the end, the time response analysis of DC circuit for voltage and current during disturbance at frequencies close to natural frequency of oscillation is performed. The pole-to-ground (P-G) fault on one pole causes transient overvoltage on the other healthy pole of the bipolar HVDC line. Such overvoltage is of high magnitude, up to 2.2 times of rated voltage, and causes flashover and damages the insulation of the healthy phase. Thus, a P-G fault will be converted into a double-pole fault. The DC line termination elements and multiple reflections of positive and zero sequence travelling waves are the main cause of these over-voltages. Reference [21] investigates such transient over-voltages on healthy poles. This may cause unnecessary tripping due to dv/dt protection of the healthy pole. The nature of fault current or overvoltage may vary with different line boundary conditions, such as lines terminated with smoothing reactors or tuned filters, resistors, capacitors, or a combination of these. Hence, a close synchronization of filters, lightning arresters, and line isolation with dv/dt protection are essential. In [22], develops an effective DC fault identification algorithm with coordinated control and protection of radial HVDC grid based on analyzing the phase of input impedance during fault conditions. The scheme reported to have improved sensitivity and reliability compared to convention schemes for MMC.
This paper investigates the dynamics of VSC-HVDC systems fed from multiple sources to develop a compromising state between the protection, design, and control of VSC-HVDC systems. Initially, the disturbance in adjacent AC networks connected to the HVDC system is considered. Later on the work can be extended by considering disturbance on the DC line section and converters section as well. The remaining sections of this paper are arranged as follows: section II covers the multi-feed VSC-HVDC test system description. Section III explains the control arrangement of the VSC-HVDC system. Section IV analyzes the dynamics and sensitivity of the VSC-HVDC system during the various disturbances. Section V consists of the simulation results and discussion and section VI concludes the work.
2 Multi-fed VSC-HVDC Test System Description
A multi-fed VSC-HVDC test system of 200 MW, 100 kV supplied from 230 kV, 50 Hz grid () of capacity 2000 MVA and wind farm of the capacity of 10 MW is used for analysis which is shown in Figure 1. The power is delivered by transmission cable of length 75 km to another grid , operating at 230 kV, 50 Hz. The length of cable connecting the wind farm to is 50 km. The other specifications and ratings of the test system are given in Appendix A. In general, the sending- and receiving-end AC circuits are modelled using the damped inductive (R-L) circuits of fundamental frequency 50 Hz. The star grounded or delta configuration of the converter transformer is used to block triplen harmonics. The reactors connected at VSC provide the desired phase shift. However, the transformer leakage reactance causes a change in the amplitude of voltage waves.

Figure 1 Multi-fed configuration of VSC-HVDC test system.
3 Control Strategies for VSC-HVDC Systems
The controllers at the rectifier end and inverter end control the voltage and active power flow of the HVDC system, respectively. Unlike the classical HVDC system, VSC-HVDC is capable to control both active and reactive power independently. The reactive power is controlled independently at both converters by adjusting AC voltage without altering voltage at the DC link. The control for active power flow is obtained by adjusting the voltage on the DC side or altering the frequency on the AC system. Thus, the desired operating mode can be achieved by controlling the flow of active power, reactive power, DC voltage, AC side voltage, frequency or combination of these [23]. The VSC operates with the self-commutated sinusoidal pulse width modulation (SPWM) technique. This produces an output DC voltage independent of the AC system. The average output voltage of VSC can be controlled within a short period using SPWM. The change in phase angle of fundamental voltage across the series reactor controls the active power flow. However, the change in voltage across the series reactor controls the reactive power of each converter as shown in Figure 2. Thus, the PWM provides the four-quadrant operation of each VSC with DC voltage maintained constant. The reactive power at each station is controlled by regulating AC voltage irrespective of transmitted power or converter ratings.
The power angle or voltage angle control, vector control, and power synchronization control are the different control strategies of VSC-HVDC systems. However, vector control is widely used in most VSC-HVDC systems [24].
3.1 Power-angle or Voltage Angle Control
The equations for power flow between two nodes of the electrical network, given in (1) and (2), are used to develop the principle of power or voltage angle control [5].
| (1) | |
| (2) |
where P and Q are the active and reactive power between the two nodes having voltage magnitudes and at node 1 and node 2, respectively. Here, X is the line reactance between nodes and is the phase difference between them. Equations (1) and (2) indicate that the active power is more concerned with angle , while the reactive power is more dependent on the difference in voltage magnitude between the nodes. Hence, the concept of power or voltage angle control can be explained. Figure 2(a), (b), and (c) shows the equivalent circuit, phasor, and typical P-Q diagram of HVDC connected to the grid. Based on Figure 2(b), the three operational modes of VSC-HVDC connected to the grid are, a) Rectification mode for positive phase difference i.e. (), terminal voltage leading grid voltage , and thus, will be greater than zero (), (b) Inversion mode for power angle to be negative (), the bus voltage lags behind grid voltage (), and thus, less than zero () and (c) STATCOM mode obtained for zero difference in power angle () causes zero active power exchange i.e. (). The designing and implementation of voltage or power angle control is simple but has never been practically used for VSC-HVDC systems. This is due to its limitation in damping resonance present at grid frequency. The lower controller bandwidth and reluctance in controlling the valve current during DC line faults are the other limitations of power-angle control.
The dynamic response of VSC-HVDC depends on the adjacent AC network, DC network, and their controllers’ characteristics. The DC control activates within 10 ms to influence the dynamics of the HVDC system. However, AC machines respond slowly in the range of 100 ms to influence the system dynamics. The AC system, DC converters, and DC networks are the elements of concern during transient conditions of the AC-DC system. The converter behaves as a source of harmonics and injects current and voltage harmonics into the networks connected to both sides of the converter station. It also acts as a harmonic modulator for the DC and AC networks connected to the VSC stations. Similarly, the AC system acts as a source/sink for reactive power, active power, and harmonics – having frequency-dependent variable impedance. However, the DC circuit acts as sink or source of active power and sink of harmonics, with variable impedance dependent on frequency [25].
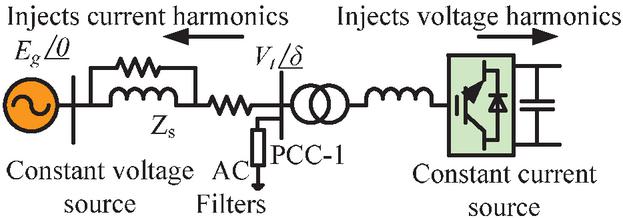
Figure 2(a): Equivalent circuit of grid-connected VSC-HVDC system [25].

Figure 2(b): Phasor diagram.

Figure 2(c): Typical P-Q diagram.
Hence, a fair representation of the AC system connected to the VSC controlled by SPWM is given by (3). The SPWM provides independent control for the magnitude, phase, and frequency of AC voltage on the terminals of VSC.
| (3) |
where n is the order of harmonics and h is the highest order of harmonics injected into the AC system. The and are the amplitude and phase of fundamental voltage at the terminals of the converter transformer on the AC side. Similarly, represents the phase for the harmonic component of the HVDC transmission system.
3.2 Vector or Indirect Control
The VSC in HVDC system is equivalent to an ideal voltage source connected to the grid after the AC filters. Their control freely decides the frequency, phase, and magnitude of the voltage wave produces. The rated capacity of VSC is limited by stability issues and control design criterions of HVDC systems [23]. The vector control consisting of decoupled inner and outer control loops for modulating power and DC link capacitor voltage, respectively. The inner loop controls the real and reactive power independently using phase locked loop (PLL) and abc-to-dq transformation of voltage or current at PCC [26]. During transformation, the d-axis of the rotating d-q frame of reference is assumed to be aligned with the rotating AC voltage vector at PCC. It determines the frequency () and phase angle () for vector control using PLL [27–29]. Thus, the PLL synchronizes the d-axis with voltage () at PCC or filter bus with the phase AC system. The outer loop shows sluggish nature in modulating the voltage across the DC link capacitor. However, inner loop exhibits a faster response compared to that of the outer loop. Both of the outer and inner control loops are implemented using a proportional-integral (PI) controller. Figure 3 indicates the complete implantation of vector control for the VSC-HVDC system.

Figure 3 Vector control arrangement for VSC-HVDC system [27–29].
The vector or indirect control has been successfully implemented in many VSC-HVDC systems. However, the vector control has an inherent drawback of poor performance during VSC-HVDC connected to the weak AC system. In literatures proposed a novel power synchronizing control techniques for VSC-HVDC systems. This method is based on the combination of vector control and power angle control methods and overcomes drawbacks of vector control.
Hence, the fundamental control system of VSCs has a cascaded structure as shown in Figure 3. External controllers for the converter are frequently based on vector control. These are in charge of managing the converter’s DC/AC input/output variables (DC or AC voltage and active or reactive power). This control level can be two-level, three-level, or multilayer, depending on the VSC technology used. On the network side, the converter’s outer controllers are in charge of completing local tasks like control of the voltage at the DC terminals (), balanced active power input and output (), control of reactive power (), or support of AC voltage () at the common coupling point (PCC). The other control schemes proposed based on outer and inner control loops are direct control, resonant regulator, etc. However, the performance of vector control is superior in terms of steady-state and phase error and provides decoupled control [30].
The inner and outer control of VSC senses the abrupt changes in parameters at PCC, and DC sides of the converter terminal and controls VSC’s operations as desired. An abrupt variation in parameters due to disturbance in grid sides is dealt with by varying the reactive power flow and active power flow or reactive power flow at PCC and DC pole-to-pole voltage both. The PI controllers in inner and outer control loops as shown in Figure 3 is used to regulate the amplitude and phase of modulating signal at VSC using PWM techniques. An overview of various controls for different configurations of VSC is summarized in Table 1.
Table 1 Control overview of VSC-HVDC for different configurations [30]
| Control Level | Sub-control | Control Bandwidth |
| Converter control | PWM, nearest level control (NLC) | |
| Valve control (switching) | ||
| Valve protection | ||
| Capacitor voltage balancing control for MMC | ||
| Circulating current suppression control for MMC | ||
| Primary control (external converter control) based on vector control | inner control loop (current control) | 10 Hz to several 100 hertz 1 Hz to |
| Outer control loop (voltage and power control), PLL, power synchronization control | 10 hertz | |
| Secondary control (system level | Converter coordination | 0.1 Hz to 1 Hz |
| control used in MTDC) | Droop control | |
| Set of operation and control modes | ||
| Start and shut down the converter |
4 Dynamic Modelling, Sensitivity and Frequency Response Analysis
4.1 Dynamic Modelling
The HVDC system enters into the dynamic state due to minor or major disturbances occurs in the AC or DC side of the VSC station. In (4), represents the AC side voltage for all the three phases during dynamic conditions of VSC-HVDC system. The expression related to the same is given as (4), (5), (6), and (7) [31].
| (4) |
where and are the three-phase grid voltage and current, respectively. And is the voltage at the AC terminals of VSC connected to the grid. The per-phase equivalent resistance and inductance between grid and VSC terminals are given as R and L, respectively.
After transforming the three phase quantities from abc-to-dq rotating reference frame, the (4) is given by (5). Where is the angular frequency in radian per second [13].
| (5) |
By using (5), the decoupled d-axis and q-axis voltage of the AC network is given as (6) and (7), respectively However, the only coupling imaginary elements present in (6) and (7) are and , respectively.
| (6) | ||
| (7) |
The active power exchange of the AC system into the d-q rotating reference frame is given in (8).
| (8) |
During steady state operation, the power exchange within the AC and DC sides will remain identical and given as (9).
| (9) |
where and are the rated DC link voltage and current. During steady state operation, the can be given by (10).
| (10) |
To analyze the severity of disturbance causing dynamics in HVDC system, a concept of evaluating transient voltage regulation (TVR) and efficiency () is proposed. The TVR and efficiency during dynamic operating state can be giving as (11) and (12), respectively.
| (11) | |
| (12) |
where is the maximum or minimum voltage during dynamic condition. The ( is the magnitude of maximum change in voltage appears on the DC side of VSC-HVDC system.
4.2 Sensitivity Factors
The paper also proposed the estimation of a novel sensitivity factor based on different quantities measured at PCC. The three distinct critical cases are considered to analyze the VSC-HVDC performance and sensitivity estimation. Where Case-I deals with perturbation in the rectifier side AC network due to a change in voltage or rated loading condition. The case-I (C-I) is further subdivided into C-I(a), C-I(b), and C-I(c) to consider the dynamics generated due to voltage sag, change in real or reactive power at PCC-1, respectively. Similarly, Case II and Case III are comprised of momentary three-phase short circuits at and , respectively.
The VSC-HVDC system is designed to decouple the control of real and reactive power and minimize the propagation of critical disturbances from one network to another. Such critical disturbances may be the drop in voltage, power, or frequency due to various reasons. The sensitivity factor proposed, check the percentage of decoupling of one measured parameters to the others at PCC. The higher the sensitivity magnitude, the lower will be decoupling effect. To define the sensitivity factor, one of the measured parameters at PCC i.e., source voltage, active power, or reactive power is considered to be input quantity while the others are the consequence or output. In generally, the sensitivity factor is defined as the ratio of output to input parameters as given in (13). The factors , , and are the dynamic sensitivity factors of voltage, real power, and reactive power with respect to changes in voltage, respectively. Similarly, , , and , , and , are the sensitivity factors for voltage, real power, and reactive power with respect to the changes in real and reactive powers, respectively. Thus, the proposed sensitive factors can be expressed as (14), (15), and (16).
| (13) |
The sensitivity factors due to voltage sag at PCC of sending end station are given in (14).
| (14) |
Similarly, the sensitivity factors due to change in active power delivery at sending or receiving end station are given by (15).
| (15) |
And, the sensitivity factors due to the change in reactive power injection at PCC of sending or receiving end stations are given by (16).
| (16) |
where , , and and , , and are the maximum deviation in voltage, real power, and reactive power, measured at PCC and terminals M of the test system, respectively.
4.3 Frequency Response Characterization
The nonlinear converter switching causes multiple harmonic frequencies in line current and voltage on both sides of converter station. It is important to analyze the frequency transformation on DC and AC sides due to following reasons: (a) oscillation initiated by the AC source may be propagated on the DC side and (b) existence of multiple resonance frequencies on the two sides of the system. Thus, results in harmonic instability due to amplification of voltage and current signal having frequency similar to resonance frequency of the circuit resonant. These amplified signals of voltage or current at the resonant frequency are sufficient to damage the equipment connected at the sending or receiving end station. The Fast Fourier transform (FFT) or modulation theorem can be used to obtain the harmonic inject on the DC or AC sides of VSC. The frequency response of each sub-circuit of HVDC system helps to identify circuit resonance frequency. Thus, the filters can be installed to avoid the amplification harmonics.
4.4 Stability Assessment for Change in Cable Length of VSC-HVDC Transmission
Despite its many advantages, VSC converters impair the electrical system’s power quality on both ends of the HVDC link. The HVDC system is made up of intricate components including cables and overhead wires with various resonance properties exists. Its time constant is on par with the converter connecting the grid in terms of order. Investigations are necessary to ensure a safe connection of various parts inside the HVDC grid since their interactions might occasionally result in harmful behavior. The resonance behavior of cables used for HVDC systems with variations in cable length was examined by the authors in [26]. The outcome demonstrates that for cables with shorter lengths, the increase in power transmission becomes unstable. For a longer length of HVDC cable, the same increase in power transmission becomes steady, though.

Figure 4 VSC-HVDC dynamics due to partial drop in three-phase voltage at .
5 Result and Discussion
5.1 Case I: Minor Disturbance at Sending End ()
5.1.1 Unexpected load change causing voltage dip at PCC
A minor disturbance simulated at sending end PCC by reducing three phase voltage up to 0.1 p.u. occurs at 1.5 s in the simulation time frame of 2 s. The simulation result indicated in Figure 4, shows the dynamics in real power, reactive power and DC pole voltage measured at PCC and terminal M, respectively. Ideally, the VSC is designed to maintain a stable operation during perturbation in the associated AC networks. However, in practice, a 140 ms sag in three phase voltages causes a momentarily drop in real power ( and ) by 10%. Here, the and are the active power delivered from sending end at PCC and terminal M of positive DC pole, respectively. Conversely, the control action of VSC re-stabilizes the steady-state power delivery within 30 ms after disturbance initiated. However, the disturbance exists for duration of 140 ms. In similar way, the DC pole to neutral voltages ( and ) at terminal , remains intact with negligible fluctuations exists for 50 ms after disturbance initiated. Here, the and is the positive and negative pole to neutral voltage of the HVDC system, respectively. Similarly, the 0.15 p.u. demand in reactive power at PCC of station generated due to disturbance and exists for 300 ms. This unbalance is due to a mismatch in the supplyand demand of reactive powerat PCC-1. The transient voltage regulation () and efficiency () during voltage sag are important, to verify the performance of HVDC systems. Table 2, indicates the TVR () of 2.5% during voltage sag, which is within the acceptable limit. The simulation results, are obtained using variable step size and sampling frequency of 13.5 kHz.
Table 2 Line parameters at PCC-1 and terminal M with different operating states
| Operating | Maximum Change in Line Parameters (p.u.) | ||||||
| States | % | % | |||||
| SS | 1 | 1 | 0.95 | 0 | 1.2 | 0 | 95 |
| C-I(a) | 0.90 | 0.91 | 0.87 | 0.18 | 1.17 | 2.5 | 95.6 |
| C-I(b) | 1.0 | 0.88 | 0.84 | 0.01 | 1.18 | 1.6 | 95.4 |
| C-I(c) | 1 | 0.98 | 0.94 | 0.13 | 1.26 | 5.0 | 95.9 |
| C-II | 0 | 0 | 0 | 1.12 | 0.81 | 32.5 | – |
| C-III | 1 | 0 | 0 | 0.18 | 1.59 | 32.5 | – |
5.1.2 Sudden load change causing a change in active power loading at PCC
The other minor perturbation frequently appears during the operation of the HVDC system is the sudden change in loading causing change in active power delivery at sending end PCC. Since, the VSC-HVDC is becoming the trend for exporting offshore wind power, which is random in nature. Thus, the performance of VSC during step drop in active power at PCC-1 is simulated at s. The results shown in Figure 5 indicates the response of power (, ), three phase voltages (), reactive power (, and pole to the neutral voltage (, ) at measured at PCC and terminal M, respectively. The response of active power delivered () is critically damped with settling time of 100 ms. However, the other parameters measured at PCC remain changed.

Figure 5 Response due to drop in active power at G1.
5.1.3 Sudden load change causing increase in reactive power at PCC
The disturbance due to a 10 p.u. change in reactive power injection at sending end PCC-1 is simulated at 1.5 s. The result in Figure 6 indicates that an undershoot in real power (, ) by 2% and exists for a duration of 70 ms. The vector control of VSC-HVDC system at the rectifier manage to cope-up the deviation within 4 cycles of a fundamental frequency. As per simulation results the and reactive power are controlled, independently. Similarly, the three-phase and DC pole-to-neutral voltages ( and or ) remain unaffected by the permanent increase in demend ofreactive power at PCC-1. This is possible due to independent control of reactive power via inner and outer control loops of VSC-HVDC system. Thus, the VSC-HVDC operation is immune to changes in reactive power settings at sending end station.

Figure 6 Response due to change in reactive power at G.
The results shown in Figures 4, 5, and 6 indicates the ability of independent and flexible power flow control of VSCs during sudden and unexpected load changes. The dynamic changes in grid or converter sides and restoration during black-start are the major concerns with the VSC-HVDC system. In VSC control, the three sinusoidal modulating signals () serve as a reference for the bridge phase voltages, which are produced by the discrete control of VSC to cope with the dynamics generated due to disturbance. The amplitude and phase of modulating signal are adjusted to control the reactive power flow at PCC, and actual AC power flow or the reactive power flow at the PCC and the pole-to-pole DC voltage both. Thus, model of the VSC-HVDC system selected is accurate enough to handle the often occurring sudden and unaccepted changes in loads in a practical sense.
5.2 Case II: Disturbance Due to a Three-phase Short Circuit at Sending end (G)
A temporary three-phase short circuit at F is considered to simulate the most severe disturbances that can occur on the AC system. The simulation result in Figure 7, indicating that the complete interruption of power flow via HVDC link occurs till the fault exists. Simultaneously, a peak demand in reactive power appears during recovery period in post fault condition. The DC pole-to-neutral voltage (V, V) decreases instantaneously and than recovers with high ripple factor and transients oscillations during fault. The VSC-HVDC manages to limit the dip in DC line voltage upto 0.4 p.u from steady state voltage of 0.67 p.u. and recovers to a rated value within 30 – 35 ms. This is due to the ability of VSC to control active and reactive power independently. Also, due to VSC capacitance which was charge upto rated value during pre-faults stage. Once external fault occurs, the VSC converter remain charge and flexible control ability of active and reactive power flow The maxima in TVR reach up to 40% with the high mismatch in reactive power supply and demand at PCC. The result shows the zero demand in reactive power from grid during pre-fault conditions. This is because the demand of reactive power by VSC is taken care by filters and capacitor banks installed near PCC. However, during fault () obviously all of theses parameter i.e. AC voltage, real power and reactive power at PCC flowing towards VSC would be zero. The recovery in post-fault voltage and power flow at PCC causes a sharp demand in reactive power from grid. This demand in reactive power from grid at PCC decreases slowly as the voltage across the filters and capacitor banks recovers to its rated value. At receiving end the TVR in AC system is unaffected from fault and appears to be zero in magnitude.

Figure 7 Results during 3-phase short circuit at PCC of sending end.
5.3 Case III: Three-phase Short Circuit at Receiving End G
A transient three-phase short circuit () is subjected to the receiving end station G2 of the test system. The simulation results shown in Figure 8 are for pre, post and during fault conditions. During fault the power transfer via HVDC gets completely interrupted, causing a transient rise in DC pole voltages (, ). However, the HVDC control block the DC link current and limit the excessive charging of the DC link capacitor. The TVR during is limited up to 32 – 33% on the DC side of HVDC system measured at terminal M. The recovery in voltage and rated power supply is restored within a 3 – 4 cycles after fault. However, the TVR measured at the terminal M of the sending end due to fault same as that of pre-fault conditions i.e. nearly zero. For reactive power measured at PCC of sending end deviates from its pre-fault level. A 0.15 p.u. or less fluctuates in magnitude with an oscillating frequency of 10 Hz appears for 300 – 400 ms after fault.
The Figure 9 indicates the variation voltage at PCC and terminal M of DC poles, real power and reactive power flow via HVDC link during minor and major disturbances. The variation in power shows decoupled control ability of VSC-HVDC system during disturbance.

Figure 8 HVDC system response during three-phase short-circuit () at G.

Figure 9 Variation of line parameters due to critical network disturbances.
The sensitivity factors estimated for various type of disturbance in HVDC system are tabulated in Tables 3–7. The curve for sensitivity with respect different dynamic conditions and location of measurements are plotted in Figure 10. It represents the maximum deviation of measured quantities during various disturbances.
Table 3 Sensitivity factors due to dip in voltage at
| Sensitivity Factors | Measurement at PCC-1 | Measurement at DC Line Terminal S |
| 1 | 0.3 | |
| 0.9 | 0.8 | |
| 1.8 | 0 |
Table 4 Sensitivity factors, due to change in active power supply
| Sensitivity Factors | At PCC-1 | At DC Line Terminal S |
| 0 | 0.15 | |
| 1.2 | 1.1 | |
| 0.16 | 0 |
Table 5 Sensitivity factors due to drop in reactive power
| Sensitivity Factors | At PCC-1 | At DC Line Terminal S |
| 0 | 0.6 | |
| 0.2 | 0.1 | |
| 1.3 | 0 |
Table 6 Sensitivity factors due to three-phase short circuit at
| Sensitivity Factors | Measurement at PCC-1 | Measurement at DC Line Terminal S |
| 1 | 0.385 | |
| 1 | 0.95 | |
| 1.12 | 0 |
Table 7 Sensitivity factors due to three-phase short circuit at
| Sensitivity Factors | Measurement at PCC | Measurement at DC Line Terminal “S” |
| 0 | 0.39 | |
| 1 | 0.95 | |
| 0.17 | 0 |
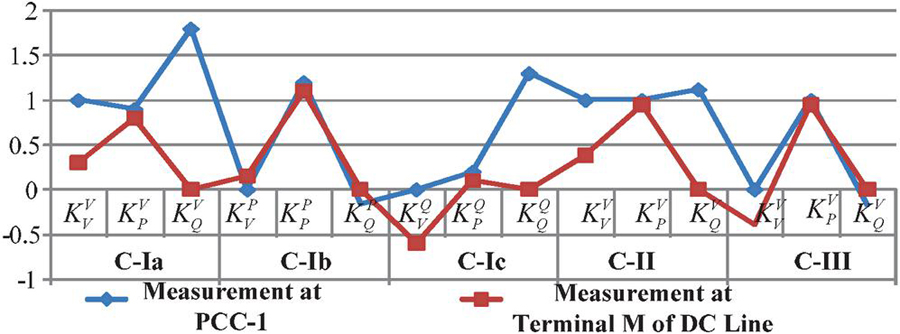
Figure 10 Sensitivity curve during minor and major disturbances in test system.
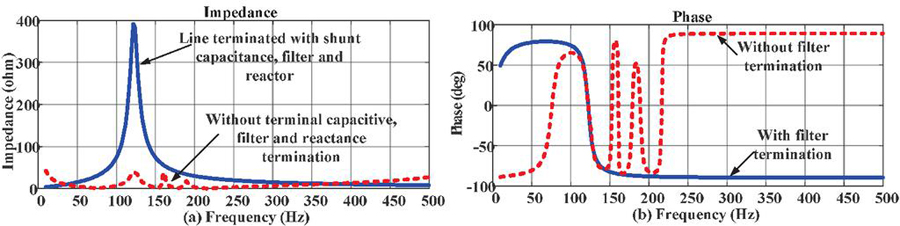
Figure 11 Instability points due to resonance characteristics of DC-link.
5.4 Impedance-Frequency Analysis for VSC-HVDC Test System
The impedance-frequency response of various subsystems of the HVDC system is obtained to analyze resonance characteristics of each section. If the harmonics injected on both side of rectifier or inverter station matches with the resonance frequency, may get amplified. The amplified signal during resonance may damage the equipments connected to that subsystem. Thus, by analyzing the frequency characteristics the necessary modification can be suggested in design or control, so that the subsequent resonance can be avoided. The Figure 11 shows the impedance-frequency characteristics of DC line section. The result indicates the impedance characteristics with and without third harmonic filter, and smoothing reactor. A multiple parallel resonant frequencies of 125, 160 and 190 Hz appear without filter and reactor of HVDC line. However, the line section encounters experiencing series resonance at 150 Hz. The lines terminated with DC filter, and smoothing reactor possessed the parallel resonance at the 125 Hz. Thus, by plotting impedance-frequency characteristics, the resonance frequency that may create harmonic instability in HVDC system are identified. The instability points on the AC circuits of HVDC system is shown in Figure 12. The result indicates a series resonance at 100 and 350 Hz, while the parallel resonance appears at 225 Hz.
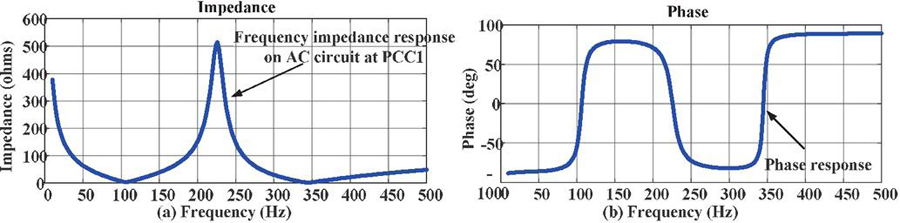
Figure 12 Instability points due to resonance characteristics of AC circuit at PCC-1.
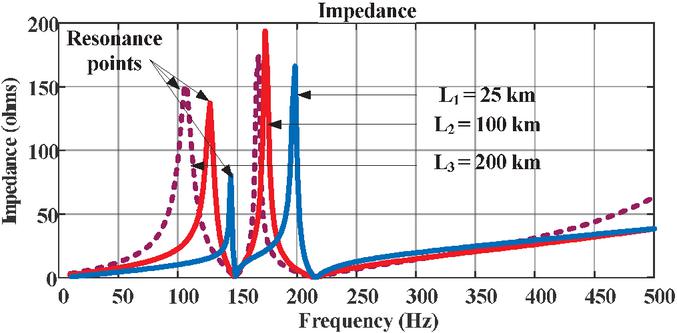
Figure 13 Impact of cable length on DC link resonance characteristics.
5.5 Impact of Cable Length on VSC-HVDC System Operation
For a given system setup, the power transfer must be limited to avoid instabilities originating from the dc-network dynamics. The instability phenomenon is related to the DC side resonance and hence to the length of the cable as one factor in the HVDC link. If the resonance originated from the DC link coincides with the non-passive behavior of one of the VSCs, it causes instability. It can be seen from Figure 13 that as the dc cable length increases, there is a decrement in resonance frequency. At the decreasing resonance frequency of the dc cable, the VSC conductance becomes less negative, thus reducing the risk of instability. In [27, 32], the dynamic analysis of two terminal VSC-HVDC is performed using eigen value analysis. The analysis reveals that unstable oscillations arise when power transfer exceeds a certain value. The increase of the dc cable length improves the dynamic performance of the system since it makes the eigen values move toward the stable region as the length increases.
6 Conclusion
A VSC-HVDC system is capable to restore the power supply once small or large disturbance dies out. The vector control technique in the VSC-HVDC system was analyzed and performance was estimated. The TVR and efficiency mentioned in Table 2 indicate the performance during every stage of disturbances. The vector control provided the decoupled control of real and reactive powers in the HVDC system. The proposed sensitivity factors indicate the percentage dependency of a line parameter over the other and also, describes the performance of VSC-HVDC by vector control strategy. The relatively low value of sensitivity indicates the subsequently stable and continuous operation of VSC-HVDC during the disturbance. However, the sensitivity above the set threshold () indicates disturbance-influenced network conditions and the power supply gets interrupted. The drop in AC voltage causes a momentary transient in real power transferred over the HVDC system. However, the fast and flexible control of VSC stabilizes the dynamics within a few cycles of the fundamental frequency. The analysis regarding frequency transformation and resonance characteristics gives the information about small signals that may cause instability. If the harmonic voltage or current signal matches with the resonance frequency of the circuit, it may cause amplification of signals and subsequently, this amplified signal may damage the equipment.
References
[1] M. Bahrman and P. E. Bjorklund, “The new black start: System restoration with help from voltage-sourced converters,” IEEE Power Energy Mag., vol. 12, no. 1, pp. 44–53, 2014, doi: 10.1109/MPE.2013.2285592.
[2] N. R. Watson and J. D. Watson, “An overview of HVDC technology,” Energies, vol. 13, no. 17, 2020, doi: 10.3390/en13174342.
[3] A. Korompili, Q. Wu, and H. Zhao, “Review of VSC HVDC connection for offshore wind power integration,” Renew. Sustain. Energy Rev., vol. 59, pp. 1405–1414, 2016, doi: 10.1016/j.rser.2016.01.064.
[4] A. H. Sheikh and F. I. Bakhsh, “Optimal Power Flow Through Variable Frequency Transformer Using Different Optimization Techniques,” Distrib. Gener. Altern. Energy J., pp. 1129–1158–1129–1158, Apr. 2022, doi: 10.13052/DGAEJ2156-3306.37410.
[5] N. Flourentzou, V. G. Agelidis, and G. D. Demetriades, “VSC-based HVDC power transmission systems: An overview,” IEEE Trans. Power Electron., vol. 24, no. 3, pp. 592–602, 2009, doi: 10.1109/TPEL.2008.2008441.
[6] Y. Liu, G. Rao, and R. Shao, “Research on Offshore Wind Farms Transmitted via VSC HVDC of an Integrated supervision and control system,” Proc. 2020 IEEE Int. Conf. Artif. Intell. Inf. Syst. ICAIIS 2020, pp. 633–636, 2020, doi: 10.1109/ICAIIS49377.2020.9194832.
[7] O. Vestergaard and P. Lundberg, “Maritime link the first bipolar VSC HVDC with overhead line,” 2019 AEIT HVDC Int. Conf. AEIT HVDC 2019, pp. 2–5, 2019, doi: 10.1109/AEIT-HVDC.2019.8740513.
[8] N. Flourentzou, V. G. Agelidis, and G. D. Demetriades, “VSC-based HVDC power transmission systems: An overview,” IEEE Transactions on Power Electronics, vol. 24, no. 3. pp. 592–602, Mar. 2009, doi: 10.1109/TPEL.2008.2008441.
[9] M. H. Okba, M. H. Saied, M. Z. Mostafa, and T. M. Abdel- Moneim, “High voltage direct current transmission – A Review, Part II – Converter technologies,” in 2012 IEEE Energytech, May 2012, pp. 1–7, doi: 10.1109/EnergyTech.2012.6304651.
[10] L. Bieber, J. Pfannschmidt, L. Wang, J. Jatskevich, and W. Li, “A Hybrid Five-Level Modular Multilevel Converter with High Efficiency and Small Energy Storage Requirements for HVDC Transmission,” IEEE Trans. Ind. Electron., vol. 70, no. 2, pp. 1597–1608, 2022, doi: 10.1109/TIE.2022.3158006.
[11] M. Singh, M. A. Ansari, P. Tripathi, and A. Wadhwani, “VSC-HVDC Transmission System and its Dynamic Stability Analysis,” 2018 Int. Conf. Comput. Charact. Tech. Eng. Sci. CCTES 2018, pp. 177–182, 2019, doi: 10.1109/CCTES.2018.8674095.
[12] A. Ghosh and F. Zare, “VSC Applications in Custom Power,” Control Power Electron. Convert. with Microgrid Appl., pp. 341–375, Oct. 2022, doi: 10.1002/9781119815464.CH9.
[13] J. Bao, Z. Gao, L. Yu, and C. Meng, “Research on dynamic model and decoupling control strategy of VSC-HVDC system,” 2011 Int. Conf. Electr. Mach. Syst. ICEMS 2011, no. 3, pp. 3–6, 2011, doi: 10.1109/ICEMS.2011.6073816.
[14] S. Ansari and O. H. Gupta, “A Fault and Islanding Detection Scheme using Differential Positive Sequence Power Angle for a Microgrid,” Distrib. Gener. Altern. Energy J., pp. 1823–1846–1823–1846, Oct. 2022, doi: 10.13052/DGAEJ2156-3306.3765.
[15] Z. Xu, P. Qiu, Y. Huang, and X. Li, “HVDC System DC Loop Resonance Analysis Based on Time Domain Simulation,” 2010 Int. Conf. Power Syst. Technol., no. 1, 2010.
[16] Y. Li and W. Wang, “Digital-Analog Hybrid Simulation of Renewable Energy Sent to Large-Scale AC Power Grid through Zhangbei VSC-HVDC System,” no. 5100, 2022.
[17] C. Osauskas and A. Wood, “Small-Signal Dynamic Modeling of HVDC Systems,” vol. 18, no. 1, pp. 220–225, 2003.
[18] V. Systems, B. Shao, and X. Meng, “Participation Factors Instability and Analysis of Direct-Drive Wind Farms with,” 2022 IEEE Power Energy Soc. Gen. Meet., pp. 1–5, 2022, doi: 10.1109/PESGM48719.2022.9917016.
[19] J. A. Wood, A. R., “The Frequency Dependent Impedance of An HVDC Converter,” IEEE Trans. Power Deliv. Vol. 10, No. 3. July 1995, p. 1635, 1995.
[20] M. P. Bahrman, G. C. Brownell, T. Adielson, K. J. Peterson, P. R. Shockley, and R. H. Lasseter, “Dc System Resonance Analysis.,” IEEE Trans. Power Deliv., vol. PWRD-2, no. 1, pp. 156–164, 1987, doi: 10.1109/tpwrd.1987.4308086.
[21] N. G. Hingorani, “Transient Overvoltage on a Bipolar HVDC Overhead Line Caused by DC Line Faults,” IEEE Trans. POWER Appar. Syst., vol. PAS-89, no. 4, pp. 592–610, 1970.
[22] M. Li, K. Chen, J. He, Y. Tang, and J. Tang, “Impedance Phase Based Active Injection Protection for Radial VSC-HVDC Grid,” pp. 1–14, 2022, doi: 10.1109/TPWRD.2022.3220929.
[23] A. M. and A. B. Feng Wang, Lina Bertling, Tuan Le, “An Overview Introduction of VSC-HVDC: State-of-art and Potential Applications in Electric Power Systems,” vol. http://www.cigre.org, no. 21, rue d’Artois, F-75008 PARIS, 2011, [Online]. Available: https://core.ac.uk/download/pdf/70601345.pdf.
[24] L. Zhang, L. Harnefors, S. Member, and H. Nee, Modeling and Control of VSC-HVDC Links Connected to Island Systems. 2010.
[25] V. K. Sood, “HVDC and FACTS Controllers – Applications of Static Converters in Power Systems | | Springer,” Kluwer Academic Publishers New York, Boston, Dordrecht, London, Moscow, 2004. https://www.springer.com/in/book/9781402078903\#aboutBook (accessed Jan. 16, 2021).
[26] S. S. Dessouky, M. Fawzi, H. A. Ibrahim, and N. F. Ibrahim, “DC Pole to Pole Short Circuit Fault Analysis in VSC-HVDC Transmission System,” 2018 20th Int. Middle East Power Syst. Conf. MEPCON 2018 – Proc., pp. 900–904, 2019, doi: 10.1109/MEPCON.2018.8635237.
[27] G. Pinares, “Analysis of the DC Dynamics of VSC-HVDC Systems Connected to Weak AC Grids Using a Frequency Domain Approach.”
[28] S. Gao, H. Zhu, B. Zhang, and G. Song, “Modeling and simulation analysis of Hybrid Bipolar HVDC system based on LCC-HVDC and VSC-HVDC,” Proc. 2018 IEEE 3rd Adv. Inf. Technol. Electron. Autom. Control Conf. IAEAC 2018, no. IAEAC, pp. 1448–1452, 2018, doi: 10.1109/IAEAC.2018.8577863.
[29] D. Rabie, T. Senjyu, S. Alkhalaf, Y. S. Mohamed, and E. G. Shehata, “Study and analysis of voltage source converter control stability for HVDC system using different control techniques,” Ain Shams Eng. J., vol. 12, no. 3, pp. 2763–2779, 2021, doi: 10.1016/j.asej.2020.12.013.
[30] R. Shah, J. C. Sánchez, R. Preece, and M. Barnes, “Stability and control of mixed AC-DC systems with VSC-HVDC: a review,” 2018, doi: 10.1049/iet-gtd.2017.1140.
[31] X. Yu, J. Yi, N. Wang, Y. Teng, and Q. Huang, “Analysis on Dynamic Response of LCC-VSC Hybrid HVDC System with AC/DC Faults,” Int. Conf. Innov. Smart Grid Technol. ISGT Asia 2018, pp. 323–327, 2018, doi: 10.1109/ISGT-Asia.2018.8467907.
[32] G. Pinares and M. Bongiorno, “Analysis and Mitigation of Instabilities Originated from DC-Side Resonances in VSC-HVDC Systems,” IEEE Trans. Ind. Appl., vol. 52, no. 4, pp. 2807–2815, Jul. 2016, doi: 10.1109/TIA.2016.2552144.
Biographies

Ravi Shankar Tiwari received the bachelor’s degree in Electrical Engineering from Govt. Engineering College, Rewa, M.P, India in 2007 and the M. Tech. degree in Electrical Engineering with specialization in power system from VJTI, Mumbai, India, in 2010. He is an Assistant Professor at the department of Electrical Engineering, GLA University, Mathura, India and currently pursuing the Ph.D. degree in electrical engineering at National Institute of Technology, Jamshedpur, India. His research interest is power system protection, renewable and distributed generation.

Rahul Kumar received the bachelor’s degree in Electrical Engineering from MIT Muzaffarpur, Bihar, India in 2018. He received M. Tech degree with specialization in power electronics and drives from NIT Jamshedpur, India in 2022. Currently, he is working Faculty Trainees in Hemlata Group of Institution, Assam, India. His major research area includes power system protection, HVDC & FACTS.

Om Hari Gupta is currently an Assistant Professor at the Department of Electrical Engineering, National Institute of Technology Jamshedpur, India. He received the Ph.D. degree (Electrical Engineering) from the Indian Institute of Technology Roorkee, Roorkee, India. He is a recipient of the Canadian Queen Elizabeth II Diamond Jubilee Scholarship for research visiting the Ontario Tech University (Formerly University of Ontario Institute of Technology), Oshawa, ON, Canada in 2017. His major areas of research interests include Power System Protection, Microgrid, Renewable-based Distributed Generation, and Electric Power Quality. Dr. Gupta is a senior member of IEEE and a reviewer for various international journals including IEEE Transactions on Power Delivery, Electric Power Components and Systems, International Journal of Electrical Power and Energy Systems, etc.

Vijay K. Sood received the Ph.D. degree from the University of Bradford, Bradford, U.K., in 1977. He is currently an Associate Professor at Ontario Tech University, Oshawa, Canada. He has extensive experience in the simulation of HVDC-FACTS systems and their controllers. He has authored two textbooks on HVDC Transmission. His research focuses on the monitoring, control, and protection of power systems and integration of renewable energy systems into the smart grid. Dr. Sood is a Registered Professional Engineer in the province of Ontario, a Fellow of the IEEE, Engineering Institute of Canada, and Emeritus Fellow of the Canadian Academy of Engineering.
Distributed Generation & Alternative Energy Journal, Vol. 38_5, 1403–1432.
doi: 10.13052/dgaej2156-3306.3853
© 2023 River Publishers