Optimal Power Dispatch of Multiple DGs Using a Hybrid Algorithm for Mitigating Voltage Deviations and Losses in a Radial Distribution System with Economic Benefits
Ankeshwarapu Sunil*, Chintham Venkaiah and D. M. Vinod Kumar
Department of Electrical Engineering, National Institute of Technology, Warangal, Hanumakonda, Telangana, India
E-mail: ankeshwarapu.sunil@gmail.com; ch.venkaiah@ieee.org; vinodkumar.dm@gmail.com
*Corresponding Author
Received 28 October 2022; Accepted 06 February 2023; Publication 10 July 2023
Abstract
In this research, a meta-heuristic-based hybrid algorithm was used to optimize the power dispatch of numerous Distributed Generators (DGs) in a Radial Distribution System (RDS) for hourly fluctuating seasonal loads in order to reduce losses and voltage variations while also saving money. With hourly seasonal load changes, renewable DGs like PV, Wind, and Hybrid (PV+Wind) were used. The HA is proposed in this paper as a way to achieve successful outcomes by merging two meta-heuristic algorithms. The findings of the HA are compared with Genetic Algorithm (GA), Particle Swarm Optimization (PSO), Shuffled Frog Leap Algorithm (SFLA), and Jaya Algorithm (JA) when they are applied to a standard IEEE 33 bus RDS and PGE 69 bus RDS. According to the test findings simulated in the MATLAB environment, Hybrid Algorithm (HA) beat GA, PSO, SFLA, and JA in terms of optimal power dispatch of numerous DGs to minimise losses and voltage variations, as well as the cost-benefit analysis of renewable DGs energy generation.
Keywords: Distributed generators (DGs), genetic algorithm (GA), particle swarm optimization (PSO), shuffled frog leap algorithm (SFLA), jaya algorithm (JA).
1 Introduction
Integration of DGs in a distribution network has increased globally in the last few decades. This has made it possible to plan for long-term electrical system expansion. DGs connected to electric utility’s lower voltage distribution lines, can help support delivery of clean, reliable power to consumers and reduce electrical losses along transmission and distribution lines. Reduced losses and operating costs, better service quality, higher reliability, better power quality and excellent voltage support are the benefits by the integration of DGs into the distribution system [1]. Renewable DGs in the network offer several benefits : environmental, economical and technological [2]. Most of the countries across the globe use fossil fuels and this has adverse implications for global climate as well as human health. Renewable energy resources will play a key role in the decarbonization of the energy system in the coming decades. The rapid production of renewable energy and technologies used in transforming energy mix and the data share of renewable energy across the world and their rapid change were discussed in [3].
Nomenclature
| Voltage angle at bus | |
| Voltage angle at bus | |
| Angle of admittance between buses i and j | |
| Time for Computation in seconds | |
| Length of Chromosome | |
| DG location | |
| DG size | |
| Index for loss | |
| Index for voltage deviation | |
| Branch current maximum limit | |
| Branch current minimum limit | |
| Branch number | |
| Losses involving DGs | |
| Losses not involving DGs | |
| Objective function for minimization | |
| Bus number | |
| number of DGs | |
| number of Frogs | |
| number of Memeplexes | |
| Crossover probability | |
| DG active power generation | |
| DG active power maximum limit | |
| DG active power minimum limit | |
| bus active power demand | |
| Elitism percentage | |
| bus active power generation | |
| Real power load | |
| Mutation Probability | |
| Size of population | |
| DG Reactive power maximum limit | |
| DG reactive power minimum limit | |
| bus reactive power demand | |
| bus reactive power generation | |
| Random number between (0,1) | |
| Loss of complex power flow between buses i and j | |
| Loss of complex power flow between buses j and i | |
| Loss of complex power in the system | |
| Bus voltage maximum limit | |
| Bus voltage minimum limit | |
| Voltage at bus | |
| Voltage at bus | |
| Voltage deviation involving DGs | |
| Voltage deviation not involving DGs | |
| Objective 1 weight factor | |
| Objective 2 weight factor | |
| Population at initial stage | |
| Population after updation | |
| population best value | |
| population Worst value | |
| Line admittance between buses i and j |
The optimal power dispatch of DGs into the distribution systems aims to determine the optimal locations and optimal sizing of renewable DGs to meet the objectives like total power loss reduction, voltage profile improvement and cost reduction, etc., subject to constraints such as active and reactive power balancing equations, voltage limits, DG size limits, etc.. The existing research explores [4] DG allocation based on optimization algorithms, objectives, decision variables, DG type, constraints and kind of uncertainty modeling. In [5], the authors looked at various technical, financial and multiple objectives for DG allocation optimization methods. Researchers have presented an overview of optimal allocation of DGs into the distribution systems and most of them have proposed different methods for optimal location and sizing of DGs into the distribution system considering various objectives. The authors of [6] advocated employing mixed integer linear programming to improve the voltage stability margin by taking into account the stochastic nature of the DGs and loads. For the optimal size and placement problem in a distribution network, a large range of nature-inspired algorithms have been used. Using nature-inspired algorithms to optimise DG allocation has a lot of potential. In comparison to traditional methods for achieving a global optimal solution, Nature Inspired Algorithms have a larger potential for solving complicated optimization problems such as optimal allocation and sizing of DGs. Nowadays a new and highly successful branch of meta-heuristic research, namely the hybridization of meta-heuristics with algorithmic components originating from other techniques for optimization is being considered for research. A combined genetic algorithm (GA) and particle swarm optimization (PSO) is presented for optimal location and sizing of DG on distribution systems. Several studies are available on hybridization of optimization algorithms for various problems like economic load dispatch, Optimal reactive power dispatch and several optimization test functions, using their performance to achieve the best solution [7, 8, 9]. An efficient and fast converging supervised Big Bang Big crunch method presented in [10] for optimal location, capacity of one or more voltage controlled DGs for power loss minimization for balanced and unbalanced distribution systems. In [11], a hybridization of analytical approach and PSO was established for the best placement of many DGs in a power distribution network to reduce power loss, and DG sizes are evaluated by analytical method while locations are found by PSO. Hybridized Grey Wolf Optimizer and PSO proposed in [12] for optimal location and size problem considering network reconfiguration concept. For optimal placement and sizing of PV and WTs, a Multi-Objective Hybrid Teaching Learning Based Optimization-Grey Wolf Optimizer is designed [13]. SOS-NNA, a new methodology based on symbiotic organism search (SOS) and neural network algorithm (NNA) for optimal planning and operation of DGs and CBs in radial networks considering single and multi-objective problems, was reported in [14]. In [15], a novel heap-based optimizer with deeper exploitative improvement (HODEI) is introduced for discovering the optimum topology of distribution system integrated to identify the optimal placement and size of multiple DGs.
According to the research, efficient DG allocation in distribution networks with various purposes has not placed a high priority on hourly varying seasonal load data and hourly varying renewable DGs information. All of the strategies given in the literature are applied to various distribution systems with various target functions in order to optimize the placement and sizing of DGs while enhancing system performance. Several research gaps were discovered in the literature, including those that only evaluate a single target, others that ignore the type of DG, hourly variable renewable generation, and seasonal loads. Some hybridization approaches in the literature neglected to account for computational time and other variables. The proposed research study focuses on technical distribution network objectives such as power loss reduction and voltage profile enhancement. This work [16] of Meta-heuristic approach applications for optimal placement and sizing of numerous DGs in RDS and presenting a hybridized metaheuristic optimization algorithm is a continuation of that study. The research in [17] focused on the generation of electrical energy using solar photovoltaic generation in conjunction with wind turbines, and the built hybrid system is connected to the grid to provide the load. The planned microgrid’s operation cost and emission cost were taken into account as objectives using the Whale Optimization Algorithm in a way that both the combined contribution of renewable energy sources and combined heat and power, as mentioned in [18], were taken into consideration. An improved teaching learning based optimization algorithm [19] is utilised to determine the best placement and size of single and multiple wind turbine generation units while taking into account the objectives of loss minimization, increasing voltage profile, voltage stability, and line load-ability margin. A multi-objective stated problem is considered using a human opinion dynamics optimization approach by optimising voltage profile and lowering total losses through the best allocation of DGs in the distribution network discussed in [20]. The best placement of DGs is determined using a matrix-based radial distribution load flow method, and the best placement of EV loads is determined using a heuristic intelligent search method called Reptile Search Algorithm (RSA) [21]. The Wind Turbine Generation Unit (WTGU) is evaluated for single and multiple DG placement and sizing in distribution system performance improvement utilising Improved Teaching Learning Based Optimization (ITLBO) by optimising the multi-objective performance index [22]. The hybrid approach [23] is the application of the Grasshopper Optimization Algorithm (GOA) and Cuckoo Search (CS) techniques simultaneously. Similar to the proposed method how the Jaya phase improved the Genetic phase in the process of global optimal solution, the CS technique is employed to improve GOA optimization behavior. The following are the paper’s primary contributions:
(i) A hybrid meta heuristic technique is proposed for tackling the problem of optimal power dispatch for DGs that integrate PV, Wind, and PV-Wind.
(ii) By considering power loss reduction and voltage profile improvement, the HA technique is used to maximizes the technical and economic benefits of DGs integration into the power distribution system.
(iii) To compare the impact of DG integration with other approaches, several renewable DGs, such as PV, Wind, and Hybrid (PV-Wind), are integrated into standard IEEE 33 bus RDS and PG & E 69 bus RDS.
(iv) In terms of optimal solution, the HA surpassed all other techniques.
In this research, meta-heuristic methods were used to investigate the best power dispatch of multi DGs into RDS for minimizing voltage variations and losses for seasonal loads that fluctuate on an hourly basis with cost-effective results. For minimising voltage variations and losses, meta-heuristic methods such as GA, PSO, SFLA, JA, and the suggested HA have been applied on IEEE 33 bus RDS and PGE 69 bus RDS. The losses computed using the backward forward sweep distribution load flow method on IEEE 33 bus RDS and PGE 69 bus RDS are taken into consideration as base case losses in the absence of DGs.
There are four sections to this paper: In Section 2, the problem formulation for DG’s power distach is presented. Section 3 explains the suggested HA based on meta-heuristics. In Section 4, simulation results based on Meta-heuristic algorithms on IEEE 33 Bus RDS and PGE 69 bus RDS are reviewed, and the results of the proposed technique are compared to the performance of other algorithms. Section 5 concludes with recommendations for future research.
2 Problem Formulation
The objective is to establish an optimal power dispatch of numerous DGs in RDS while minimizing losses and voltage deviations due to hourly variations in seasonal loads and renewable DG power generation. Equation (1) shows the objective function expression.
| (1) |
As indicated in Equation (2), the ratio of losses including DGs to losses not including DGs is defined as the loss index .
| (2) |
As indicated in Equation (3), the ratio of voltage deviation including DGs to voltage deviation not including DGs is defined as the voltage deviation index .
| (3) |
The equality and inequality constraints are presented in equations between (4)–(5) and (6)–(9), respectively, on the objective function (1).
| (4) | |
| (5) | |
| (6) | |
| (7) | |
| (8) | |
| (9) |
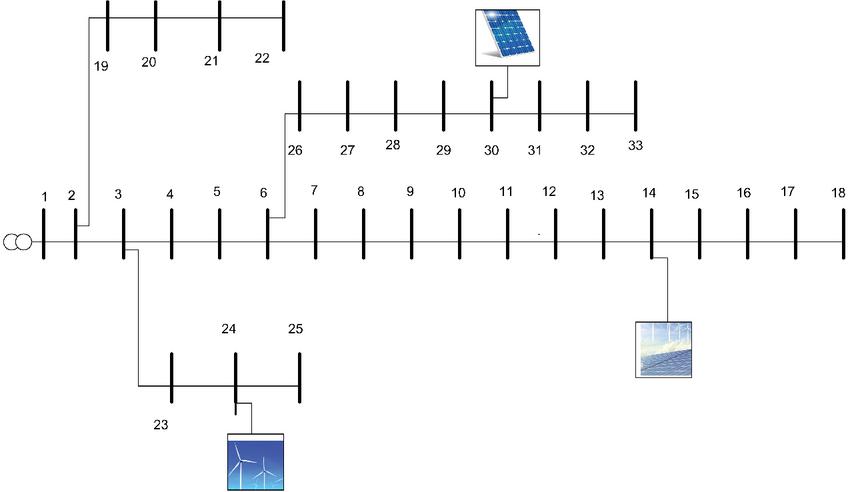
Figure 1 Single line diagram of IEEE 33 bus RDS with PV, Wind and Hybrid DGs.

Figure 2 Single line diagram of PGE 69 bus RDS with PV, Wind and Hybrid DGs.
Table 1 Type, location and Size of various renewable DGs
| Test System | (kw) | (kvar) | (kvar) | ||
| IEEE 33 Bus | 30 | PV | 2000 | 0 | 400 |
| 24 | Wind | 1200 | 600 | 600 | |
| 14 | Hybrid | 3200 | 1000 | 1000 | |
| PG & E 69 Bus | 61 | PV | 2000 | 0 | 400 |
| 54 | Hybrid | 3200 | 1000 | 1000 | |
| 51 | PV | 2000 | 0 | 400 | |
| 17 | Wind | 1200 | 600 | 600 | |
| 11 | Hybrid | 3200 | 1000 | 1000 |
DG location, type and size limits for two test systems figure in Table 1. The location of DGs integrated into IEEE 33 bus RDS and PGE 69 bus RDS are shown in Figures 1 and 2 respectively. The plot of seasonal load variations as percentage is shown in Figure 3 [24]. Figures 4, 5, and 6 illustrate the hourly power generation from PV, Wind, and Hybrid (PV+Wind) during four seasons of the year, respectively [24]. Here, the annual data is divided into four seasons: week 1 to 13 considered as Summer, week 14 to 26 considered as Monsoon, week 27 to 35 considered as Autumn and week 36 to 52 considered as Winter respectively. For minimising losses and voltage fluctuations in RDS, hourly load variations with the inclusion of renewable DGs have been considered.
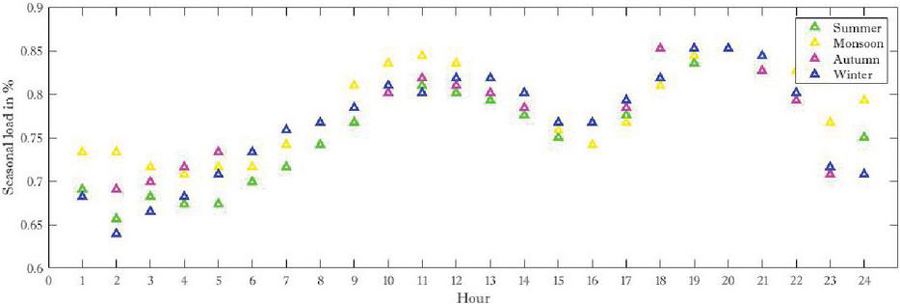
Figure 3 Plot of Seasonal load variations.
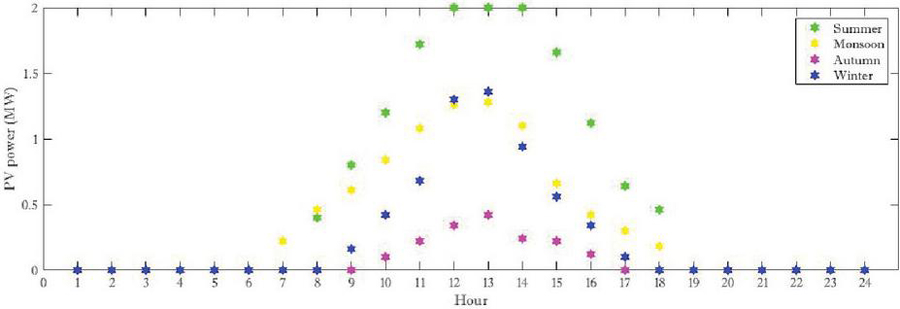
Figure 4 Plot of PV power generation.
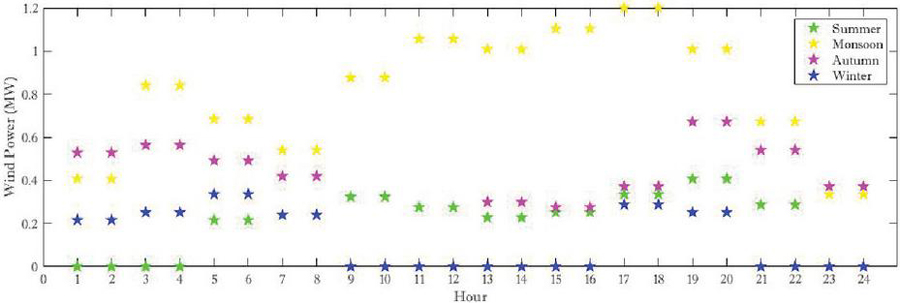
Figure 5 Plot of Wind power generation.
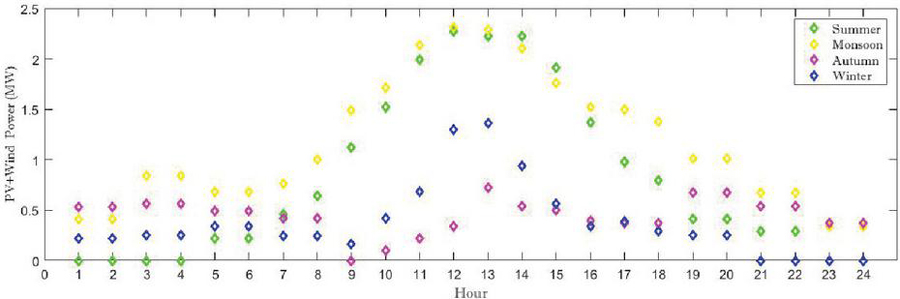
Figure 6 Plot of Hybrid (PVWind) power generation.
3 Metaheuristic Hybrid Technique
Most optimization issues were previously tackled using conventional methods such as the gradient method, linear programming, Newton’s method and quadratic programming methods, among others. Due to the discrete search spaces and a large number of control variables, many techniques have difficulties achieving a global optimal value. Meta-heuristic techniques have grown in popularity as alternative approaches, with hybridization of meta-heuristics becoming increasingly popular in recent years to solve such complex optimization problems. Hybridization of metaheuristics is being explored to combine the advantages of both the methods for improving the performance. Metaheuristic algorithms have demonstrated their ability to produce high-quality solutions to real-world issues. Hybridization is possible by the combination of two analytical methods, one analytical and one Metaheuristic or two metaheuristics. Here, two meta-heuristic techniques i.e Genetic Algorithm and Jaya algorithm [25] have been considered and a HA has been adduced by combining them for arriving at the best optimal solution.
3.1 Hybrid Algorithm (HA)
The proposed hybridization method is divided into two phases: the Genetic phase and the Jaya phase.
3.1.1 Genetic phase
An initial population is generated at random, calculate the fitness values of all the chromosomes. Then sort the fitness values in descending order. Along with the fitness values, sort the population of chromosomes in descending order. After sorting, the next generation is to be produced. Selection, which equals to survival of the fittest, Crossover, which represents mating between individuals, and Mutation, which adds random modifications, are the three operators involved in this process.
(i) Selection Operator
In order to produce a child, there is a need to select the parents from the available population. Better individuals are given preference by the selection operator, allowing them to pass on their genes to the next generation. The process of picking the parents who will mate and recombine to produce offspring for the next generation is known as parent selection. Parent selection is an important role of GA because good parents will produce the off-springs with better fitness values. The selection of parents is done by using the Roulette wheel parent technique.
(ii) Crossover Operator
Reproduction is symbolised by crossover. The selection operator is used to choose two individuals from the population, and the offspring are created from the parents’ genetic material. Uniform crossover is used to produce the off-springs for next generation. Crossover is done across the entire length of the bit string in this manner. A mask is made at random for this purpose. This mask is simply a string of bits with the values 0 or 1, with the same length as the string. Produce the children using the information in the mask. Each child is born through a crossbreeding. As a result, the number of crossovers required for the following generation is determined by the number of children required. There is also a parameter called Crossover Probability that can be used to control crossover. Before conducting the crossover, this probability is employed as a choice variable.
(iii) Mutation Operator
The mutation procedure is carried out on a new population that is easily available. A chromosomal mutation is a minor random change in a bit value (1 to 0 or 0 to 1) at a specific bit site. It’s used to maintain and introduce variation to a genetic population, and it’s usually done with a low success rate. If the probability is high enough, the GA can be reduced to a random search. Mutation is the component of the GA that deals with exploring the search space. It has been observed that mutation is required for GA convergence. The Probability of Mutation is a control parameter for mutation.
(iv) Elitism
It is common practise to pass down some of the best parenting skills to the following generation of children. Elitism is the phenomena of best parents copying into the next generation, and the number of parents copied is indicated by a GA parameter called Probability of Elitism. This is simply the proportion of parents who have been copied out of the total number of parents. This elitism is mostly practised in order to avoid losing the best strings collected thus far, which would otherwise be lost.
3.1.2 Jaya phase
(i) Evaluation
In each iteration from the GA phase, evaluate the the population’s worst and best solution candidates
(ii) Updation
Update each solution based on the candidates’ best and worst solutions by following the steps below.
| (10) |
(iii) Comparison
At this stage by comparing the updated solutions with previous solution. The updation is effected, If updated solution has better function value then previous solution will be replaced by updated solution.
In order to evaluate the effectiveness of proposed HA with other algorithms like GA and JA, basic global optimization test functions namely Gramacy & Lee (2012) function and Levy function N.13 [26] which are represented in Equations (11) and (3.1.2) respectively have been considered. Gramacy & Lee (2012) function is a simple one-dimensional test function and evaluated on the x [0.5, 2.5]. The Global optimal solution for Gramacy & Lee (2012) function is 0.869011134989500 at x 0.548563444114526. Levy function N.13 is a two-dimensional test function and evaluated on the square [10, 10], for all i 1, 2. The Global optimal solution for Levy function N.13 is 0 at and .
| (11) | ||
| (12) |
Table 2 Optimal solutions of test functions using GA, JA and HA
| Test Function | GA | JA | HA |
| Gramacy & Lee (2012) | 0.86799 | 0.86897 | 0.869011 |
| Levy function N.13 | 0.00346 | 0.00028 | 0 |
Figure 7 Convergence plot of Gramacy & Lee (2012) function.
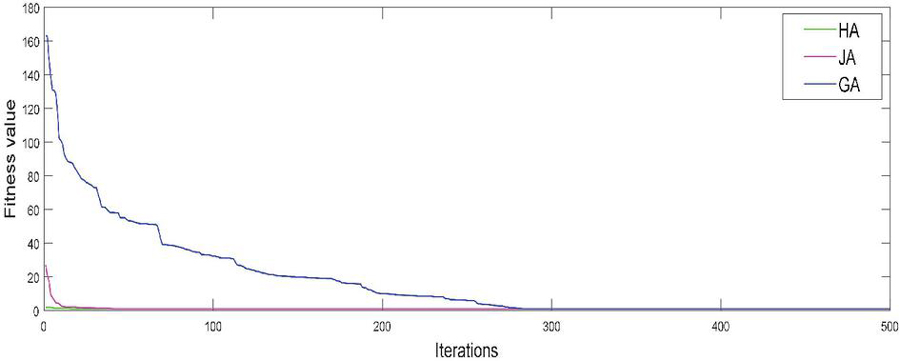
Figure 8 Convergence plot of Levy function N.13.
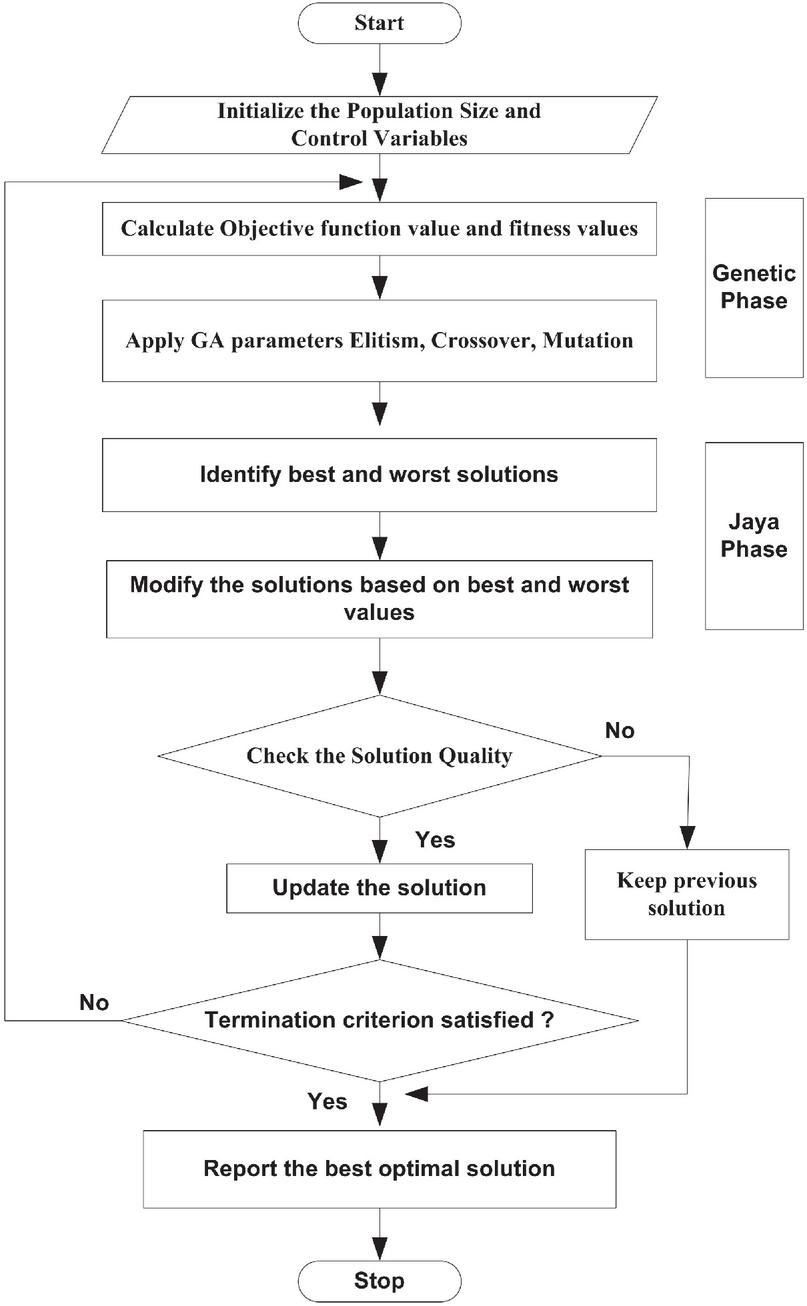
Figure 9 Flowchart of the Hybrid Algorithm.
The optimal results of two test function were tabulated in Table 2 and it is observed that the HA has outperformed GA and JA. Figures 7 and 8 illustrate the convergence graphs of both the test functions using GA, JA, and the proposed Hybrid approach, respectively. It is further observed from the convergence plots that the HA is performing better in comparison with GA and JA. The general flow chart for hybrid algorithm is shown in Figure 9. The step by step procedure of applying hybridized algorithm to the formulated problem is presented in Algorithm 1.
Algorithm 1 HA for the problem as stated.
1. Read data from the RDS (BusLine data), HA parameters, Seasonal Load Variation factors, and Renewable DGs (PV, Wind, and Hybrid(PV+Wind)) factors.
2. Select the season to study and set the hour
| (13) |
| (14) |
3. Execute the base case load flow without the use of DGs. Using Equation (15), calculate the total line losses.
| (15) |
4. Using Equation (16), calculate the voltage deviations.
| (16) |
5. Create a random starting population.
6. Begin counting iterations.
7. Convert the chromosomes to decimal numbers.
8. Normalize the decoded values by setting variable limits.
9. Calculate the system losses using the modified parameters.
a) Using Equation (17), update and run the load flow
| (17) |
b) Using the Equation (15), calculate the losses in the system.
c) Using the Equation (16), calculate the in the system.
d) For both objectives, create an index.
10. Using Equation (18), for all population, get the value of the fitness
| (18) |
11. Sort the fitness values of population in descending order.
12. Elitism, Crossover, and Mutation Operators should be used.
13. From the newly obtained parameters, find the best candidate and worst candidate.
14. Using Equation (10), update all the population by using best value and worst value.
15. Find the fitness values for the updated solution and compare with the fitness values in step (10).
16. Evaluate the updated answer as a new solution if it is better than the old solution; or else, only consider the existing solution.
17. Repeat the technique as many times as you want.
18. The desired solution is the first element of the sorted population.
19. Now, based on the solution, perform the load flow. Calculate voltage variations and losses.
20. Update the until 24 hours
4 Simulation Results
For the proposed approaches to be implemented on the IEEE 33 bus RDS and PGE 69 bus RDS, On a personal PC with an Intel (R) core i5 processor and 8GB RAM, MATLAB-R2021b was installed. The data for IEEE 33 bus RDS and PGE 69 bus RDS can be found at [14], and the single line diagrams of two test systems with renewable DGs can be found in Figures 1 and 2 respectively. Meta-heuristic based methods are used for optimal dispatch of Multiple DGs for hourly varying seasonal loads and hourly varying renewable DG generation within the MATLAB environment. By incorporating renewable DGs into the system, the overall losses and voltage variations in the test system can be reduced. The study proposes a HA that guarantees the best performance after combining two algorithms. The simulation results show that the Hybrid method is more efficient than the GA, PSO, SFLA, and JA algorithms. The study proposes a HA that guarantees the best performance after combining two algorithms. The simulation results show that the HA is more efficient than the GA, PSO, SFLA, and JA algorithms. The type, location and size of various renewable DGs considered for simulation pertaining to IEEE 33 bus RDS and PGE 69 bus RDS have been taken from Table 2. The plot of hourly variable load data [24] for this problem is shown in Figure 3. Figures 4, 5 and 6 illustrate the plot of renewable DG’s hourly power generation data [24] for PVs, Wind, and Hybrid (PV+Wind), respectively. The parameters considered for simulation using GA, PSO, SFLA, JA and HAs are represented in Table 3. GA and HA have the same parameters while JA is a parameter-less algorithm. To determine the best approach for effective power dispatch of numerous DGs while mitigating losses and voltage variations, two test systems were considered for simulation.
Table 3 Algorithm parameters
| GA | PSO | SFLA | JA | HA |
| =30 | =30 | =30 | =30 | =30 |
| =8 | ==2.05 | =5 | .. | =8 |
| =0.1, =0.8, =0.02 | =0.4, =0.4 | .. | .. | =0.1, =0.8, =0.02 |
4.1 Case Study I: Simulation on IEEE 33 Bus RDS
In this simulation study, the proposed metaheuristic techniques have been applied to IEEE 33 bus RDS with fixed locations for hourly varying seasonal loads and renewable DGs power generation. The hourly varying seasonal load data and renewable DGs data for this problem was taken from [24]. The plot of seasonal hourly varying load data in terms of percentage of total load is shown in Figure 3. Figures 4, 5, and 6 illustrate hourly fluctuating PV, Wind, and Hybrid power generation plots. The simulated results give the effect of DG’s integration into IEEE 33 bus RDS for minimization of losses and voltage deviations using GA for hourly varying seasonal loads through optimal power dispatch of 3 DGs based on hourly power generation capacity for the day. Here, 3 DGs were placed at bus number 14 (PV), 24 (Wind) and 30 (PV-Wind) respectively. In comparison to the base case results, the voltage variations and losses were significantly reduced following the integration of DGs into IEEE 33 bus RDS.
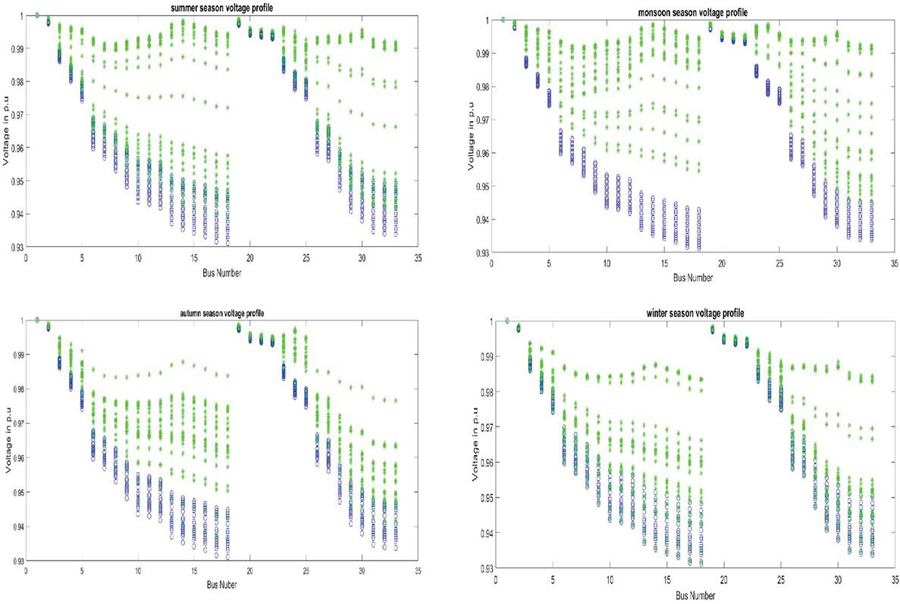
Figure 10 Plot of Voltage profiles of IEEE 33 bus RDS without and with DGs using GA during (a) Summer, (b) Monsoon, (c) Autumn and (d) Winter season.
The simulated results show how the HA compares losses and voltage deviations for hourly varying seasonal loads through optimal power dispatch of DGs power into the system for hourly varying seasonal loads. It is observed that both objectives were minimized after integration of 3 DGs into IEEE 33 bus RDS using HA. Figure 10 shows a voltage profile plot with DG integration using HA for hourly variable seasonal loads on IEEE 33 bus RDS for the summer, monsoon, autumn, and winter seasons, respectively.
Table 4 Mean value comparison of Voltage Deviation without and With DGs for IEEE 33 bus RDS using GA, PSO, SFLA, JA and HA during summer, monsoon, autumn and winter seasons
| Base Case | GA | PSO | SFLA | JA | HA | |
| Season | (p.u) | (p.u) | (p.u) | (p.u) | (p.u) | (p.u) |
| Summer (Week 1-13) | 0.061 | 0.0343 | 0.0343 | 0.0343 | 0.0342 | 0.0339 |
| Monsoon (Week 14-26) | 0.06315 | 0.0312 | 0.031 | 0.031 | 0.0308 | 0.0238 |
| Autumn (Week 27-35) | 0.05974 | 0.04705 | 0.04702 | 0.047 | 0.0469 | 0.03567 |
| Winter (Week 36-52) | 0.06189 | 0.04492 | 0.04489 | 0.04475 | 0.04456 | 0.04327 |
Table 5 Mean value comparison of Loss without and With DGs for IEEE 33 bus RDS using GA, PSO, SFLA, JA and HA during summer, monsoon, autumn and winter seasons
| Base Case | GA | PSO | SFLA | JA | HA | |
| Season | (p.u) | (p.u) | (p.u) | (p.u) | (p.u) | (p.u) |
| Summer (Week 1-13) | 0.1224 | 0.0817 | 0.0810 | 0.0805 | 0.0771 | 0.0767 |
| Monsoon (Week 14-26) | 0.1307 | 0.0752 | 0.0740 | 0.0740 | 0.0689 | 0.0685 |
| Autumn (Week 27-35) | 0.1270 | 0.0807 | 0.0800 | 0.0782 | 0.0765 | 0.0762 |
| Winter (Week 36-52) | 0.1258 | 0.0888 | 0.0864 | 0.0859 | 0.0848 | 0.0833 |
Table 6 RMS value comparison of Voltage Deviation without and With DGs for IEEE 33 bus RDS using GA, PSO, SFLA, JA and HA during summer, monsoon, autumn and winter seasons
| Base Case | GA | PSO | SFLA | JA | HA | |
| Season | (p.u) | (p.u) | (p.u) | (p.u) | (p.u) | (p.u) |
| Summer (Week 1-13) | 0.06122 | 0.04061 | 0.04055 | 0.04050 | 0.04034 | 0.040322 |
| Monsoon (Week 14-26) | 0.06327 | 0.03566 | 0.03555 | 0.03541 | 0.03521 | 0.025336 |
| Autumn (Week 27-35) | 0.06238 | 0.04774 | 0.04772 | 0.04770 | 0.04771 | 0.037332 |
| Winter (Week 36-52) | 0.06208 | 0.04769 | 0.04760 | 0.04752 | 0.04736 | 0.044759 |
Table 7 RMS value comparison of Loss without and With DGs for IEEE 33 bus RDS using GA, PSO, SFLA, JA and HA during summer, monsoon, autumn and winter seasons
| Base Case | GA | PSO | SFLA | JA | HA | |
| Season | (p.u) | (p.u) | (p.u) | (p.u) | (p.u) | (p.u) |
| Summer (Week 1-13) | 0.12374 | 0.08531 | 0.0840 | 0.08390 | 0.08004 | 0.07964 |
| Monsoon (Week 14-26) | 0.13173 | 0.07865 | 0.0775 | 0.07741 | 0.07005 | 0.06964 |
| Autumn (Week 27-35) | 0.12818 | 0.08281 | 0.0800 | 0.08000 | 0.07880 | 0.07845 |
| Winter (Week 36-52) | 0.12735 | 0.09228 | 0.0910 | 0.09103 | 0.088512 | 0.08850 |
It can be concluded from the results that HA provided the best optimal solution when compared to GA, PSO, SFLA and JA for both loss and Voltage deviation minimization. The comparative results of Mean and RMS values of voltage deviations and losses per unit of all five algorithms are tabulated in Tables 4 to 7. Here, it is apparent that the HA provided the best optimal solution in comparison with GA, PSO, SFLA and JA for reducing losses and voltage fluctuations. The comparison of computational time in seconds for GA, PSO, SFLA, JA and HA on IEEE 33 bus RDS is presented in Table 8. It is observed from Table 8 that the computational time taken by JA was lower in comparison with GA, PSO, SFLA and HA, while HA used up more computational time because of hybridization of both algorithms. In light of all the observations from the comparative results, it can be inferred that HA is performing better in comparison with GA and JA for arriving at optimal solution.
Table 8 Comparison of Computational Time in seconds for GA, PSO, SFLA, JA and HA on IEEE 33 bus RDS
| Season | GA | PSO | SFLA | JA | HA |
| Summer | 305.91 | 299.25 | 301.23 | 252.57 | 310.53 |
| Monsoon | 293.47 | 271.63 | 274.23 | 276.12 | 317.29 |
| Autumn | 288.86 | 247.89 | 278.29 | 261.78 | 310.83 |
| Winter | 301.13 | 243.52 | 288.47 | 261.34 | 305.53 |
Table 9 Economical benefit analysis of 3 renewable DGs electricity generation average costs in USD
| Season | GA | PSO | SFLA | JA | HA |
| Summer | 120.38 | 120.15 | 119.26 | 119.19 | 119.04 |
| Monsoon | 153.21 | 147.98 | 149.44 | 147.38 | 147.30 |
| Autumn | 74.61 | 73.08 | 71.97 | 71.00 | 70.80 |
| Winter | 79.23 | 79.20 | 77.56 | 77.57 | 77.27 |
In 2019, solar PV and new onshore wind farms have global weighted-average electricity costs of USD 0.068/kWh and USD 0.053/kWh, respectively. The average cost of electricity for combined solar PV and Wind farm is USD 0.121/kWh. In IEEE 33 bus RDS 3 DGs were placed at bus number 14 (2 units of PV), 24 (2 units of Wind) and 30 (one unit of PV-Wind) respectively. The maximum cost of renewable DGs with their maximum capacity of electricity generation was calculated and it was compared with the optimal power dispatch electricity cost of renewable DGs which gives the economical benefits. The average cost calculations with renewable DGs for all seasons using GA, PSO, SFLA, JA and HA were tabulated in Table 9.
4.2 Case Study II: Simulation on PGE 69 Bus RDS
To test the robustness of the proposed algorithm, simulations were run on PGE 69 bus RDS for hourly varying seasonal loads with renewable DGs integration. The hourly varying seasonal load data and renewable DGs data for this problem were obtained from [24]. Figure 3 depicts a plot of seasonal hourly varying load data expressed as a percentage of total load. Figures 4, 5, and 6 depict hourly fluctuating PV, Wind, and Hybrid power generation plots. The simulated results demonstrate the impact of DGs integration into PG & E 69 bus RDS for loss and voltage deviation minimization using GA for hourly varying seasonal loads via optimal power dispatch of 5 DGs based on the day’s hourly power generation capacity. In this case, 5 DGs of various combinations were integrated into the PG & E 69 bus RDS at bus numbers 11 (PV + Wind), 17 (Wind), 51 (PV), 54 (PV + Wind), and 61 (PV). The results show that after integrating DGs into the PG & E 69 bus RDS, voltage deviations and losses were reduced in comparison to the base case results.
The simulated results show the losses and voltage deviations caused by HA for hourly varying seasonal loads via optimal DG power dispatch into the system. Both objectives were minimized following the integration of 5 DGs into the PG & E 69 bus RDS using HA. Figure 11 depicts the voltage profile plot with incorporation of DGs using HA for hourly varying seasonal loads on PG & E 69 bus RDS for the summer, monsoon, autumn, and winter seasons, respectively.
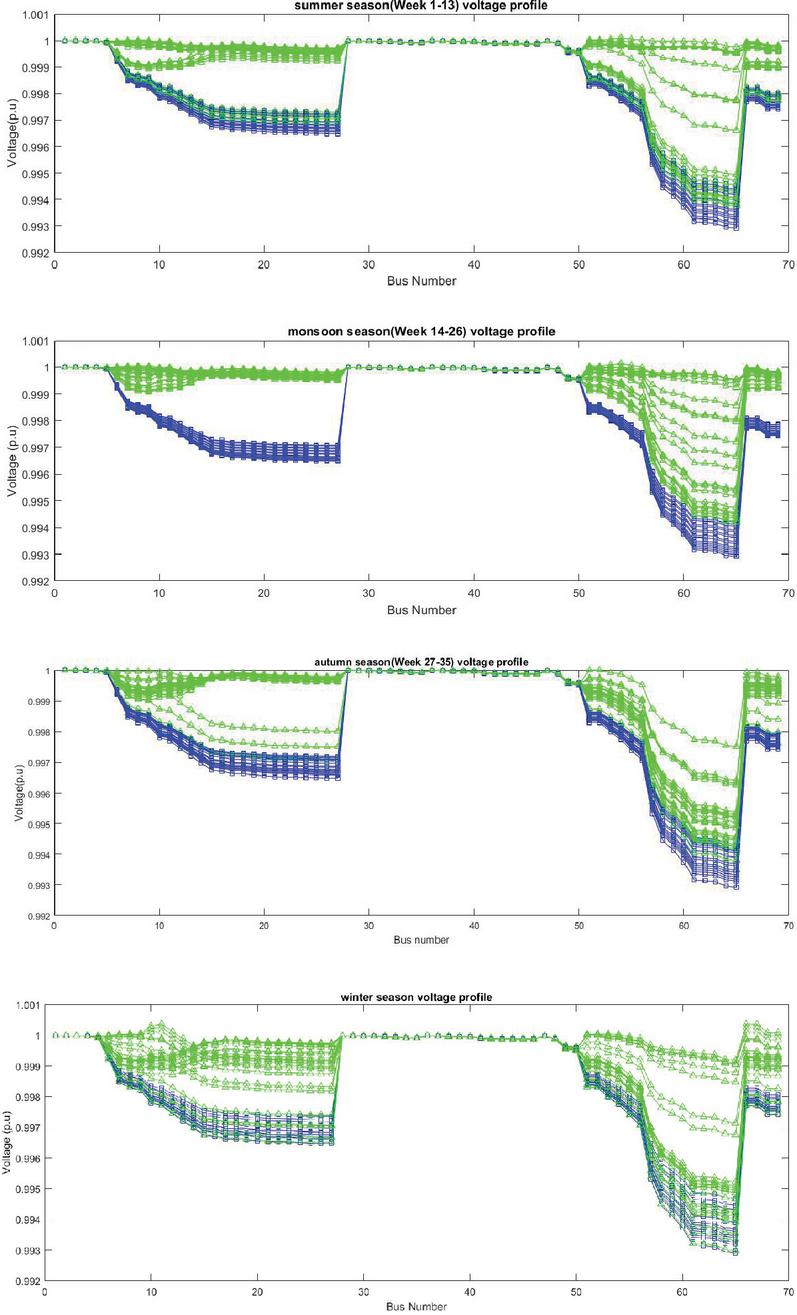
Figure 11 Plot of Voltage profiles of PGE 69 bus RDS without and with DGs using GA during Summer, Monsoon, Autumn and winter seasons, respectively.
According to the results, HA produced the best optimal solution when compared to GA, PSO, SFLA, and JA for both voltage deviation and loss minimization. From Tables 10 to 13, the comparative results of Mean and RMS values of voltage deviations and losses per unit of all three algorithms are tabulated. In this case, it is clear that the HA provided the best optimal solution in comparison to GA, PSO, SFLA, and JA for reducing losses and voltage fluctuations. Table 14 compares the computational time in seconds for GA, PSO, SFLA, JA, and HA on PG & E 69 bus RDS. Table 14 shows that the computational time taken by the JA algorithm was much lower when compared to other algorithms, whereas the HA algorithm took more computational time due to the hybridization of both algorithms. Based on all of the observations from the comparative results, it can be concluded that HA outperformed GA and JA in terms of arriving at an optimal solution.
5 DGs of various combinations were integrated in PG & E 69 bus RDS at bus numbers 11 (one unit of PV+ Wind), 17 (2 units of Wind), 51 (2 units of PV), 54 (one unit of PV+ Wind), and 61 (2 units of PV). The maximum cost of renewable DGs was calculated using their maximum capacity of electricity generation and compared to the optimal power dispatch electricity cost of renewable DGs, which provides economic benefits. Table 15 summarizes the average cost calculations with renewable DGs for all seasons using the GA, PSO, SFLA, JA, and Hybrid Algorithms.
Table 10 Mean value comparison of voltage deviation without and with DGs for PGE 69 bus RDS using GA, PSO, SFLA, JA and HA during summer, monsoon, autumn and winter seasons
| Base Case | GA | PSO | SFLA | JA | HA | |
| Season | (p.u) | (p.u) | (p.u) | (p.u) | (p.u) | (p.u) |
| Summer (Week 1-13) | 0.00628 | 0.00416 | 0.0041 | 0.00409 | 0.00342 | 0.00333 |
| Monsoon (Week 14-26) | 0.00650 | 0.00421 | 0.00412 | 0.00392 | 0.00348 | 0.0034 |
| Autumn (Week 27-35) | 0.00641 | 0.00502 | 0.00501 | 0.00500 | 0.00500 | 0.00425 |
| Winter (Week 36-52) | 0.00637 | 0.00480 | 0.00450 | 0.0045 | 0.00455 | 0.00449 |
Table 11 Mean value comparison of Loss without and with DGs for PGE 69 bus RDS using GA, PSO, SFLA, JA and HA during summer, monsoon, autumn and winter seasons
| Base Case | GA | PSO | SFLA | JA | HA | |
| Season | (p.u) | (p.u) | (p.u) | (p.u) | (p.u) | (p.u) |
| Summer (Week 1-13) | 0.01210 | 0.00781 | 0.0077 | 0.00772 | 0.00778 | 0.0077 |
| Monsoon (Week 14-26) | 0.01291 | 0.00799 | 0.0078 | 0.00772 | 0.00729 | 0.00767 |
| Autumn (Week 27-35) | 0.01255 | 0.009033 | 0.009033 | 0.009001 | 0.00882 | 0.00875 |
| Winter (Week 36-52) | 0.01242 | 0.00888 | 0.00881 | 0.00881 | 0.0088 | 0.00871 |
Table 12 RMS value comparison of voltage deviation without and with DGs for PGE 69 bus RDS using GA, PSO, SFLA, JA and HA during summer, monsoon, autumn and winter seasons
| Base Case | GA | PSO | SFLA | JA | HA | |
| Season | (p.u) | (p.u) | (p.u) | (p.u) | (p.u) | (p.u) |
| Summer (Week 1-13) | 0.006304 | 0.004796 | 0.00452 | 0.0044 | 0.00423 | 0.00421 |
| Monsoon (Week 14-26) | 0.006515 | 0.004421 | 0.0044 | 0.0043 | 0.00404 | 0.00396 |
| Autumn (Week 27-35) | 0.006426 | 0.005110 | 0.0051 | 0.0051 | 0.00509 | 0.00437 |
| Winter (Week 36-52) | 0.006398 | 0.004913 | 0.00489 | 0.00482 | 0.00491 | 0.00488 |
Table 13 RMS value comparison of loss without and with DGs for PGE 69 bus RDS using GA, PSO, SFLA, JA and HA during summer, monsoon, autumn and winter seasons
| Base Case | GA | PSO | SFLA | JA | HA | |
| Season | (p.u) | (p.u) | (p.u) | (p.u) | (p.u) | (p.u) |
| Summer (Week 1-13) | 0.01223 | 0.008384 | 0.0083 | 0.00835 | 0.008238 | 0.008232 |
| Monsoon (Week 14-26) | 0.01301 | 0.0008399 | 0.00829 | 0.008289 | 0.008232 | 0.007986 |
| Autumn (Week 27-35) | 0.01266 | 0.009229 | 0.009 | 0.009 | 0.009031 | 0.0090138 |
| Winter (Week 36-52) | 0.012574 | 0.009305 | 0.00921 | 0.0092 | 0.009199 | 0.0091469 |
Table 14 Comparison of Computational Time in seconds for GA, PSO, SFLA, JA and HA on PG 69 bus RDS
| Season | GA | PSO | SFLA | JA | HA |
| Summer | 512.8 | 501.33 | 505.71 | 316.53 | 520.38 |
| Monsoon | 537.26 | 511.56 | 521.23 | 335.3 | 543.05 |
| Autumn | 495.1 | 482.96 | 490.05 | 314.53 | 544.93 |
| Winter | 487.8 | 477.24 | 485.25 | 304.43 | 539.96 |
Table 15 Economical benefit analysis of 5 renewable DGs electricity generation average costs in USD
| Season | GA | PSO | SFLA | JA | HA |
| Summer | 224.31 | 223.05 | 212.41 | 210.96 | 210.69 |
| Monsoon | 317.26 | 313.41 | 313.51 | 312.94 | 312.81 |
| Autumn | 232.45 | 233.99 | 249.40 | 253.22 | 252.69 |
| Winter | 179.73 | 182.70 | 189.71 | 189.84 | 189.81 |
5 Conclusions
This paper looked into the effects of Meta-heuristic algorithms for optimal power dispatch with hourly varying seasonal loads and renewable DGs power generation with economical benefits in a radial distribution system to mitigate voltage deviations and losses. A Hybrid Algorithm was proposed by combining Genetic and Jaya algorithms for exploiting the advantage of individual algorithms. The effectiveness of proposed algorithm was validated in comparison with GA and JA by considering two test functions. In problem formulation, the hourly varying seasonal loads and hourly varying renewable DGs power generation were considered. The application of the proposed HA on IEEE 33 bus RDS and PGE 69 bus RDS was done under MATLAB environment. With the integration of multiple DGs (3 DGs in IEEE 33 bus RDS and 5 DGs in PGE 69 bus RDS) into the system for hourly varying loads and generations, the voltage deviations and losses were minimized. The electricity generation with renewable DGs and its economical benefit analysis with renewables has been studied. With renewable DGs, meta-heuristic algorithms save energy, improve voltage profiles, and provide cost savings. In this study, five metaheuristic algorithms viz. GA, PSO, SFLA, JA and HA were applied for achieving optimal solution. HA performed better in comparison with other algorithms for mitigating losses as well as controlling voltage deviations.
There is potential for choosing DG technologies in a good mix depending on local conditions and optimising algorithms accordingly in the future. Multiple objectives, such as DGs with uncertainties and network reconfiguration of RDS from small scale to big scale test systems, can be used to investigate the influence of hybrid metaheuristic algorithms. In the formulation of the objective function for sectionalised distribution systems that are operated as grid connected microgrids and islanding microgrids, the impact of DGs on protection due to uncertain behaviour of DGs such as renewable energy sources and the cost of protection could be considered.
References
[1] Hossein Haghighat. Energy loss reduction by optimal distributed generation allocation in distribution systems. International Transactions on Electrical Energy Systems, 25(9):1673–1684, 2015.
[2] Raimon O Bawazir and Numan S Cetin. Comprehensive overview of optimizing pv-dg allocation in power system and solar energy resource potential assessments. Energy Reports, 6:173–208, 2020.
[3] Max Roser Hannah Ritchie and Pablo Rosado. Energy. Our World in Data, 2020. https://ourworldindata.org/energy.
[4] Pavlos S Georgilakis and Nikos D Hatziargyriou. Optimal distributed generation placement in power distribution networks: models, methods, and future research. IEEE Transactions on power systems, 28(3):3420–3428, 2013.
[5] Mahmoud Pesaran HA, Phung Dang Huy, and Vigna K Ramachandaramurthy. A review of the optimal allocation of distributed generation: Objectives, constraints, methods, and algorithms. Renewable and Sustainable Energy Reviews, 75:293–312, 2017.
[6] RS Al Abri, Ehab F El-Saadany, and Yasser M Atwa. Optimal placement and sizing method to improve the voltage stability margin in a distribution system using distributed generation. IEEE transactions on power systems, 28(1):326–334, 2012.
[7] Yamina Ahlem Gherbi, Fatiha Lakdja, Hamid Bouzeboudja, and Fatima Zohra Gherbi. Hybridization of two metaheuristics for solving the combined economic and emission dispatch problem. Neural Computing and Applications, 31(12):8547–8559, 2019.
[8] Mona G Gafar, Ragab A El-Sehiemy, and Hany M Hasanien. A novel hybrid fuzzy-jaya optimization algorithm for efficient orpd solution. IEEE Access, 7:182078–182088, 2019.
[9] Jordan Radosavljević, Nebojša Arsić, Miloš Milovanović, and Aphrodite Ktena. Optimal placement and sizing of renewable distributed generation using hybrid metaheuristic algorithm. Journal of modern power systems and clean energy, 8(3):499–510, 2020.
[10] MM Othman, Walid El-Khattam, Yasser G Hegazy, and Almoataz Y Abdelaziz. Optimal placement and sizing of distributed generators in unbalanced distribution systems using supervised big bang-big crunch method. IEEE Transactions on Power Systems, 30(2):911–919, 2014.
[11] Satish Kansal, Vishal Kumar, and Barjeev Tyagi. Hybrid approach for optimal placement of multiple dgs of multiple types in distribution networks. International Journal of Electrical Power & Energy Systems, 75:226–235, 2016.
[12] Mirna Fouad Abd El-salam, Eman Beshr, Magdy B Eteiba, et al. A new hybrid technique for minimizing power losses in a distribution system by optimal sizing and siting of distributed generators with network reconfiguration. Energies, 11(12):1–26, 2018.
[13] S Arabi Nowdeh, I Faraji Davoudkhani, MJ Hadidian Moghaddam, E Seifi Najmi, Almoataz Y Abdelaziz, Abdollah Ahmadi, Seyed-Ehsan Razavi, and Foad Haidari Gandoman. Fuzzy multi-objective placement of renewable energy sources in distribution system with objective of loss reduction and reliability improvement using a novel hybrid method. Applied Soft Computing, 77:761–779, 2019.
[14] Tri Phuoc Nguyen, Thi Anh Nguyen, Thang Van-Hong Phan, and Dieu Ngoc Vo. A comprehensive analysis for multi-objective distributed generations and capacitor banks placement in radial distribution networks using hybrid neural network algorithm. Knowledge-Based Systems, 231:107387, 2021.
[15] AM Shaheen, AM Elsayed, AR Ginidi, RA El-Sehiemy, and E Elattar. A heap-based algorithm with deeper exploitative feature for optimal allocations of distributed generations with feeder reconfiguration in power distribution networks. Knowledge-Based Systems, 241:108269, 2022.
[16] Ankeshwarapu Sunil, Saikrishna Kongala, and Chintham Venkaiah. Metaheuristic techniques based optimal placement and sizing of multiple distributed generations in radial distribution system. In 2021 13th IEEE PES Asia Pacific Power & Energy Engineering Conference (APPEEC), pages 1–6. IEEE, 2021.
[17] Atinkut Bayu, Degarege Anteneh, and Baseem Khan. Grid integration of hybrid energy system for distribution network. Distributed Generation & Alternative Energy Journal, pages 667–675, 2022.
[18] S Naveen Prakash and N Kumarappan. Multi-objective optimal economic dispatch of a fuel cell and combined heat and power based renewable integrated grid tied micro-grid using whale optimization algorithm. Distributed Generation & Alternative Energy Journal, pages 1433–1460, 2022.
[19] Thiruveedula Ramana and G Nageswara Reddy. Optimal wtgus placement for performance improvement in electrical distribution system using improved tlbo. Distributed Generation & Alternative Energy Journal, pages 1637–1664, 2022.
[20] Shreya Mahajan and Shelly Vadhera. Optimal location and sizing of distributed generation unit using human opinion dynamics optimization technique. Distributed Generation & Alternative Energy Journal, 33(2):38–57, 2018.
[21] Nasir Rehman, Neeraj Gupta, et al. Optimal location of electric vehicles in a wind integrated distribution system using reptile search algorithm. Distributed Generation & Alternative Energy Journal, pages 141–168, 2023.
[22] Thiruveedula Ramana and G Nageswara Reddy. Optimal wtgus placement for performance improvement in electrical distribution system using improved tlbo. Distributed Generation & Alternative Energy Journal, pages 1637–1664, 2022.
[23] MCV Suresh and J Belwin Edward. A hybrid algorithm based optimal placement of dg units for loss reduction in the distribution system. Applied Soft Computing, 91:106191, 2020.
[24] Mahamad Nabab Alam, Saikat Chakrabarti, and Xiaodong Liang. A benchmark test system for networked microgrids. IEEE Transactions on Industrial Informatics, 16(10):6217–6230, 2020.
[25] R Rao. Jaya: A simple and new optimization algorithm for solving constrained and unconstrained optimization problems. International Journal of Industrial Engineering Computations, 7(1):19–34, 2016.
[26] Robert B Gramacy and Herbert KH Lee. Cases for the nugget in modeling computer experiments. Statistics and Computing, 22(3):713–722, 2012.
[27] MCV Suresh and J Belwin Edward. A hybrid algorithm based optimal placement of dg units for loss reduction in the distribution system. Applied Soft Computing, 91:106191, 2020.
[28] Muhammad Imran Akbar, Syed Ali Abbas Kazmi, Omar Alrumayh, Zafar A Khan, Abdullah Altamimi, and M Mahad Malik. A novel hybrid optimization-based algorithm for the single and multi-objective achievement with optimal dg allocations in distribution networks. IEEE Access, 10:25669–25687, 2022.
[29] Abdurrahman Shuaibu Hassan, Yanxia Sun, and Zenghui Wang. Multi-objective for optimal placement and sizing dg units in reducing loss of power and enhancing voltage profile using bpso-slfa. Energy Reports, 6:1581–1589, 2020.
Biographies

Ankeshwarapu Sunil received the M.Tech degree in Power System Engineering from the National Institute of Technology (NIT) Warangal in 2018. Currently, he is research scholar in the department of electrical engineering at NIT Warangal. His present research is in the area active distribution systems, networked microgrids, soft computing techniques.

Chintham Venkaiah received the PhD degree in Electrical Engineering from the National Institute of Technology (NIT) Warangal in 2014. Currently, he is an Professor in the Department of Electrical Engineering at NIT Warangal. His present research is in the area AI Technique applications to Power and Energy Systems; Power System Deregulation and Restructuring; Distribution Generation Technology; Economics and Financing of Renewable Energy Technologies; Power Procurement Strategy and Power Exchanges; Smart Grid Technologies; ICT applications to Power and Energy Systems; Effectual Entrepreneurship and Technology based Entrepreneurship Development.

Vinod kumar DM received the PhD degree in Electrical Engineering from the Indian Institute of Technology Kanpur in 1996. Currently, he is Professor (HAG) in the Department of Electrical Engineering at NIT Warangal. His present research is in the area of AI applications to Power Systems Engineering, Power System Stability, Power System Security, Power System Deregulation & Restructuring, Multi-Objective Evolutionary Algorithms Applications to Power Systems, Distribution System State Estimation, Distributed Generation Technologies, Smart Grid Technologies, Wide Area Monitoring and Control and Load Frequency Control of Micro grid.
Distributed Generation & Alternative Energy Journal, Vol. 38_5, 1531–1558.
doi: 10.13052/dgaej2156-3306.3858
© 2023 River Publishers