A Fault and Islanding Detection Scheme using Differential Positive Sequence Power Angle for a Microgrid
Salauddin Ansari* and Om Hari Gupta
National Institute of Technology Jamshedpur, Jharkhand 831014, India
E-mail: salauddinansari.ee@gmail.com; omggupta@gmail.com
*Corresponding Author
Received 15 January 2022; Accepted 05 July 2022; Publication 13 October 2022
Abstract
Implementation of distributed generation (DG) fault and islanding detection in a microgrid are two difficult jobs to complete. Efforts by many researchers to develop solutions to these a kind of challenges are ongoing. Still, there is hardly any scheme that can detect and distinguish both the fault and islanding events. To detect and differentiate between fault and islanding events, this article presents a Differential Positive Sequence Power Angle (DPSPA)-based protection technique. The scheme is widely examined considering different working conditions of a microgrid such as DG disconnection, DG penetration, different fault parameters like fault type, fault resistance, fault location, fault inception angle, fault during single-pole tripping (STP), simultaneous faults, and evolving faults. Tests were also performed for non-fault cases like load switching, capacitor switching, sectional cut-off, DG disconnection, and impact of noise and sampling frequency. Furthermore, the scheme’s outcomes have been compared to that of recent protection schemes. Finally, using the OP4510 real-time simulator, the proposed approach is validated in an online environment. The results show that the proposed DPSPA-based scheme can be a notable scheme to protect a microgrid in a wide variety of situations.
Keywords: Fault detection, islanding detection, microgrid protection, distributed generation, single-pole tripping, positive sequence components.
1 Introduction
With the rapid growth in pollutants generated by traditional energy sources, the usage of renewable sources like wind, solar, biomass, and fuel cells growing rapidly [1]. Protective relaying is a serious concern when these sources are gradually integrated into the conventional grid [2–4]. Classical fault detection approaches are based on overcurrent [5], current harmonic [6], and distance-based relaying [7]. The majority of these techniques are limited to the radial network only. The majority of these approaches work successfully just for radial networks. An adaptive protection scheme based on the change in steady-state fault current has been proposed in [8], however, this scheme is failing to detect high resistance fault. In [9], proposes an adaptive relay approach and investigates the impact of distributed generation penetration (DGP) on protective relay coordination. Yet, this approach applies to lesser DG penetration. As per [10], one may detect and locate the fault using a neural network-based approach. But this approach requires a large amount of data storage and certain network architecture to implement it. A current phase comparison scheme [11], using the phase jump of current and its rate change has been suggested. A high impedance fault, on the other hand, causes the scheme to fail to function properly. Incorporating data mining models to provide differential protection [12], has been suggested that uses various features of fault current and voltage signal. Heuristic algorithms are used in this scheme, which makes it tough to implement. A positive sequence current differential [13], based protection scheme has been suggested for microgrid which fails to detect high resistance fault. A differential spectral energy [14] based scheme using the Hilbert-Huang transform has been proposed. The biggest drawback of this scheme is that it may not work if the load is unbalanced. A travelling wave-based protection technique is presented in [15], Yet, such scheme needed high sampling rate-based measurement instruments.
In [16], a protection scheme using wavelet and data-mining approaches has been introduced for a microgrid. The limitations of the scheme include the vast amount of data needed for training as well as the risk of false detection in noisy environments. In [17] combined wavelet and fuzzy rule-based, similarly in [18] and [19], decision trees, using fuzzy rule-based and type-2 fuzzy rule-based, respectively, have been presented for protection of microgrid. With the three previously stated techniques it is hard to determine membership function and fuzzy rule. The research found that there is hardly any scheme available that can accurately detect and distinguish fault and islanding events. A Differential Positive Sequence Power Angle (DPSPA) based protection has been proposed in this paper to overcome all of these shortcomings.
The following are some of the most significant contributions offered by the suggested scheme:
• It detects both fault and islanding events.
• It is capable of detecting both symmetrical and asymmetrical faults.
• It distinguishes between internal and external faults.
• It is hardly affected by fault location, DG penetration, and inception angle of fault.
• It can accurately detect evolving and simultaneous faults.
• It is not influenced by non-fault cases such as capacitor switching, load switching, an induction motor starting, etc.
• Its performance is unaffected by the presence of noise and changes in sampling frequency.
• Proposed scheme compared with the recent existing scheme
2 Proposed Scheme
The DPSPA is a new indicator established by the suggested microgrid protection scheme for fault and islanding detection. The suggested protection approach is investigated using a simple two-bus network as illustrated in Figure 1.
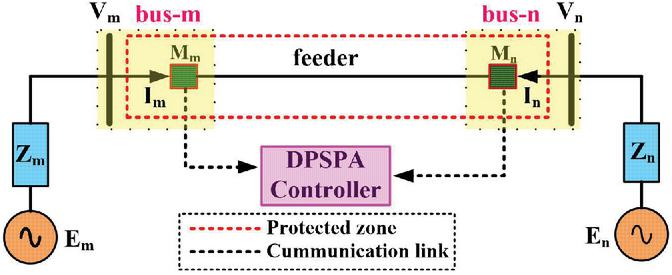
Figure 1 Equivalent two bus network.
A feeder, between m and n bus, having impedance Z is to be protected. On the two sides of the protected feeder, voltage and current are measured and therefore can be represented as
| (1) | ||
| (2) |
The positive sequence voltage and positive sequence current at the buses i.e., m and n are given by
| (3) | ||
| (4) | ||
| (5) | ||
| (6) |
Where suffix m and n denote the voltage and current measured at buses m and n correspondingly and suffix ‘1’ denotes the measured positive sequence component of variables for both buses. The positive sequence power is then obtained using (7) and (8) at both the buses and they are expressed as
| (7) | ||
| (8) |
Finally, a common index for both fault and islanding detection i.e., DPSPA can be expressed as
| (9) |
2.1 Relaying Scheme
There are two thresholds selected for the proposed scheme called ‘threshold’ and ‘threshold-1’. Based on the outcome of the proposed scheme for a number of cases, it was found that the DPSPA increases and remains positive for islanding cases while it remains negative but close to zero in the case of internal faults – which can be seen in simulation results later in Section 3. Therefore, keeping this outcome in mind and considering a large safety margin (the minimum value obtained from the results is 20%), the thresholds, i.e., threshold and threshold-1 were selected to be 3 rad and 0 rad, respectively. The first one is threshold 3 rad for fault detection and the second one is threshold-1 0 rad for islanding detection. Overall, the most suitable threshold is selected in such a way that the suggested scheme should work with all faults and islanding situations while restraining non-fault situations. Table 1 shows the overall outcomes of the proposed relaying scheme for various events. Table 1 shows that a common index (i.e., DPSPA) makes it simple to discriminate between various kinds of events. There is an internal fault when DPSPA is greater than the threshold and less than threshold-1, an islanding event when DPSPA is more than threshold-1, and an external fault when DPSPA is less than the threshold.
Table 1 Expected outcome of the proposed scheme
| S.N. | Types of Events | DPSPA | Relaying Criteria |
| 1 | Internal fault | Moderate | threshold DPSAP threshold-1 |
| 2 | Islanding | Very high | DPSAP threshold-1 |
| 3 | External fault | Negligible | DPSAP threshold |
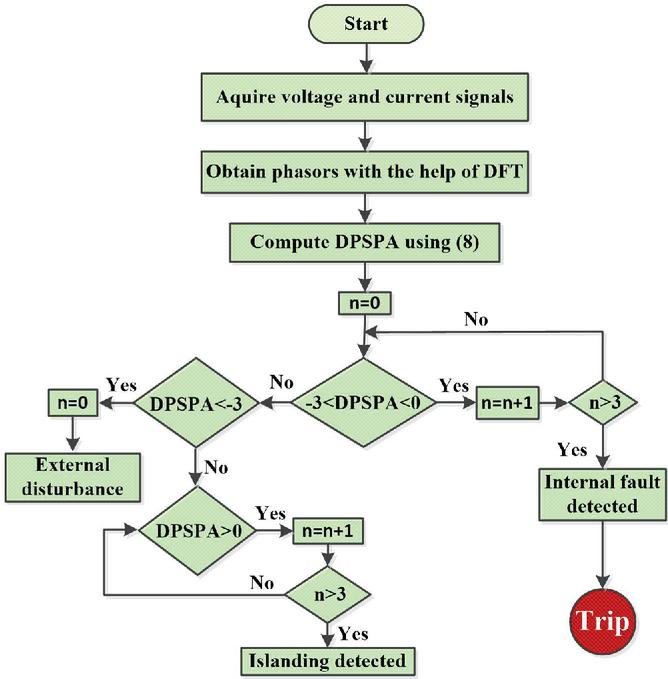
Figure 2 Flow chart of the proposed scheme.
Figure 2 shows the suggested scheme’s flow chart, which explains the step-by-step procedure. The voltage and current signals are first obtained. Following that, the phasors of the voltage and current signals are calculated with DFT. Now, using (9) DPSPA is obtained for the protected feeder. The flag, namely ‘n’ is initially set to zero. If the value of DPSPA is between 3 to 0 rad then counter start counting the value and if the statement is true for count value more than 3 (i.e., n 3) then it is declared as internal fault else goes to the previous state. If the value of DPSPA is less than 3 rad then counter stop counting and it is reported as an external disturbance. If the value of DPSPA is more than 0 rad (i.e., DPSPA 0 rad) then the counter starts counting the value, and if it is true for a count value more than 3 (i.e., n 3) then it will be an islanding event.
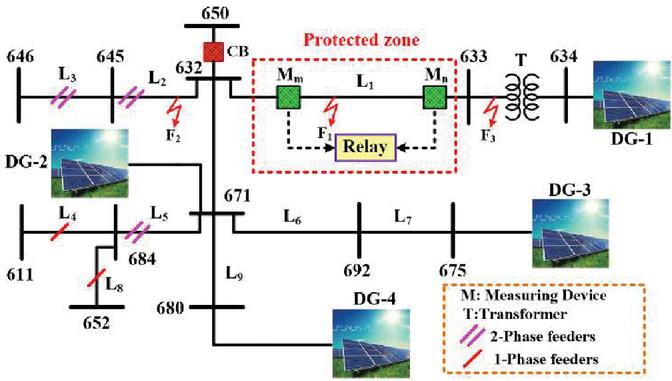
Figure 3 Test system considered for the proposed scheme.
3 Results and Discussion
The suggested technique has assessed the efficacy in terms of speed, ability to adapt, flexibility, and consistency in performing the simulation on the modified IEEE 13-bus system [20], as seen in Figure 3. The specification of integrated DGs and transformers are provided in Tables 2 and 3 respectively. The feeder data are taken from the paper provided in [20]. In this section, the proposed scheme’s performance is assessed under a variety of situations, including the following:
Table 2 Specification DGs
| Parameters | Value |
| Nominal power | 100 kW |
| Parallel String | 66 |
| Series connected module per string | 5 |
| Cells per module | 96 |
| Open circuit voltage | 64.2 V |
| Short circuit current | 5.96 A |
| Maximum power-point voltage | 54.7 V |
| Maximum power-point current | 5.58 A |
Table 3 Specification of a transformer (T)
| Parameters | Value |
| Power | 20 MVA |
| Primary voltage | 480 V |
| Secondary voltage | 4.16 kV |
| Configuration of winding | Yg |
| Inductance of winding | 0.02 PU |
| Resistance of winding | 0.011 PU |
3.1 Assessment for Different Types of Faults
To evaluate the scheme, various symmetrical and unsymmetrical faults for example a line to ground (a-g), line to line (ab), double line to ground (ca-g), and three-phase (abc-g) incepted in the middle of line L at 50 ms with a fault resistance (R) of 1 . The pre-fault value of DPSPA for the a-g fault is 3.146 rad, while the post-fault value is 2.5656 rad, as shown in Figure 4. It is observed that a-g fault is incepted at 50 ms and it is detected at 51.66 ms with a delay time of 1.66 ms. A similar study can be done for other types of faults also and it is found that detection time for other cases is near that range. Some of these cases are tabulated in Table 4, in which H represents the High status of the trip signal and it is found to exceed the threshold in all cases. The results show that the proposed scheme will maintain its consistency in the case of various fault types.

Figure 4 Variation in DPSPA for various fault types at the middle of the line L.
Table 4 Result of the scheme in different fault type and resistances
| Fault Type | R () | DPSPA (rad) | T (ms) | Trip Signal |
| a-g | 1 | 2.5656 | 1.66 | H |
| ab | 1 | 2.4949 | 01.00 | H |
| ca-g | 1 | 2.4756 | 03.00 | H |
| abc-g | 1 | 2.4034 | 01.00 | H |
| a-g | 10 | 2.6020 | 03.00 | H |
| a-g | 20 | 2.7351 | 04.33 | H |
| a-g | 30 | 2.8186 | 11.00 | H |
| a-g | 50 | 2.9143 | 14.33 | H |
| a-g | 70 | 2.9668 | 19.00 | H |
3.2 Assessment for High Resistance Faults
The majority of schemes suffer from varying levels of resistance to faults, specifically faults with high resistances of a-g type, which are difficult to detect because fault current decreases significantly with an increase in R. The DPSPA-based protection scheme is put to the test for this kind of fault, and the results are represented in Figure 5. Also for a-g faults with , the proposed scheme is found to cross the threshold with a detection time of 19 ms which is tabulated in Table 4. Development and evaluation of the proposed scheme for high resistance faults with higher than 70 are still being regarded for future research.
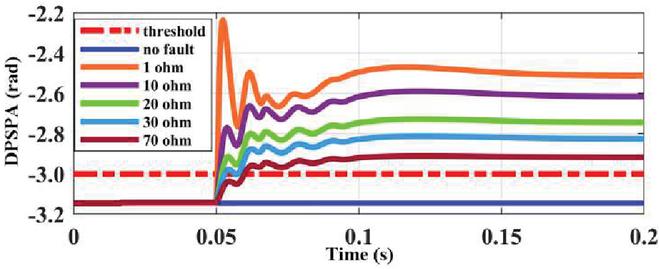
Figure 5 Variation in DPSPA for different values (fault in the middle of the line L).
3.3 Assessment for Different Fault
The location of the fault is another important factor that may impact detection. The method should be able to detect the fault in any part of the protected line. To do so, for a-g fault, the location of the fault occurring on the line L was varied from 10 to 95 percent of the actual line length at 50 ms, while R is maintained constant with 1 which is shown in Figure 6. It has been noted that the suggested technique will detect faults at various lengths of the line. The proposed scheme’s detection time for fault inception at various lengths was found to be near 1.66 ms. Thus, it is finalized that the suggested technique hardly depends upon the location of faults which indicates the accuracy of the scheme.

Figure 6 Variation in DPSPA under fault locations in the line L (a) 10 to 45% of the length (b) 60 to 95% of the length.
3.4 Assessment for Different Fault Inception Angles
Faults can happen at any point in time and might have a variety of waveforms and characteristics. The results of varying the fault inception angle are analyzed in this section. For this purpose, six different conditions of inception angle with a-g fault are considered on the line L shown in Figure 7 and for the better understanding corresponding result are tabulated in Table 5.
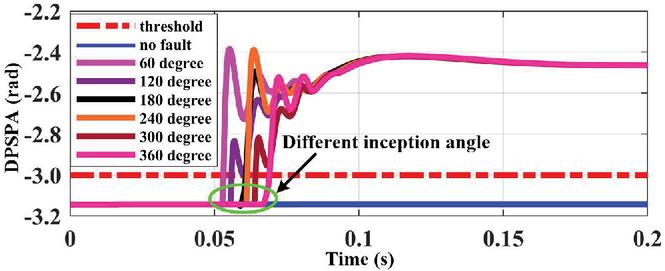
Figure 7 Variation in DPSPA under fault inception angle on the line L.
Since in all cases, as seen from Table 5, DPSPA is more than the threshold, the Trip signal will be high. Based on the above result and discussion, a conclusion can be drawn that the suggested technique is unaffected by the fault inception angle change.
Table 5 Result of the scheme in different fault inception angle
| Fault Inception Angle (degree) | DPSPA (rad) | T (ms) | Trip Signal |
| 60 | 2.4355 | 11.56 | H |
| 120 | 2.4349 | 14.78 | H |
| 180 | 2.4348 | 13.33 | H |
| 240 | 2.4334 | 11.55 | H |
| 300 | 2.4317 | 14.12 | H |
| 360 | 2.4314 | 12.34 | H |
3.5 Assessment for Single-pole Tripping
The system considers two conditions to assess the scheme’s performance when the fault occurs during Single-Pole Tripping (Assuming phase-a tripped while remaining power is transferred by the remaining two lines):
1. The inception of a line-to-ground fault in this two-phase system
2. The inception of a line-to-line or double line-to-ground fault in this two-phase system
For this, initially, an a-g fault is incepted at 0.05 s on the line L and single-pole tripping is maintained in the line by opening phase-a, at 0.1 s. During single-pole tripping, ab-g and bc-g fault were created separately at 0.15 s in the line, whose fault current with DPSPA variation is shown in Figures 8 and 9 individually. It can be easily seen that the proposed technique detects the fault still in the two-phase system accurately.
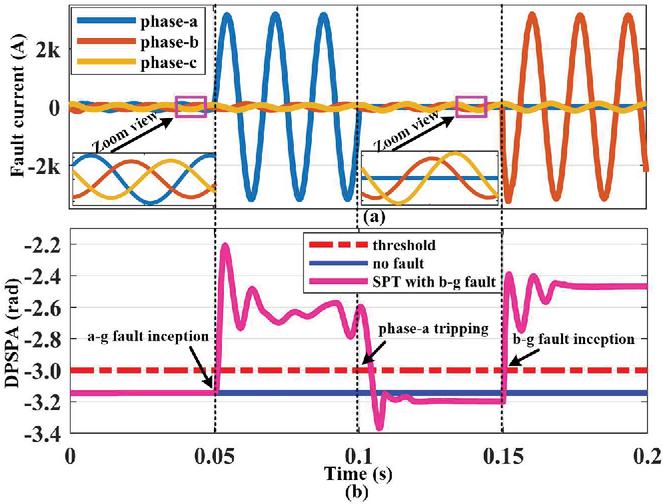
Figure 8 Single pole tripping in the line L (a) fault current (b) DPSPA variation with b-g fault.

Figure 9 Single pole tripping in the line L (a) fault current (b) DPSPA variation with bc-g fault
3.6 Assessment for different DG Penetrations
The tests are carried out with varying levels of DGP to see the change of DGP effects on the proposed DPSPA technique. At 0.05 s DG penetration is initiated at a step of 10% from 10 to 50 during a-g fault on the middle of the line L. Figure 10 shows the impact of DG penetration during a-g fault for the proposed scheme. The suggested approach efficiently identifies faults with large DGP level changes.
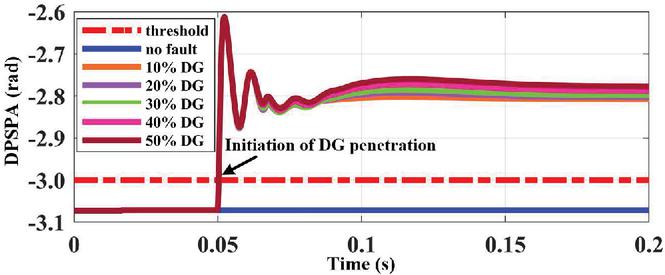
Figure 10 Variation in DPSPA with DG penetration with a-g fault on the line L for DG.
3.7 Assessment for Simultaneous Fault
The term “simultaneous fault” refers to a situation in which two or more faults occur at the same time. One of the most difficult problems to solve is a simultaneous fault. In this situation, an external bolted a-g fault is formed at just the left of bus-632, while an internal bc-g fault is formed at the middle of the line L at 0.05 s. As shown in Figure 11, the suggested technique can efficiently detect simultaneous faults.
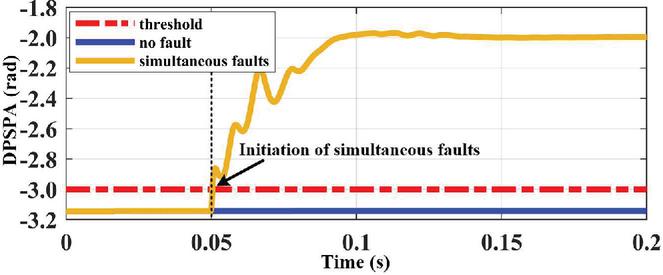
Figure 11 Change in DPSPA for simultaneous fault.
3.8 Assessment for Evolving Fault
To simulate the evolving fault situation, an a-g fault is created at 0.05 s and a bc-g fault is initiated at 0.15 s in the middle of line L with . The corresponding variation of DPSPA is shown in Figure 12 and It is noticed that the suggested technique works effectively in the presence of evolving faults as well.
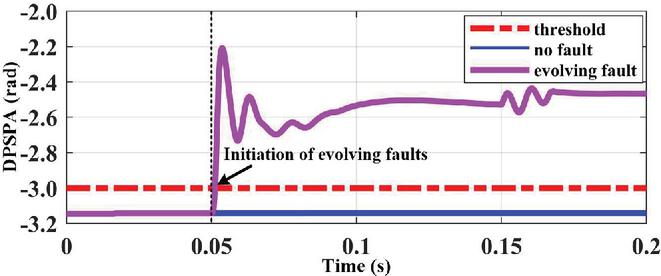
Figure 12 Change in DPSPA for evolving fault.

Figure 13 İmpact of noise during a-g fault (a) fault current variation (b) DPSPA variation.
3.9 Assessment for Noise in Measurement
Noise in the current signals has also been taken into consideration while evaluating the suggested technique’s reliability. A noise of 20 dB is intentionally added to the current signal and an a-g fault of is created in the middle of line L. The result of the 20 dB noise condition is shown in Figure 13 with noisy current and DPSPA variation. As can be observed in Figure 13, the suggested scheme is immune to the noisy environment.
3.10 Assessment for Change in Sampling Frequency
It is important to study the effect of changing sample frequency, a ca-g fault having at the middle of line L is created at 0.05 s, and data are sampled at a sampling frequency of 1.5, 3, and 6 kHz respectively. It can be seen from Figure 14 that, the suggested technique hardly depends upon the change in sampling frequency.
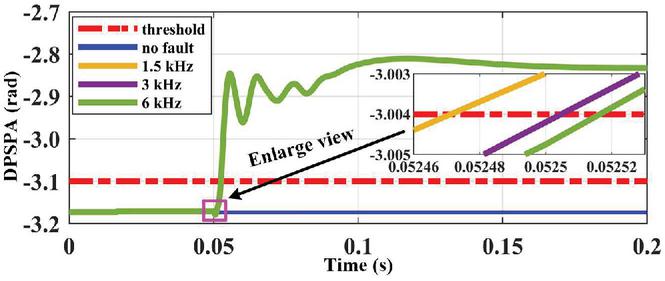
Figure 14 Variation in DPSPA with change in sampling frequency.
3.11 Assessment for External Fault
The relaying scheme should react to faults that occur inside its protective zone and must be insensitive to faults that occur outside of it. For this, numerous external faults are considered at one location that is very close to the protected zone, namely bus-632, and two locations that are far away, namely bus-671 and bus-695, respectively. All external faults are acg-g type having are created at 0.05 s in the middle of feeder L and the results are represented in Figure 15. It can be noted from Fig. 15 that the DPSPA never exceeded the threshold level for external faults which, proves the proposed scheme’s efficiency and accuracy against external faults.

Figure 15 Variation in DPSPA for external fault at various buses.
3.12 Assessment for Different Critical Non-Fault Conditions
During certain severe non-fault situations, the protection strategy must not be activated. To simulate such types of events, a capacitor of 1 MVA, a load of 500 kW, three phases full wave uncontrolled rectifier of 730 kW, and an induction motor of 9 HP are connected to bus-632 at 0.05 s and its DPSPA variation is shown in Figure 16. Similarly, a sectional cut-off of line L, single-pole tripping of phase-a of line L, disconnection of DG-1, and single-phase rectifier are initiated at 0.05 s and its corresponding DPSPA variation are shown in Figure 17. The results prove that the suggested technique is not influenced by any serious non-fault events that indicate the accuracy and robustness of the proposed scheme. For better understanding, all the non-fault cases are provided in Table 6 in which L represents the low status of the trip signal.

Figure 16 Variation of DPSPA with various non-fault conditions.

Figure 17 Variation of DPSPA with various non-fault conditions.
Table 6 Result of the scheme in different non-fault cases
| Non-Fault Cases | DPSPA (rad) | Trip Signal |
| Capacitor switching | 3.1428 | L |
| Load switching | 3.1427 | L |
| Motor starting | 3.1427 | L |
| Non-linear loading | 3.1427 | L |
| Sectional cut-off | 3.1425 | L |
| Disconnection of DG-1 | 3.1422 | L |
| SPT for phase-a | 3.1983 | L |
| Single-phase rectifier | 3.1425 | L |
3.13 Assessment for Islanding Event
It is very important to detect islanding as soon as possible otherwise there is a severe impact on the power system and maintenance worker. As per IEEE standard 1547-2008 [21], DG has to identify the islanding event and take away under 2 s. To simulate such a type of event, islanding is created by an opening line between bus-650 and bus-632 at 0.05 s. So islanding is initiated at 0.05 s and after 0.057 s i.e., at 0.107 s DPSPA crossed the threshold (i.e., threshold-1 which is 0 rad) therefore, islanding is detected at 0.107 s. The variation in DPSPA under islanding event and its respective trip signal is shown in Figure 18. As seen in Figure 18 the proposed scheme detects islanding as well with a detection time of 57 ms which is far below the 2 s marked by the IEEE 1547.
Numerous comparison characteristics, including DGP, fault during SPT, R, Fault location, Fault inception angle, Evolving, and simultaneous fault, Noise, and real-time validation, are listed in Table 7. It can be shown in Table 7 that the suggested technique has a significant advantage against the other seven schemes that have been published.
Table 7 Comparative analysis of the proposed technique with other existing techniques
| Comparison Aspect | Proposed scheme | [7] | [20] | [22] | [23] | [24] | [25] | [26] |
| DGP (%) | 50 | ✗ | ✗ | ✗ | 40 | ✗ | ✗ | ✗ |
| Fault during SPT | Yes | ✗ | ✗ | ✓ | ✗ | ✓ | ✗ | ✗ |
| R () | 70 | ✗ | 1000 | ✗ | 100 | 100 | 50 | 1000 |
| Fault location | ✓ | ✓ | ✗ | ✓ | ✓ | ✓ | ✓ | ✗ |
| Fault inception angle | ✓ | ✗ | ✗ | ✗ | ✗ | ✓ | ✗ | ✗ |
| Evolving and simultaneous fault | ✓ | ✗ | ✗ | ✗ | ✗ | ✗ | ✗ | ✗ |
| Noise in the signal | Yes | No | No | No | No | Yes | Yes | Yes |
| Change in sampling frequency | ✓ | ✗ | ✗ | ✗ | ✗ | ✗ | ✗ | ✓ |
| Islanding detection | Yes | No | No | No | No | No | No | No |
| Real-time validation | Yes | No | Yes | No | Yes | Yes | Yes | Yes |

Figure 18 Islanding condition (a) variation in DPSPA (b) trip signal.
4 Experimental Validation
The operational verification of the proposed scheme is conducted in a laboratory utilizing the OPAL-RT real-time simulator, as illustrated in Figure 19. The prototype is made up of several components, containing an OPAL-RT (simulator: OP4510, operating system: Redhat v2.6.29.6-opalrt-6.3.0, total core: 4, memory: 8 GB) for the test system simulation, a host PC (Intel Core i7-4770 @ 3.40GHz, RAM: 12 GB, system type: 64-bit operating system) for running the RT-LAB interface software, and OP5330 OP5330 DAC (No. of channel: 16, voltage range: 16 Volts) and mixed domain oscilloscope (Tektronix MDO3014, channels: 4, bandwidth: 100 MHz) to record experimental results. Before running the model, the test model has been built on the host PC using RT-LAB software. The test model has been divided into three main parts: the master, the slave, and the console. The model’s computational components are contained in the master and slave subsystems whereas the user-interface block is contained in the console subsystem. It has been converted to C code and then loaded into the simulator using the RT-LAB software for each core. Now, RT-LAB is used to execute the microgrid test model. After running the test model in RT-LAB, the OP5330 DAC module is being used to capture real-time analog output signals using the 4-channel MDO.
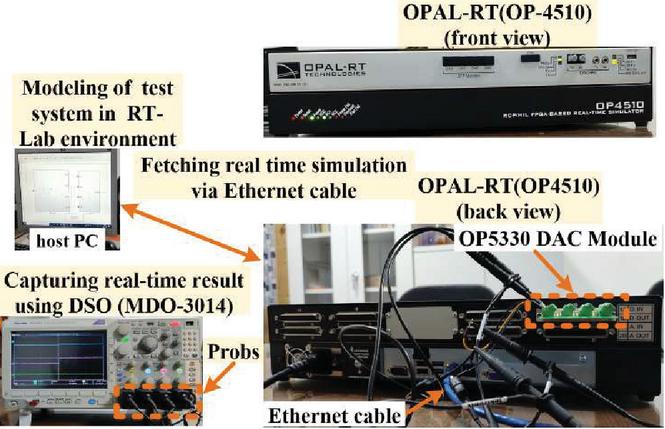
Figure 19 Setup for real-time validation of the proposed scheme.
Validation of the suggested technique using OPAL-RT, some cases are put into consideration. The obtained result for a-g fault at in the middle of protected line L is depicted in Figure 20. It can be seen that DPSPA exceeds the threshold (3 rad)after fault inception, as a result, fault detection signal (FDS) goes high whereas islanding detection signal (IDS) remains low – indicating an internal fault. Thereafter, an islanding event is created, and the acquired real-time result is represented in Figure 21. It can be observed that DPSPA is more than threshold-1 (0 rad) as a result IDS goes high whereas FDS remains low – indicating an islanding event.
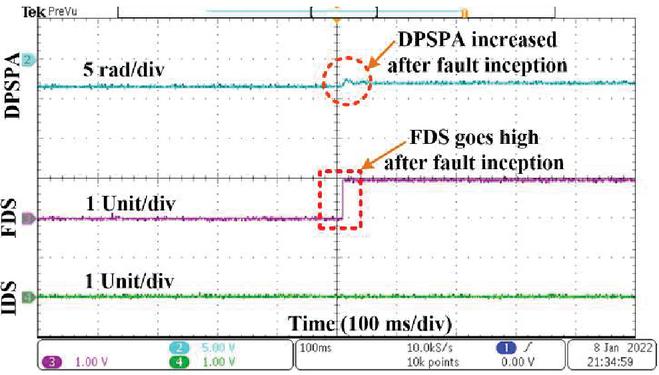
Figure 20 The real-time result obtained for a-g internal fault at the middle of protected line L with .
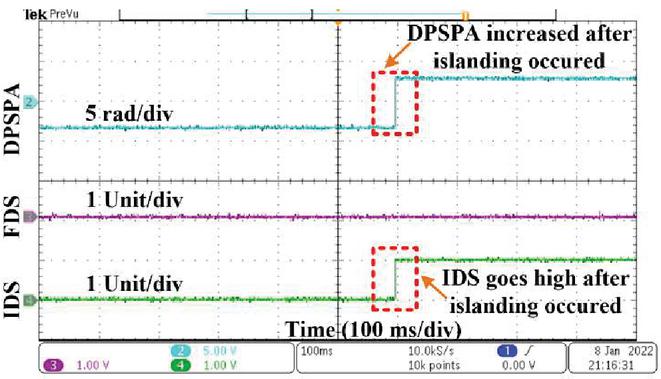
Figure 21 The real-time result obtained for the islanding event.
5 Conclusion
In this paper, a fault and islanding detection technique is proposed for a microgrid. A differential positive sequence power angle reveals a change during such conditions. The performance of the proposed technique has been validated by simulation for different situations like fault type, fault resistance, fault location, fault inception angle, fault during SPT, DGP, simultaneous fault, evolving fault, capacitor switching, load switching, motor starting, non-linear loading, sectional cut-off, DG disconnection, and islanding events. The impact of noise and sampling frequency on the proposed scheme is also verified. The obtained results show that the proposed scheme has the potential for effectively discriminating the fault and islanding events. Moreover, the proposed approach has been validated using a real-time simulation platform developed using OP4510. Based on various results, the proposed scheme was found to be accurate, selective, and reliable for the protection of microgrids.
References
[1] M. Stadler, A. Siddiqui, C. Marnay, H. Aki, and J. Lai, “Control of greenhouse gas emissions by optimal der technology investment and energy management in zero-net-energy buildings,” Eur. Trans. Electr. Power, vol. 21, no. 2, pp. 1291–1309, Mar. 2011, doi: 10.1002/etep.418.
[2] A. Hooshyar and R. Iravani, “Microgrid Protection,” Proc. IEEE, vol. 105, no. 7, pp. 1332–1353, 2017, doi: 10.1109/JPROC.2017.2669342.
[3] S. Parhizi, H. Lotfi, A. Khodaei, and S. Bahramirad, “State of the art in research on microgrids: A review,” IEEE Access, vol. 3, pp. 890–925, 2015, doi: 10.1109/ACCESS.2015.2443119.
[4] M. A. Zamani, T. S. Sidhu, and A. Yazdani, “Investigations into the control and protection of an existing distribution network to operate as a microgrid: A case study,” IEEE Trans. Ind. Electron., vol. 61, no. 4, pp. 1904–1915, 2014, doi: 10.1109/TIE.2013.2267695.
[5] P. Mahat, Z. Chen, B. Bak-Jensen, and C. L. Bak, “A simple adaptive overcurrent protection of distribution systems with distributed generation,” IEEE Trans. Smart Grid, vol. 2, no. 3, pp. 428–437, Sep. 2011, doi: 10.1109/TSG.2011.2149550.
[6] M. Petit, P. Bastard, X. Le Pivert, and C. Poulain, “Directional relays without voltage sensors for distribution networks: Use of symmetrical components and effect of the distributed generation,” in IEE Conference Publication, 2005, vol. 3, no. 2005–11034, pp. 429–432, doi: 10.1049/cp:20051185.
[7] I. Chilvers, N. Jenkins, and P. Crossley, “Distance relaying of 11 kV circuits to increase the installed capacity of distributed generation,” IEE Proc. - Gener. Transm. Distrib., vol. 152, no. 1, p. 40, Jan. 2005, doi: 10.1049/ip-gtd:20041205.
[8] J. Ma, X. Wang, Y. Zhang, Q. Yang, and A. G. Phadke, “A novel adaptive current protection scheme for distribution systems with distributed generation,” Int. J. Electr. Power Energy Syst., vol. 43, no. 1, pp. 1460–1466, Dec. 2012, doi: 10.1016/j.ijepes.2012.07.024.
[9] H. F. Habib, M. M. Esfahani, and O. Mohammed, “Development of Protection Scheme for Active Distribution Systems with Penetration of Distributed Generation,” in Conference Proceedings – IEEE SOUTHEASTCON, 2018, vol. 2018–April, doi: 10.1109/SECON.2018.8479087.
[10] N. Rezaei and M. R. Haghifam, “Protection scheme for a distribution system with distributed generation using neural networks,” Int. J. Electr. Power Energy Syst., vol. 30, no. 4, pp. 235–241, May 2008, doi: 10.1016/j.ijepes.2007.07.006.
[11] N. El Halabi, M. García-Gracia, J. Borroy, and J. L. Villa, “Current phase comparison pilot scheme for distributed generation networks protection,” Appl. Energy, vol. 88, no. 12, pp. 4563–4569, Dec. 2011, doi: 10.1016/j.apenergy.2011.05.048.
[12] S. Kar, S. R. Samantaray, and M. D. Zadeh, “Data-Mining Model Based Intelligent Differential Microgrid Protection Scheme,” IEEE Syst. J., vol. 11, no. 2, pp. 1161–1169, Jun. 2017, doi: 10.1109/JSYST.2014.2380432.
[13] H. Gao, J. Li, and B. Xu, “Principle and implementation of current differential protection in distribution networks with high penetration of DGs,” IEEE Trans. Power Deliv., vol. 32, no. 1, pp. 565–574, Feb. 2017, doi: 10.1109/TPWRD.2016.2628777.
[14] A. Gururani, S. R. Mohanty, and J. C. Mohanta, “Microgrid protection using Hilbert-Huang transform based-differential scheme,” IET Gener. Transm. Distrib., vol. 10, no. 15, pp. 3707–3716, Nov. 2016, doi: 10.1049/iet-gtd.2015.1563.
[15] X. Li, A. Dysko, and G. M. Burt, “Traveling wave-based protection scheme for inverter-dominated microgrid using mathematical morphology,” IEEE Trans. Smart Grid, vol. 5, no. 5, pp. 2211–2218, Sep. 2014, doi: 10.1109/TSG.2014.2320365.
[16] D. P. Mishra, S. R. Samantaray, and G. Joos, “A combined wavelet and data-mining based intelligent protection scheme for microgrid,” IEEE Trans. Smart Grid, vol. 7, no. 5, pp. 2295–2304, Sep. 2016, doi: 10.1109/TSG.2015.2487501.
[17] M. Dehghani, M. H. Khooban, and T. Niknam, “Fast fault detection and classification based on a combination of wavelet singular entropy theory and fuzzy logic in distribution lines in the presence of distributed generations,” Int. J. Electr. Power Energy Syst., vol. 78, pp. 455–462, Jun. 2016, doi: 10.1016/j.ijepes.2015.11.048.
[18] S. Kar and S. Ranjan Samantaray, “A Fuzzy Rule Base Approach for Intelligent Protection of Microgrids,” Electr. Power Components Syst., vol. 43, no. 18, pp. 2082–2093, Nov. 2015, doi: 10.1080/15325008.2015.1070384.
[19] S. B. A. Bukhari, R. Haider, M. Saeed Uz Zaman, Y. S. Oh, G. J. Cho, and C. H. Kim, “An interval type-2 fuzzy logic based strategy for microgrid protection,” Int. J. Electr. Power Energy Syst., vol. 98, pp. 209–218, Jun. 2018, doi: 10.1016/j.ijepes.2017.11.045.
[20] K. Dubey and P. Jena, “Impedance Angle-Based Differential Protection Scheme for Microgrid Feeders,” IEEE Syst. J., pp. 1–10, Jul. 2020, doi: 10.1109/jsyst.2020.3005645.
[21] IEEE, “IEEE Application Guide for IEEE Std 1547, IEEE Standard for Interconnecting Distributed Resources with Electric Power Systems,” IEEE Std 1547.2-2008, no. April, pp. 1–207, 2009, doi: 10.1109/IEEESTD.2008.4816078.
[22] S. Mirsaeidi, D. M. Said, M. W. Mustafa, and M. H. Habibuddin, “A protection strategy for micro-grids based on positive-sequence component,” IET Renew. Power Gener., vol. 9, no. 6, pp. 600–609, Aug. 2015, doi: 10.1049/iet-rpg.2014.0255.
[23] N. K. Sharma and S. R. Samantaray, “A Composite Magnitude-Phase Plane of Impedance Difference for Microgrid Protection Using Synchrophasor Measurements,” IEEE Syst. J., pp. 1–11, Jun. 2020, doi: 10.1109/jsyst.2020.2999483.
[24] M. A. Jarrahi, H. Samet, and T. Ghanbari, “Novel Change Detection and Fault Classification Scheme for AC Microgrids,” IEEE Syst. J., vol. 14, no. 3, pp. 3987–3998, Sep. 2020, doi: 10.1109/JSYST.2020.2966686.
[25] P. K. N. Bhatraj Anudeep, “Differential Power Based Selective Phase Tripping for Fault-Resilient Microgrid |SGEPRI Journals & Magazine |IEEE Xplore,” J. Mod. POWER Syst. CLEAN ENERGY, no. 09 March 2021, pp. 1–12, 2020, doi: 10.35833/MPCE.2020.000194.
[26] M. Biswal, S. Ghore, O. P. Malik, and R. C. Bansal, “Development of Time-Frequency Based Approach to Detect High Impedance Fault in an Inverter Interfaced Distribution System,” IEEE Trans. Power Deliv., 2021, doi: 10.1109/TPWRD.2021.3049572.
Biographies

Salauddin Ansari received the M.Tech. degree in power electronics and drives in 2019 from the Department of Electrical Engineering, National Institute of Technology Jamshedpur, India where he is currently working towards the Ph.D. degree. His research interests include microgrid protection and islanding detection.

Om Hari Gupta (Senior Member, IEEE) received the PhD degree in electrical engineering from the Indian Institute of Technology Roorkee, Uttarakhand, India. He has visited Ontario Tech University (Formerly, University of Ontario Institute of Technology – UOIT), Oshawa, Canada, for the research on microgrid operation. Currently, he is an Assistant Professor in the Department of Electrical Engineering, National Institute of Technology Jamshedpur, India. Dr. Gupta is a recipient of Queen Elizabeth-II scholarship for pursuing research on microgrid operation at Ontario Tech University, Canada. His research interests include power system compensation and protection, microgrid control and protection, and control of drives.
Distributed Generation & Alternative Energy Journal, Vol. 37_6, 1823–1846.
doi: 10.13052/dgaej2156-3306.3765
© 2022 River Publishers