Research on Intelligent Fault Diagnosis of Wind Power Generation System Based on Data Fusion
YuHang Tan1,*, KangYou Liang1 and ZhenTao Zhang2
1School of Electronic Information and Electrical Engineering, Chongqing University of Arts and Sciences, Chongqing Yongchuan, 402160, China
2Chongqing Institute of Metrology and Quality Testing, Yubei, Chongqing 401120, China
E-mail: 20150045@cqwu.edu.cn
*Corresponding Author
Received 14 June 2022; Accepted 11 July 2022; Publication 13 October 2022
Abstract
With the consume of traditional petrifaction energy origin such as coal, matelote and physical gas and the increasingly serious question of entire warming, the penetration ratio of wind power in the energy economy continues to enhance. Wind farms are generally built-in areas with strong winds, tough working environments and a high probability of equipment failure. Faults on large grid-connected wind turbines will seriously influence the safety and stability of conventional strength grids. In addition, unplanned maintenance after a breakdown of wind turbines needs a lot of manpower and corporeal resources, which greatly decrease the efficiency of wind strength production and enhance production costs. Therefore, the key to solving the above problems is to quickly and efficiently identify fan faults, which in turn enables accurate troubleshooting. In the article, the malfunction diagnosis of intelligent wind power system based on data fusion is discussed, and it is found that the GBoost algorithm has high accuracy in detecting sensor gain error, sensor offset error and sensor standard error when the Gaussian white-to-noise ratio exceeds 45 dB. In addition, DBN has different diagnostic effects for different faults with different Gaussian noises, at 45 dB and 35 dB, each type of error varies slightly, and the dotted line varies; at 25 dB, each type of error has a large difference. The difference is large, indicating that at 25 dB, this type of error is more sensitive; comparing the state estimation effect makes DLSTM have good adaptability to time series, and also shows that DLSTM considers the system to be reliable enough, and can be obtained by data fusion of the parameters of each system. What is the state of its system, and then take corresponding measures.
Keywords: Data fusion, wind power generation system, intelligent fault diagnosis.
1 Introduction
Combined with the basic design of wind turbines, the types and failure mechanisms of wind turbines are introduced, and the practical application of condition monitoring and malfunction diagnosis methods is described. Based on the theory and advantages of BP neural network, the use of artificial neural network to build an intelligent fault diagnosis system is discussed in detail, and the functional system design diagram and software are provided [1]. Aiming at the question of low malfunction diagnosis rate of large permanent magnet wind turbines, a typical short circuit simulation model is built on the basis of generator design, and the typical short circuit is studied by combining thermal field and electromagnetics. Using the same model, the field circuit switching method solves the electromagnetic and thermal fields to obtain data and the distribution of the electromagnetic and thermal fields when a fault occurs. PNN is mainly based on the dynamic diagnosis of the system, by combining different data (instantaneous magnetic field temperature and vibration characteristics) to evaluate the occurrence of single or multiple faults for short-circuit diagnosis. Combined with experimental data from permanent magnet direct-use samples, wind farm generators, and rotational data, paper diagnostics and faults are classified through theoretical combined testing, classification, and comparison of diagnostic results [2]. The construction and operation of gas fields has become an integral part of the growth of the clever city. But, the malfunction in the network operation circuit has some reception errors, which are very relevant for the normal operation of high-end urban drivers. Since the new fault analysis method cannot use a single data source in the main circuit, a method is proposed to determine the combination of fault indicators and fault analysis data sources. By combining two SCADA data sources, real-time monitoring economy data and major vibration circuit monitoring data, the main features of the circuit are obtained and an intelligent elaboration model of sin. The analysis results show that the malfunction model due to the combination of the two data sources can accurately identify faults in key fan functions and provide reliable technical support for performance and maintenance [3]. This article introduces a new smart way of problem detection due to Multimodal in-depth research, which combines chatter and operational semaphore to investigate transmission faults in wind turbines. This method is considered to be a separate attribute learning network and attribute aggregation network, mainly due to the prevalent deep studying model called Deep Faith Network (DBN). First, two separate DBNs were devoted to the study of the properties associated with the disturbance of surface vibrations and current semaphore; then combines the vibration-based analysis stuff with current characteristics and a third DBN for final evaluation, which tests the suggested method in the test area for gas electric motors. The test results show that this method is considered more of a reference method based on the combination of a single signal and a data plan for analysis accuracy, relative to other statistical vibration information and current symptoms [4]. To improve the error correction accuracy of the fan control system, an error correction method for neural networks has been proposed. Due to the different methods of transmission control, the accuracy of the probe depends on the control environment and the transmission vibration signal. In addition, the oscillating signal offers non-linear, non-flat and complex properties. The error characteristics of the oscillating signal are determined based on the combined data. Based on the data obtained from the signal analysis, the slow network is used to model the error analysis and provide changes in the analysis of network parameters. The simulation results show that the method chosen for taking the action may reflect the nature of the metal defects, and that the error analysis system created by the neural network is clearly not very accurate in detection of errors [5]. Due to the continuous growth in the size of the gas field, the construction, operation and management of gas fields is becoming increasingly important. To enhance the trusty of reception error analysis, in conjunction with data driven technique, a multi-malfunction reception analysis way based on a neural frequency network has been proposed. In the light of the wind rate data, regular surgery and fault data for the production system shown in the system simulation, the classification forecast model is due to the nerve network arithmetic, it is said yes. 10 different output error signs for wind turbines. The model learns the specific rules learned in the host model with continuous model training, optimization, and testing to ensure arithmetic efficiency. Comparing parameters for example accuracy, lack of detection speed, target F1 and other similar arithmetic such as network depth trust shows that the suggested arithmetic can solve analytical problems with errors in multifactor in gas systems [6]. The invention relates to a malfunction arithmetic technology for an intelligent fan, in particular to a fault diagnosis method for an intelligent fan based on fault detection. The method adopts the fault sample with the highest success rate and the minimum support square vector regression. Operated using the PSO algorithm and trained to create a failure detection pattern for fan troubleshooting, the success rate of the error database is the change made on each success or failure, diagnostics and updates are added. The invented intelligent diagnosis method helps to better identify the failure of the fast end of the wind turbine, and avoids the situation that the wind farm maintenance personnel cannot read the wind farm correctly or do not know the monitoring data. The invented intelligent diagnosis method can better detect the terminal failure of high-speed wind turbines, and avoid the disadvantage that wind farms cannot read the monitoring data of wind turbines correctly without professional knowledge. It has many advantages [7]. In view of the problem of misdiagnosis of a photovoltaic power generation system, a method of misdiagnosis of a photovoltaic power generation system based on deep confirmation learning has been provided. First the missing PV data is filled in with a compression algorithm, then the state of the environment, functions, policies and recovery functions are filled in. Based on factors such as interaction laws, a misdiagnosis model is built for solar cell production systems and a deep neural network is used to approach the optimal the strategy for diagnosing the disturbances in solar cell production. Finally, the efficiency and accuracy of the method are ensured by simulation. The simulation results show that this method can accurately diagnose types of faults in PV systems, which is of great importance for improving the safety and performance of PV systems [8]. The article presents an electrical system and develops suitable agents for the proposed system using multithreading techniques, which is implemented with a mix of PROLOG and JAVA. Experiments on a developed prototype of the proposed system show that a new method for diagnosing faults is possible. This can improve the system’s responsiveness to power outages and lower current diagnostic goals when its environment changes significantly [9]. Based on the STAR-90 power plant simulation technology, a prototype system of intelligent fault diagnosis for thermal power plant systems is being developed. It can easily realize the multiplexing of fault diagnosis information and the development of fault diagnosis system. The main algorithm of fault diagnosis of intelligent heating system based on modular modeling method is introduced, and an example of fault diagnosis of high pressure heating system of 300 MW unit is given [10]. A real-time intelligent diagnosis system architecture based on full data fusion was developed, and the cluster analysis method and genetic optimization algorithm were introduced into the traditional BP neural network to reduce the complexity of BP neural network training and improve the training efficiency and accuracy. The method of genetic neural network and the method of fuzzy inference system of adaptive neural network are integrated in the data fusion diagnosis layer, which improves the reliability of misdiagnosis and makes full use of the diagnosis information in the diagnosis data. D-S evidence theory is used to analyze decisions at the decision level in order to effectively use the diagnostic results of each diagnostic unit. Simulation tests confirm that the diagnostic system can diagnose errors quickly, accurately and reliably [11]. The article examines control and data acquisition data (SCADA), examines fan status data, design of fault diagnosis models, and data-based monitoring of air conditioning functions. The magician’s point of view. First, in view of the problem that the noise density-based spatial clustering algorithm (DBSCAN) cannot detect high-density abnormal data, an abnormal data processing method that combines the density clustering algorithm with the normal power range estimation is proposed to improve the wind direction. Wind Turbine Performance Data Accuracy for Wind Turbine Performance. Secondly, for the multi-parameter problem, a proportional optimization system based on Bayesian Optimization Algorithm (BOA) and three models is proposed, which improves the efficiency and accuracy of intuitive mapping. Monitor data from SCADA fault identification systems. Finally, based on the multi-function integration of monitoring parameter data, the fan condition monitoring circuit is designed. The proposed fan condition monitoring system can report generator system failure for 3.67 hours, driveline failure for 5.17 hours, and hydraulic system failure for 2.33 hours [12]. According to five dimensions of total power forecast, plant data, unique machines and resources, plant availability, AGC order balance, and AGC order follow-up, determine the reasons for the difference in operating hours, input performance and energy consumption of wind farms in the same area. By collecting data and the extraction attribute analysis determines the opening time, and strives to reveal the key factors affecting the opening time of different regions. Based on the results, individual measures to improve the operating time of the power plant are proposed, and the resulting calculation method is applied to the wind power data of a specific province, and the time difference function is analyzed [13]. Identify network patterns for condition assessment modeling by integrating real-time data from multiple sources such as SCADA, PMU, and safety and robustness systems. When the limit or node current fault voltage is high, the wind power range of active power control is determined by considering the measurement data collected by the wind farm central control system and the wind power prediction data of energy prediction. The performance of wind farms is determined by a quadratic programming model, where wind farms are grouped according to the topology of the wind farm, and then each group is divided according to static characteristics and operating conditions, and is dynamically equal. Calculate wind turbines and transformers based on model and static parameters. The proposed method has been shown to be fast and efficient in analyzing real mesh examples [14]. Given the disadvantages of low frequency, non-uniformity, non-linearity and difficult detection of the wind axis oscillation signal, a graph based on melting data is offered. Wave noise attenuation has been proposed to attenuate oscillating signals and noise attenuation from several EEMD-based sources. The experimental results show that the graph is consistent with the theoretical calculation of the characteristic error rate, which fully demonstrates the efficiency of the magnetic rotor fault diagnosis system [15]. The wind power system is applied in other scenarios, for example, correlation analysis between wind energy production and pumping [16], and periodic analysis of wind power system [17].
2 Wind Power Generation System
2.1 Composition of Wind Turbines
A wind power generation system is a motor that converts wind energy into mechanical energy [18], and then converts mechanical energy into electrical energy, also known as a wind turbine. Generally, it is a motor that collects thermal energy, with the sun as the heat source and the atmosphere as the working fluid. For centuries, wind turbines, like hydraulic presses, have played an important role in increasing productivity as an alternative to human and animal power. Wind turbines can be divided into three parts: wind turbines, machines and towers. A wind turbine consists of three parts: the hub, the blades, the stepped system and the casing. The machine is the most complex, including the main shaft system, transmission, alternator, rotating system, braking system, cooling system, cover, anemometer and other parts.
2.2 Fault Mechanism of Wind Power Generation System
Ventilation failure can be divided into mechanical failure and electrical failure according to the type. When it comes to defective parts, most are cutters, gearboxes and generators. According to domestic and foreign statistics, power outages for large wind turbines are mainly concentrated in large components such as blades, gearboxes, generators and main propulsion circuits. One of them is the lack of wind turbines. A wind turbine system consists of a hub and rotor designed to convert wind energy into mechanical energy. Among them, the magnetic pole failure is mainly due to the abnormal operation caused by mechanical fatigue. Another important factor is the disadvantage of the chain. The main chain drive system is composed of main bearings, gears, main shafts and other components, which are used to connect the main bearings and generators, and are the hinge parts of the hurricane. Shipping is the most important part. The internal structure of the transmission and the load box are very complex and more prone to damage due to rapid changes in operating environment and load. The third failure is a mechanical failure in the system. The mechanical braking system includes braking system, reversing system and generator system. The defects of the first two are mainly due to excessive fatigue of the particles added to the oil due to lubrication irregularities. Such power outages rarely occur during scheduled maintenance. Fourth, generator failure. Generator faults usually include winding faults, including stator windings and rotor windings. Defects in stator and rotor windings are mainly due to short circuits. Fifth, the electronic power is insufficient. These faults are mainly capacitor lines, circuit faults, semiconductor devices and so on. Sensors are a common failure, accounting for about 14% of all failures. Other factors that can cause damage to power electronics include ambient humidity, temperature, and various vibrations. As shown in Figure 1 below.
(1) Mechanical failure. Generally, occurs in the wind turbine system, the main transmission chain and the mechanical braking system;
(2) Electrical failure. The electrical faults of wind turbines mainly include: control system faults, generator electrical part faults, power electronic converter faults and circuit electrical faults in other parts.
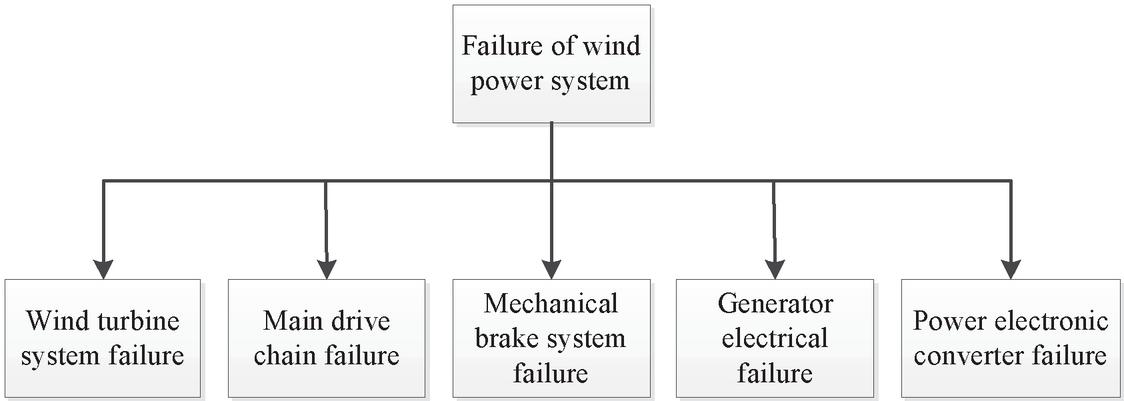
Figure 1 Failure of wind power generation system.
2.3 Main Fault Diagnosis Methods
One is error signaling and handling. When a failure occurs, the signal data collected from various sensors changes frequently. Therefore, the analysis and use of each signal value is useful for quick diagnosis, problem location and even early failure. The following are some commonly used important control signals: vibration signal, temperature signal, acoustic emission signal, strain gauge signal, lubricating oil signal, electrical signal, SCADA signal and other fault signals. In addition to the above generally important fault signals, there are also X-ray detection signals, infrared temperature signals, ultrasonic scanning signals, etc. These models are very suitable for diagnosing fan blade faults. It is relatively easy to receive these signals, usually using portable equipment. The second is an algorithm for diagnosing faults. Fault diagnosis is a technology with strong technical feasibility. With the continuous development of modern advanced technology, the progress of modern science and technology development is continuously accepted by people in fault diagnosis. Fault diagnosis is closely connected with disciplines such as automatic control, system detection, artificial intelligence, sensor monitoring, computer, mechanical dynamics and vibration technology. The close combination of these disciplines has produced many advanced and efficient troubleshooting techniques, namely expert system diagnosis, artificial neural network algorithm diagnosis, wavelet transform diagnosis, fuzzy logic diagnosis and algorithm diagnosis, Gray’s theory method for diagnosing faults, and methods for diagnosing shell faults. As shown in Figure 2 below.
One is fault signal and processing. When a fault occurs, the signal data collected by various sensors often have some changes. Therefore, analyzing and using each signal quantity is helpful for rapid diagnosis, locating the problem, and possibly even realizing the early warning of the fault. Several important monitoring signals commonly used: vibration signal, temperature signal, acoustic emission signal, strain sensor signal, lubricating oil signal, electrical signal, SCADA signal, other fault signals.
The second is the fault diagnosis algorithm. There are many advanced and effective fault diagnosis methods, namely expert system fault diagnosis, ANN algorithm fault diagnosis method, wavelet transform fault diagnosis method, fuzzy logic fault diagnosis method, fault tree fault diagnosis method, grey theory fault diagnosis method, Troubleshooting methods for the case.
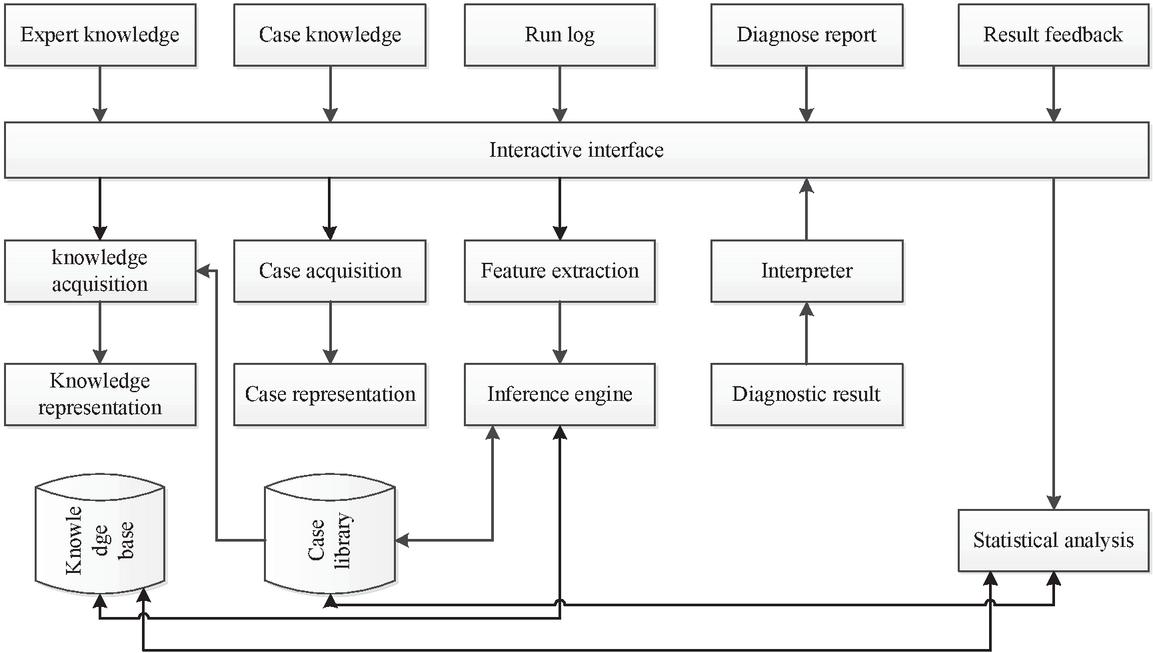
Figure 2 Fault diagnosis system structure.
2.4 Demand Analysis of Intelligent Fault Diagnosis System for Wind Power System
It aims to improve the efficiency and accuracy of fault diagnosis of wind farms by analyzing the current situation of wind farms, focusing on the key functions that the intelligent troubleshooting system should implement. For personnel use, the user group is relatively simple; for users, as shown in Figure 3; business view means that users can view real data, time error information and offline error information, database data, wind farm demonstrations, ranking lists, etc.; business refers to allowing users The function of generating diagnostic reports and troubleshooting; browsing data means that users can retrieve data, logs, various reports, etc.; downloading data means that users can export important basic information, such as reports, logs, databases created by the system, etc. Changing information means that users can edit their personal information and make technical changes to the system. In the wind power system intelligent troubleshooting system, users should be divided into roles, and different roles have different permissions.

Figure 3 User use case diagram.
3 Data Fusion Model
3.1 Problem Description of Wind Turbine Drive System Sensor
The wind turbine drive system consists of a low-speed shaft, a high-speed shaft, a gear box, etc. It is an important device for transmitting the mechanical power to the generator after the rotor of the wind turbine is accelerated by the generator. Create a wind turbine operating system template:
| (1) | |
| (2) | |
| (3) |
x is the system state variable, is the rotor speed monitor 1, is the rotor speed monitor for the generator speed monitor 2, is the generator 1 speed monitor, is the generator 2 speed monitor, is the input state, d stands for unknown input or system failure.
x is the state variable of the system, is the rotor speed observer 1, is the rotor speed observer and generator speed observer 2, is the generator speed observer 1, and is the generator speed observer 2.
Given the presence of sensor failures in Equations (1) and (2), the model can be written as:
| (4) | |
| (5) |
where and are the systematic error signal and the systematic error distribution matrix, respectively.
3.2 Unknown Input Observer Design
In describing the space of a system of objects, external perturbations of the actual situation are replaced by unknown input data. For unknown inputs and actual system outages, the unknown input can be disconnected from the unknown input to eliminate the influence of uncertain external factors on system performance. For unknown input observers, the system uncertainty appears as an additional unknown input. For systems with unknown inputs, an observer with unknown inputs can estimate the state of the system such that the state estimation error vector e(t) always tends to asymptotically zero.
The block diagram of the full sequence unknown input observer, and its state equation can be expressed as:
| (6) | |
| (7) |
where F, T, K, H are matrices that extend the unknown input partition, is the state vector, and is the estimated state vector.
F, T, K, H are the matrices to be designed for the decoupling of the unknown input, is the state vector, is estimated state vector.
An unknown full-order input observer is designed for the system, and its estimated error is as follows:
| (8) | ||
| (9) |
If the following equation is correct:
| (10) | |
| (11) | |
| (12) | |
| (13) |
In this case, the state estimation error can be expressed as:
| (14) |
If the eigenvalues of F are guaranteed to be stable, then gradually approaches zero at point . Therefore, in addition to solving Equations (10) to (13), it is also necessary to ensure the stability of the eigenvalues of F for the matrix F when designing reliable unknown input observations for the system model. Constructing conditions for unknown input observations, two lemmas are introduced here.
The necessary and sufficient conditions for solving Equation (10):
| (15) |
Its specific solution is:
| (16) |
3.3 The Design of the Unknown Input Observer for the Single Sensor Fault of the Transmission System
Assuming that there is a sensor failure in the system, such as the kth sensor failure, the model can be expressed as
| (17) | |
| (18) | |
| (19) |
where is row of matrix C; is obtained by deleting row from matrix C; is the sequence of vector y; is the string obtained by deleting vector y; is the error signal of the kth sensor; . The error signals of the remaining sensors including the kth sensor are the error signals after the kth sensor is removed.
is row of matrix C; is obtained by deleting row from matrix C; is row of vector y; is row obtained by deleting vector y; is the fault signal of the kth sensor; is the fault signals of the remaining sensors of the k sensors, that is, the fault signals after removing the kth sensor.
From Equations (17) to (19), the error of a single sensor with an unknown input signal to the observer can be expressed as:
| (20) | |
| (21) |
The parameters of the above formula must conform to , , , , , , .
The parameters of formulas (17)–(19) satisfy , , , , , , .
4 Intelligent Fault Diagnosis and Analysis of Wind Power Generation System Based on Data Fusion
4.1 The Situation of Wind Power System
Wind power is one of the renewable energy sources with the greatest development potential at present. The grid-connected power continues to grow, and the global wind power is ushering in a period of rapid development and growth, with an average annual growth rate of 20%. Wind farms can be installed in all sparsely populated and windy areas, including seas, plains and mountains. The development and growth of the wind power industry is currently stable, and the development model has changed from scale and growth to focusing on efficiency and quality. As can be seen from Figure 4, the annual newly installed capacity is increasing year by year, so the cumulative installed capacity is also continuing to rise. In 2016, the annual newly installed capacity was 54 GW, and the cumulative installed capacity was 487 GW; in 2017, the annual newly installed capacity was 62 GW, and the cumulative installed capacity was 543 GW; in 2018, the annual newly installed capacity was 65 GW, and the cumulative installed capacity was 596 GW; in 2019. In 2020, the annual newly installed capacity was 74 GW, and the cumulative installed capacity was 658 GW; in 2020, the annual newly installed capacity was 82 GW, and the cumulative installed capacity was 723 GW.
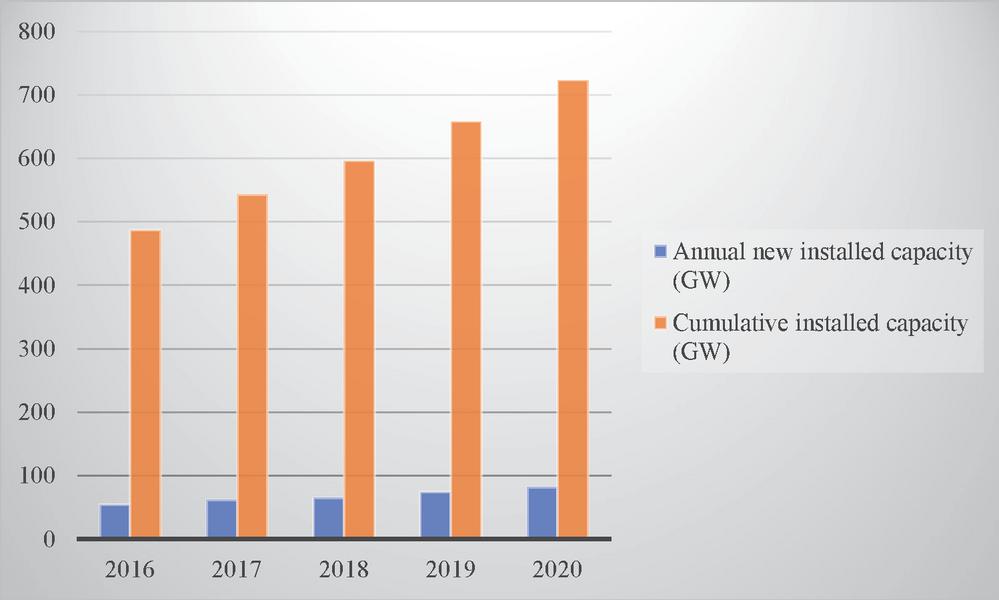
Figure 4 Installed capacity of global wind power market.
The development of power electronic conversion technology provides reliable support for the stable operation of large wind turbines, and is an important tool for new energy grid connection, which can effectively improve reliability and controllability. With the gradual increase of the power of the wind turbine, the topology of the power converter becomes more and more complex, and the fault frequency of the power electronic equipment is higher and higher, thus reducing the life of the wind turbine and the impact on the power. Statistical results show that mechanical components such as rotor blades and electrical systems have the longest downtime, while electrical systems and electronic controls have the longest downtime. The “National Wind Farm Equipment Performance Survey” released by China in 2012 also showed that the failure and failure duration of key components such as converters, rotor blades, and gearboxes were the highest, and the most common driving failure was 0.2 times per generator. The error distribution is basically the same as abroad. The power electronics of modern wind turbine inverters are the most common faulty components and the weakest part of wind turbines. Their existence seriously affects the operation of the converter and even the entire wind turbine, and causes serious damage due to power fluctuations. As shown in Figure 5 below.
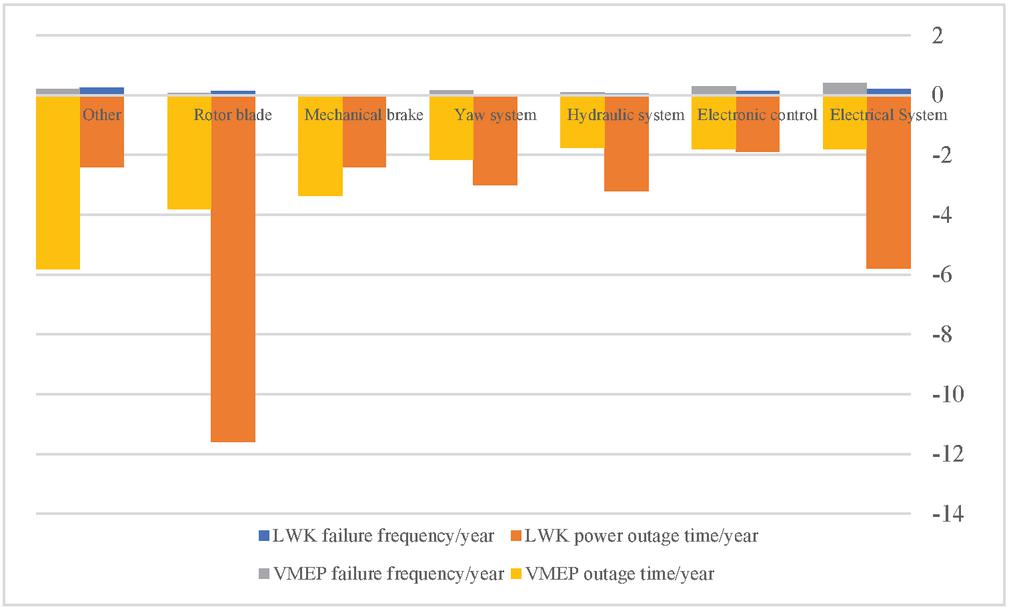
Figure 5 Statistics of wind turbine failure frequency and power outage time in Europe in the past 13 years.
4.2 Intelligent Fault Diagnosis of Wind Power System
First, by denoising, dealing with missing values, and solving the class imbalance problem in the original data, the preprocessed sample data of each wrong type of sample data is averaged, and there is no zero value in the sample; then the data set is divided into Test with a training ratio of 8:2 and use the XGBoost algorithm for 5 cross-validation. The statistical outcomes of the accurateness rate, recovery rate and F1 score of the test validation results are shown in Table 1. Cross-validation shows that the XGBoost arithmetic has high recognition accurateness for sensor bias malfunction, sensor gain fault and sensor constant value fault, P reaches 0.93, R is 0.94 and F1 is 0.93. Simulation outcomes demonstrate the effectiveness of the XGBoost-based diagnostic arithmetic in detecting wind turbine sensor faults.
The cross-validation outcomes show that the XGBoost arithmetic has high recognition accurateness for sensor gain failure, sensor bias failure and sensor constant value failure, the average precision P reaches 0.93, the recall ratio is 0.94, and the F1 index is 0.93. The simulation outcomes demonstrate the efficiency of the XGBoost-based diagnostic algorithm for identifying sensor faults in wind converters.
Table 1 Verification results of XGBoost algorithm for converter current sensor fault
| Fault Type | Fault Number | P | R | F1 |
| Sensor gain failure | 0.92 | 0.92 | 0.92 | |
| 0.91 | 0.92 | 0.91 | ||
| 0.88 | 0.93 | 0.92 | ||
| Sensor Bias Failure | 0.90 | 0.88 | 0.88 | |
| 0.92 | 0.91 | 0.90 | ||
| 0.93 | 0.92 | 0.92 | ||
| Sensor constant value failure | 0.95 | 0.97 | 0.96 | |
| 0.98 | 0.98 | 0.98 | ||
| 0.98 | 1.00 | 0.99 | ||
| Total | 0.93 | 0.94 | 0.93 |
Sensors typically collect noise data during operation. Noise information systems improve performance, reduce stability and introduce safety risks, making wind power systems difficult to operate and maintain. The white Gaussian sound model is an example that best simulates sound stacking. The white Gaussian noise probability distribution is a normal function consisting of a uniform spectral density distribution of first-order momentum independent of second-order distance and signal power best suited for sound simulation. The Gaussian ratio of the white noise to the audio signal is the value of the dotted line to the noise. The lower the ratio of sound, the higher the composite noise. Figure 6 shows the change in accuracy of the LSTM-based error algorithm after adding white Gaussian noise with different noise ratios to the test signal. White Gaussian SNR control circuit is 35–50 dB with a range of 5 dB. Using the Monte Carlo method, 50 test samples were selected for validation evaluation. Since the ratio of Gaussian noise to white noise is 50 dB, the average value of the F1 index of the six faults is greater than 0.8. The value of detector F1 decreases gradually as the signal to noise ratio reduce. When signal to noise ratio drops to 35 dB, the f1 index drops to 0.57, indicating the difficulty of PWM fault diagnosis. Most error types show relatively reliable diagnosis when the white Gaussian signal-to-noise ratio exceeds 45 dB.
When signal to noise ratio of white Gaussian noise is 50 dB, the average value of the F1 index of the six fault types exceeds 0.8, which is similar to the noise-free test results. With the decrease of signal to noise ratio, the value of F1 index gradually decreased. When signal to noise ratio decreased to 35 dB, the F1 index of fault types f1 and f64 dropped to 0.57, which showed the difficulty of open-circuit fault diagnosis of back-to-back PWM converters. When the signal-to-noise ratio of white Gaussian noise exceeds 45 dB, most fault types show relatively reliable diagnostic performance.
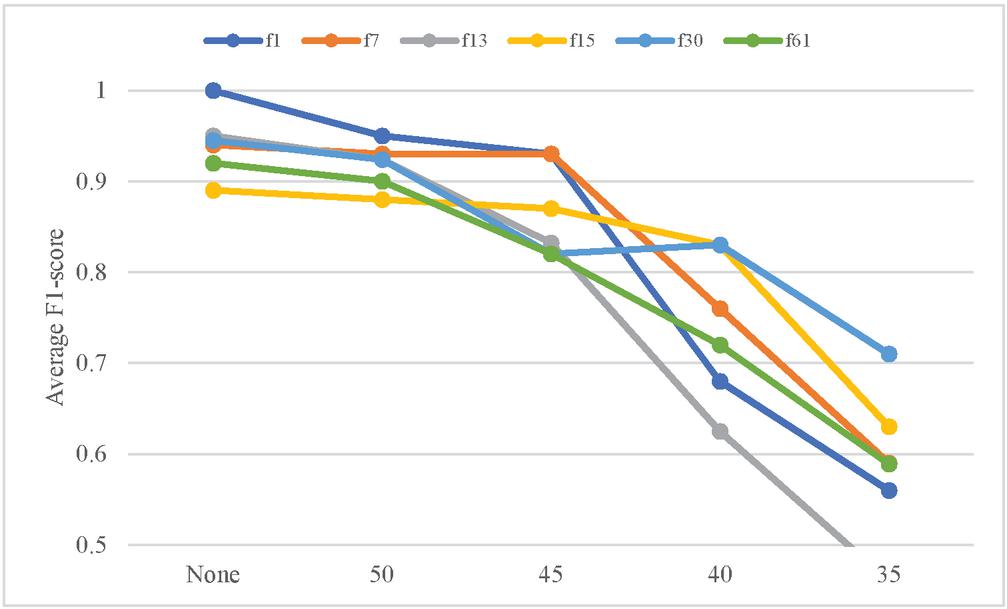
Figure 6 Accuracy analysis of LSTM fault location network under Gaussian white noise interference.
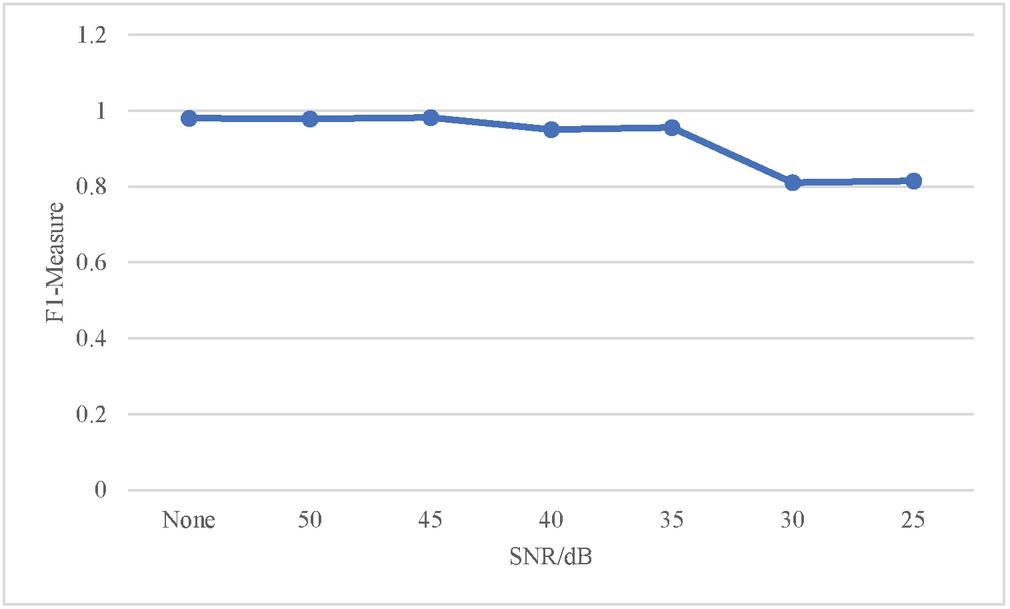
Figure 7 DBN diagnosis effect under different Gaussian noise interference.
As can be found out Figure 7, the average fault diagnostic reading F1 only decreases slightly when the noise SNR does not exceed 45 dB. When the signal to noise rate is below 35 dB, the average value of F1 is slightly below 0.8, but this value is still acceptable in the case of severe interference. In addition, the corresponding F1 F1-Measure values are shown for all sounds at 25 dB, 35 dB and 45 dB Gaussian noise. As can be found out the figure, the show of the FID deteriorates as the noise keeps increasing.
Figure 8 shows that DBN has different diagnostic effects on different faults in different Gaussian noises. At 45 dB and 35 dB, each fault type is only slightly affected, and the fluctuation of the broken line is small; at 25 dB, each fault type fluctuates greatly, indicating that the fault type is more sensitive to 25 dB. Fault 1, fault 3, fault 4 under different Gaussian noise, the value of F1-Measure is relatively unchanged; fault 2, fault 5, fault 6, fault 7, fault 8 under different Gaussian noise, the value of F1-Measure The changes is more pronounced, indicating that actuator failures and system failures are more susceptible to uncertain failures, which is one of the reasons why these failures are difficult to detect accurately.
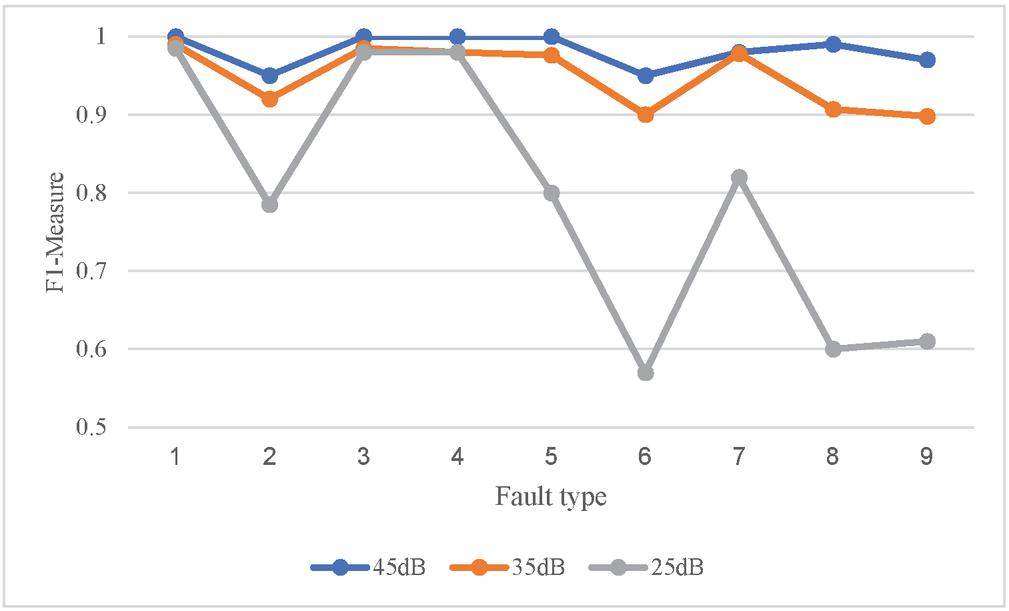
Figure 8 Diagnosis effect of DBN on different faults under different Gaussian noises.
Table 2 Comparison of state estimation effects
| Estimation Method | Fuzzy | ANN | DLSTMRF |
| RMSE | 0.0109 | 0.0123 | 0.0078 |
It is hard to see from the results in Table 2 that the average RMSE estimated by DLSTMRF for each wind farm variable is only 0.0078, which is much lower than other commonly used methods. The DLSTM represents a good fit to the time series and also shows that the estimates made by the DLSTM system are considered sufficiently credible.
The ANN fault diagnosis has a significantly better impact on the fan. It can be seen from Table 3 that the INS quickly and accurately detects fault 1, with a Prec of 99%, a missed alarm rate of only 0.1%, and an average delay of fault diagnosis time of only 0.01 s; but for fault 2, the Prec is only 77.2%, which is significantly lower in other methods. As a data-based FDI method, fuzzy error diagnosis outperforms artificial neural networks. Fuzzy diagnoses these two faults very quickly, with an average Prec of 97.5%, an average F1 of 99.15%, an average fuzzy MDR (0.2%) and an average diagnosis time (0.05 s), which is higher than that of ANN (0.1%, 0.405 s). For the internal fuzzy comparison, the fuzzy diagnostic performance of Prec (96%) for fault 2 is poor, while the MDR for fault diagnosis is 0.3%. Combining the above two methods, the diagnostic performance of ANN and Fuzzy for fault 2 is below average. The ANN and Fuzzy methods have poor diagnostic effect on fault 2, but the DLSTMRF accuracy rate reaches 100%, and the MDR is 0%. In addition, in terms of performance mean, DLSTMRF has higher accuracy (mean: 100%), lower MDR value (mean: 0%), and lower diagnosis time (0.002 s) than other methods.
Table 3 Comparison results between DLSTMRF and model-based methods
| Fault | Index | Fuzzy | ANN | DLSTMRF |
| 1 | Prec | 0.99 | 0.99 | 1 |
| MDR | 0.001 | 0.001 | 0 | |
| F1 | 0.99 | 0.994 | 1 | |
| Td | 0.02 | 0.01 | 0.002 | |
| 2 | Prec | 0.96 | 0.772 | 1 |
| MDR | 0.003 | 0.001 | 0 | |
| F1 | 0.993 | 0.871 | 1 | |
| Td | 0.08 | 0.8 | 0.002 | |
| Avg | Prec | 0.975 | 0.881 | 1 |
| MDR | 0.002 | 0.001 | 0 | |
| F1 | 0.9915 | 0.9325 | 1 | |
| Td | 0.05 | 0.405 | 0.002 |
The Euclidean distance between the sensor output under the corresponding fault condition and the sensor output during normal operation is displayed in Table 4. It can be found out the table that the Euclidean distance between the wind farm sensor output and the sensor output is only 2813.1. When fault 2 occurs, the Euclidean distance is only 2813.1. Close to the Euclidean distance (2808.4) from the normal output. In the data-driven approach, the output of the sensor for fault 2 is indistinguishable from that of a normally working sensor, which makes it difficult to identify fault 2 in the traditional data-driven approach.
Table 4 Euclidean distance between fault output and normal output
| Fault | Normal Operation | Fault 1 | Fault 2 | Fault 3 |
| Euclidean distance | 2808.4 | 118489.9 | 2813.1 | 10155.9 |
The rated value of the inlet pressure of the inverter is 0.5, the allowable range is below 55, the weight is 0.3, and the measured value is 0.9; the rated value of the inverter INU temperature is 2.5, the allowable range is below 1.1, the weight is 0.3, and the measured value is 55; the inverter coolant The required rated value of the liquid level is 0.5, the allowable range is below , the weight is 0.15, and the measured value is 0; the rated value of the ambient temperature of the wind tower is 22, the allowable range is below 35, the weight is 0.25, and the measured value is 23.6. As shown in Table 5 below.
Table 5 State characteristic parameters of cooling pump
| Rated | Allowable | Measured | ||
| State Feature Parameter Name | Value | Range | Weights | Value |
| Inverter inlet pressure | 0.5 | 1.1 | 0.3 | 0.9 |
| Inverter INU temperature | 2.5 | 55 | 0.3 | 35 |
| Inverter Coolant Level Requirements | 0.5 | 0.15 | 0 | |
| Wind tower ambient temperature | 22 | 35 | 0.25 | 23.6 |
The temperature rating of the pitch motor of blade 1 is 55, the allowable range is below 100, the weight is 0.12, and the measured value is 68; the temperature rating of the pitch motor of blade 2 is 55, the allowable range is below 100, the weight is 0.12, and the measured value is 87; The temperature rating of the pitch motor of blade 3 is 55, the allowable range is below 100, the weight is 0.12, and the measured value is 100; the temperature rating of the inverter box of blade 1 is 25, the allowable range is below 45, the weight is 0.2, and the measured value is 31; The temperature rating of the frequency converter box of blade 2 is 25, the allowable range is below 45, the weight is 0.2, and the measured value is 31; the temperature rating of the frequency converter box of blade 3 is 250, the allowable range is below 430, the weight is 0.2, and the measured value is 300. As shown in Table 6 below.
Table 6 Blade state characteristic parameters
| Rated | Allowable | Measured | ||
| State Feature Parameter Name | Value | Range | Weights | Value |
| Blade 1 pitch motor temperature | 55 | 100 | 0.12 | 68 |
| Blade 2 pitch motor temperature | 55 | 100 | 0.12 | 87 |
| Blade 3 pitch motor temperature | 55 | 100 | 0.12 | 100 |
| Blade 1 Inverter Box Temperature | 25 | 45 | 0.2 | 31 |
| Blade 2 Inverter Box Temperature | 25 | 45 | 0.2 | 31 |
| Blade 3 Inverter Box Temperature | 250 | 430 | 0.2 | 300 |
The main bearing temperature rating is 30, the allowable range is below 80, the weight is 0.35, and the measured value is 36.2; the allowable range of the main bearing grease pump startup time interval is below 500, the weight is 0.15, and the measured value is 394; the operating cycle of the main bearing grease pump is allowed the range is below 14, the weight is 0.15, and the measured value is 6. As shown in Table 7 below.
Table 7 State characteristic parameters of spindle system
| Rated | Allowable | Measured | ||
| State Feature Parameter Name | Value | Range | Weights | Value |
| Main bearing temperature | 30 | 80 | 0.35 | 36.2 |
| Main bearing grease pump start interval | 500 | 0.15 | 394 | |
| Main bearing grease pump operating cycle | 14 | 0.15 | 6 |
It can be seen from Table 8 that the cooling pump system is in an abnormal state, the equipment is in the fault range and the development is unfavorable, and the fault should be found in time; it can continue to run, but the control system must be adjusted to improve the detection ability and avoid sudden failures. If the blade system is near failure and operating parameters are out of range, troubleshooting should be done to identify any equipment or components that may be causing the failure; if not detected and repaired in time, a shutdown must be prepared. The spindle system is in good condition and can continue to be used.
Table 8 Data fusion evaluation results
| Subsystem | Status | Semantic Description of |
| Name | Evaluation Results | Status Evaluation Results |
| Cooling pump | (0.13,0.77,0.46) | Abnormal state, the fault should be found in time |
| Blade | (0.24,0.59,0.90) | If it is in a state of failure, it should be checked and repaired |
| Spindle system | (0.79,0.03,0) | In good condition, can continue to operate |
5 Conclusion
The integration of large-scale wind power into the grid has effectively alleviated the shortage of traditional fossil energy and reduced the impact of power generation on the environment, and has become one of the key development areas. There are various faults in the large wind power system operating in this area, which increases the operation and maintenance of wind farms, and also brings security risks to the traditional power system. Aiming at the problems of the existing model-based wind farm fault diagnosis algorithm, slow automation and slow data fusion algorithm, a wind farm fault diagnosis method based on online adaptive DLSTMRF is proposed. The approach is based on monitoring the condition of wind farms using DLSTM and combines the benefits of remaining traditional analytical methods with a new substructure that enables automatic diagnosis and reporting of various faults in wind farms. The simulation test results show that the wind farm fault diagnosis performance of this method is better than the existing diagnosis methods, which provides a new possibility for wind farm network-level adaptive fault diagnosis.
References
[1] Peng H D, Chen X Q, Ren M. Intelligent Fault Diagnosis Technology and System for Wind Turbines[J]. Power System and Clean Energy, 2011, 23(2):66–69.
[2] Shan H E, Wang W Q, Zhang X Y. Short Circuit Fault Intelligent Diagnosis of MW Permanent Magnet Wind Power Generator Based on Artificial Neural Network[J]. Electric Machines & Control Application, 2011, 66(12):88–91.
[3] Wang X. Fault Diagnosis Approach of Main Drive Chain in Wind Turbine Based on Data Fusion[J]. Applied Sciences, 2021, 11(23):7–9.
[4] Jiang G, Zhao J, Jia C. Intelligent Fault Diagnosis of Gearbox Based on Vibration and Current Signals: A Multimodal Deep Learning Approach[C]// 2019 Prognostics and System Health Management Conference (PHM-Qingdao). Wuhan, China, 2019.
[5] Ruifei, Bai, Wei, et al. Fault Diagnosis algorithm of Wind Power Gearbox Based on Fuzzy Neural Network[C]// The 31st China Conference on Control and Decision Making.Jiangxi, China, 2019.
[6] Junnian W, Yao D, Zhenheng W. Multi-fault diagnosis method for wind power generation system based on recurrent neural network[J]. Proceedings of the Institution of Mechanical Engineers Part A Journal of Power and Energy, 2019, 4(22): 3775–3782.
[7] Chen Fei, Yang Zhiling, Fu Zhongguang. An intelligent diagnostic method for the wind turbine knowledge-based Malfunction, 2017, 34(12):165–169.
[8] Dai S, Wang D, Li W. Fault Diagnosis of Data-Driven Photovoltaic Power Generation System Based on Deep Reinforcement Learning[J]. Mathematical Problems in Engineering, 2021, 57(2):1021–1023.
[9] Zhu Y L, Jin-Ling L U, Min L U. Multi-agent based real-time intelligent system for power systems fault diagnosis[J]. Relay, 2006, 80(30):603–606.
[10] Liang-Yu M A, Gao J Q, Zhao W S. Modularized Intelligent Fault Diagnosis System for Thermal Systems in Power Stations[J]. Journal of North China Electric Power University, 2001, 3(4):154–158.
[11] Cai M, Zhang D F, Zhang Y S. Study on intelligent fault diagnosis system based on compositive information fusion[J]. Computer Engineering and Design, 2010, 11(20):432–435.
[12] Shi Y, Liu Y, Gao X. Study of wind turbine fault diagnosis and early warning based on SCADA data[J]. IEEE Access, 2021, PP (99):1–1.
[13] Cheng X, Ping L I, Sun L S. Research on the Deviation Analysis of Utilization Hours in Wind Power Plants Based on Regulatory Data Fusion and Feature Extraction & Processing Technologies[J]. Journal of Physics: Conference Series, 2021, 1754(1):012197 (9pp).
[14] Minghui Yan, Zhen Yuan, Haifeng Zhou, et al. An Online Equivalent Method of Large-Scale Wind Power Based on Multi-source Data Fusion[J]. 2020, 17(13): 978–981.
[15] Yuan Q, Sun D, Zhu X. The Fault Diagnosis Method of Data fusion for the Multi-Source Vibration Signal of Wind Power Bearing[J]. Chinese Journal of Electron Devices, 2017, 18(3):659–662.
[16] Nedaei M, Ataei A, Yoo C. The Potential of Wind for Energy Production and Water Pumping in Iran, Saravan County[J]. Cogeneration & Distributed Generation Journal, Vol. 31, no. 1, 2016.
[17] Madavar M D, Nezhad M H G, Aslani A R. Analysis of Generations of Wind Power Technologies Based on Technology Life Cycle Approach[J]. Distributed Generation and Alternative Energy Journal, 2017, 32(3):52–79.
[18] Cao Y, Li J, Wu G. Parametric Performance Analysis of a Vertical Axis Wind Turbine[J]. Cogeneration & Distributed Generation Journal, 2018, 33(1):49–66, 69–73.
Biographies

YuHang Tan received his B.E. and M.E. degrees in Electrical Engineering from Chongqing University of Technology, China; At present, Y.H. Tan is mainly engaged in teaching and scientific research in the field of new energy power generation system, and has published 5 relevant papers from 2015 to 2022.

KangYou Liang received his B.E. and M.E. degrees in Electrical Engineering from Chongqing University, China; At present, At present, K.Y. Liang is mainly engaged in teaching and scientific research in the field of basic circuit theory, and recently published 2 relevant papers.

ZhenTao Zhang received his B.E. and M.E. degrees in Electrical Engineering from Chongqing University of Technology, China; At present, Z.T. Zhang is mainly engaged in testing in the field of electrical equipment, and recently published 1 relevant paper.
Distributed Generation & Alternative Energy Journal, Vol. 37_6, 1847–1872.
doi: 10.13052/dgaej2156-3306.3766
© 2022 River Publishers