Performance Analysis and Energy Conservation of PV Based Hybrid Power System
Saurabh Kumar Rajput and Dharmendra Kumar Dheer*
Electrical Engineering Department, National Institute of Technology Patna, India
E-mail: dkdheer@nitp.ac.in
*Corresponding Author
Received 21 November 2021; Accepted 27 December 2021; Publication 09 December 2022
Abstract
The increase in energy consumption due to population expansion and scarcity of fossil fuels is happening simultaneously in developing countries like India. In this regard, commercial buildings are increasingly required to employ renewable energy sources (like PV) and conserve the energy for improving energy efficiency. This research article examines the performance of such PV-based hybrid power system, consists of 11 kV grid supply, 100 kWp PV plant & 200 kVA diesel generator. The results indicate that the addition of 68.34 kVAr shunt capacitor bank to Automatic Power Factor Compensation (APFC) panel, keeps the Power Factor (PF) unity and also eliminates the PF penalties in electricity bills. The maximum demand (MD) saving Rs 54528.00 (INR) on annual basis is achieved after the integration of PV with low voltage (433 V) distribution system and grid supply (11 kV). This integration has also reduced the average transformer loading to 64.73% and improved the transformer life. However the development of high current harmonics (average value 47.10%) must be reduced to ensure the life of the electrical load.
Keywords: PV-based hybrid power system, power factor, maximum demand, transformer loading and life, current harmonics.
1 Introduction
Increased energy demand owing to population growth and fossil resource shortages are occurring simultaneously in developing countries such as India. Energy conservation is one of the finest viable methods for meeting this rising energy demand that refers to providing long-term, cost-effective solutions with decrease in energy waste to a minimum level [1].
Energy conservation aids in the selection of efficient energy sources as well as the planning of energy efficiency initiatives. For low voltage (433 V) industrial power network and operations, many energy audits and management studies have conducted. These research studies are covered in [2–10]. According to a study, electricity accounts for 65% of the system’s overall energy cost, which can be lowered by 18% by making optimal use of transformers, cables, motor connections, power factor, peak savings, and lights [2]. Building insulation, laptops/computers, day illumination, use of steam instead of electrical energy, spindle change, and use of solar system instead of conventional supply were found to enhance total savings to 142.43 MWh/year [3]. Electricity saving of 312 MWh/ year and total reduction of 474.15 ton is found; if air conditioner, process control, compressor and boiler are also considered along with the conventional electrical systems for energy savings [4]. The illumination, electricity load, and harmonic analysis are the main emphasis of the audit. Adding reflectors to the ring frame area, double doors, and a ceiling in AC rooms conserve the energy [5]. Elizabeth Hewitt et.al. conducted research using a binary logic regression on a database of Residential Energy Consumption Survey (RECS) data to determine the socioeconomic and demographic aspects that influence the decision to conduct an audit. The goal is to investigate the decision to conduct an audit at home in order to identify areas of inefficiency and opportunities for energy savings [6]. Awinash Kumar et al. conducted an ETAP based intelligent energy audit in a 2BHK residential house, recommending unplugging and switching off appliances to reduce no-load losses, replacing high-power-consuming equipment with energy-efficient equipment, and employing distributed generation, which will reduce power consumption (utility) by 25% and have a payback period of 5 years. For a clean and green environment, it was also suggested that trees be planted around the structure [7]. In an industry (located at Sweden), energy savings of 23% in the ventilation process and 22% in the production process were achieved [8]. The use of modern power electronics-based techniques in conjunction with conventional electrical appliances minimises the amount of energy required to operate them. The use of a variable speed drive (VSD) with variable load motors can cut energy usage by up to 30%. The optimization of complex pumps saves energy consumption by up to 10%. Furthermore, water conservation methods have become an important aspect of energy conservation [9, 10].
For energy conservation and pollution-free energy production, the installation of PV on the rooftop of commercial buildings have become popular in recent decades. The impact of PV on electrical systems are also covered in research studies [11–18]. In grid-tied system, the distribution transformer (DT) is used to link the PV to the grid supply. During overload conditions, the DT has a severe loss of its life, which can occur even if the overload is just for a short time. The PV based distributed generation reduces over-load from DT but in peak summer season, the high solar module temperature increases the loading on transformer and hence reduces its life [11, 12, 13]. When used for renewable energy based hybrid energy generation, the DT performance is within the required limit. The size and life of the transformers have all improved, but harmonics and OLTC operation have increased [14]. Harmonics are always connected with distributed generation based on non-conventional energy supplies. A method for a three-phase grid-connected SRTPV system with improved power quality, maximum power generation, and the ability to feed excess solar power to the grid has been proposed by [15]. In order to describe PV produced current harmonics and power factor in various operating modes, a mathematical model is built. At Egypt’s electronics research institute, measurements and results verification are carried out on an 8 kWp PV system [16]. Current Harmonics, loading factor, and ambient temperature all influence the life of transformer. The ‘K factor’ approach is used to calculate the effect of harmonics on transformer performance [17, 18]. Because the voltage harmonics are discovered to be higher than the allowable limit, harmonic filters need to be installed for improving the quality of the power supply [5].
To determine the scope of energy conservation in hybrid power systems, as well as the influence of integrating renewable energy sources on electrical systems, is the need of the day. The current research focuses on real-time data monitoring, analysis, and identification of energy conservation options in a PV-based hybrid power system. The following are the study’s main areas of interest:
1. Measurement and analysis of load profile in composite climate.
2. Analysis of supply mains parameters like voltage profile, Maximum demand (MD), Power Factor (PF) and Total harmonics distortion (THD).
3. Impact of PV on DT loading, life and sizing.
4. Diesel generator (DG) set testing.
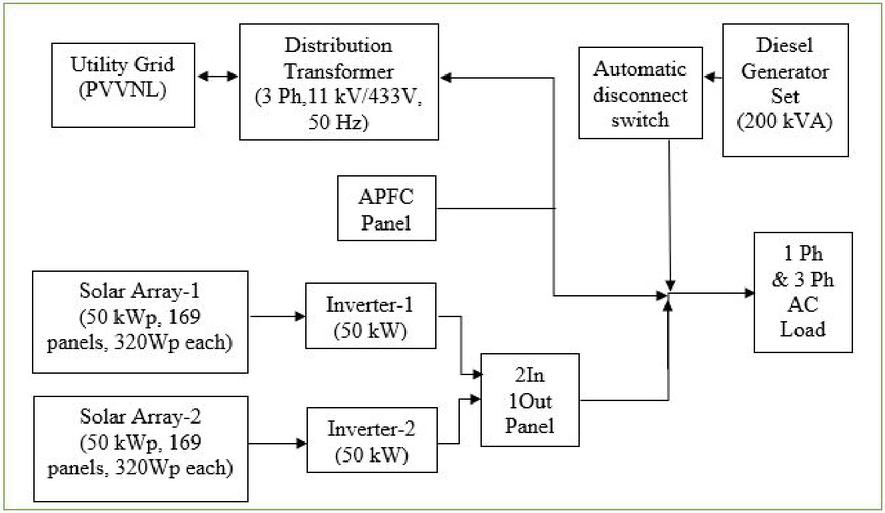
Figure 1 Power flow of study system.
2 Study System
Figure 1 depicts the power flow of study system. The system consist of 11 kV grid supply, 100 kWp rooftop PV, and a 200 kVA DG set. The unit has 150 kW contracted demand. A three phase 50 Hz 11kV/433 V DT is used to convert the high voltage (11 kV) into low voltage (415 V). The system includes an APFC device for improving grid supply PF. Three phase capacitor banks are connected in parallel with the supply system in this device.
A PV plant is erected on the roof of the building to meet the increasing energy demand of the load. This plant has a total rated capacity of 100 kWp and is built in two strings. The PV plant has 338 PV modules, each with a 320 Wp power rating. Net metering connects the PV facility to the low-voltage distribution network.
The DG set (200 kVA) serves as a backup to the two energy sources indicated above. When grid power is unavailable and PV generation is insufficient to meet the demands of linked loads, DG sets are employed to provide electricity. The real time data collection from study system is shown in Figure 2.
Three Phase Power Analyzer (TPPA) is used for real-time metering and data collection of PV generated power and its quality factors. As shown in Figure 2(c), the TPPA is connected to the output terminals of the PV inverter. This instrument is capable of monitoring the data for minimum interval of 30 second and has storage capacity for 48 hours.
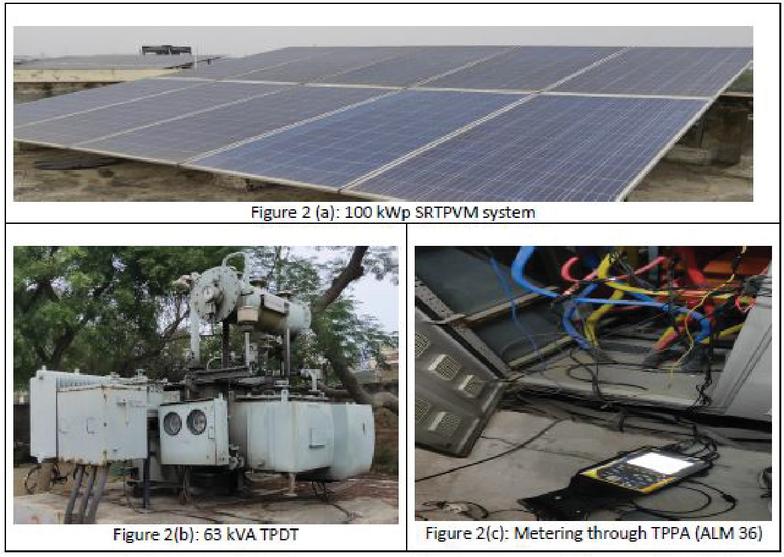
Figure 2 Real time data collection from study system.
3 Real Time Data Monitoring and Performance Analysis
Since April 2019 to March 2020, the data has been collected and monitored. Data is collected from previous electricity bills, and monitoring is carried out by connecting a power analyzer to the supply mains (as shown in Figure 2).
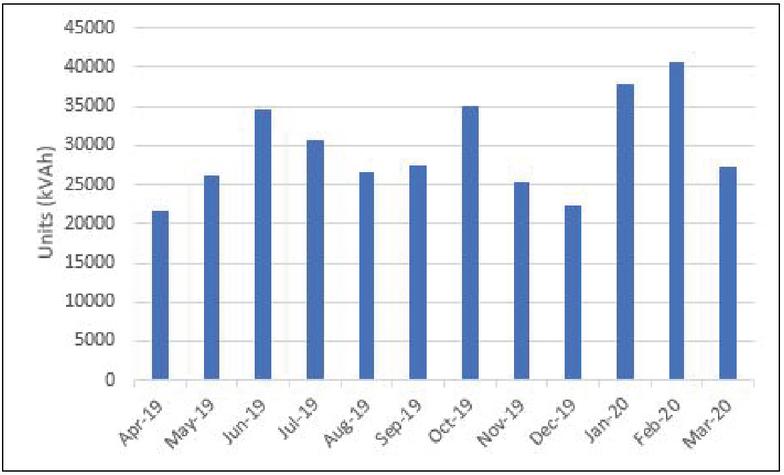
Figure 3 Monthly variation of unit consumed (kVAh).
3.1 Measurement and Analysis of Load Profile
To create energy efficient systems, it is required to understand energy requirement of connected load. The study of monthly electricity bills provides a thorough understanding of our electricity usage trends. An examination of various electricity bills can aid in the development of a monitory and energy-saving strategy. High tension (HT) supply billing is broken into two parts: demand charges and energy charges. For HT customers, demand is measured in kVA, and the fixed and variable energy rates are listed in the monthly billing. The monthly variation of unit consumption (kVAh) is shown in Figure 3. The minimum electrical energy (22428 kVAh) is required in the month of December’2019. The average electrical unit (kVAh) value is high in the months of summer & rainy season (from April to September) in comparison to its average value in winter season (from November to March). The collected data demonstrate that the demand for electrical energy is higher in the summer months than in the winter months. This is due to fact- under the north Indian composite climate, the cooling load (such as air conditioners in summers) is greater than the heating load (room heaters in the winter). During the months of January & February, the values of electrical units do not follow the expected pattern and these values are extremely high. Following conversations with the plant engineer, it was determined that the increase in these values was not attributable to regular connected load, but rather to construction work that took place in the building for two months (January and February) during the study period.
The monthly variation of MD (kVA) is shown in Figure 4. The minimum value of MD is 31.67 kVA (Nov’2019) and the maximum MD is 137.50 kVA (May’2019). The average MD value is high in the months of summer & rainy season (from April to September) in comparison to its average value in winter season (from November to March). For economic analysis, a comparison of MD values measured before and after the installation of a PV plant is made. Figure 4 shows that – without PV plant, the MD is over and above the sanctioned load in the months of May, June and July. Whereas after integration of PV with grid supply, the MD is always below the sanctioned load (175.50 kVA). As a result, the MD panalty saving Rs 54528.00 (INR) on annual basis is achieved after the integration of PV with low voltage (433 V) distribution system and grid supply (11 kV).

Figure 4 Monthly variation of MD (kVA).
3.2 Measurement and Analysis of Grid Supply Parameters
As shown in Figure 3, the annual average MD value is 114.81 kVA. This value (114.81 kVA) is less than the minimum billable demand (131.60 kVA) of the sanctioned load (175.50 kVA). Additionally, the maximum MD value is always less than the sanctioned load. In this case, the plant is required to pay additional charges of Rs 64505.00 (INR) for electricity that was not consumed. This is because rooftop PV is integrated with grid power and load is shared. As a result, the sanctioned load must be reduced to 150 kVA in order to save on energy and its bills.
The PV has a greater or lesser influence on the building power factor depending on the load profile and the degree of PV production. This is because, the PV operates at PF 1 and supplies the majority of active power required by the building, thereby reducing the demand for active power from the electric grid while maintaining the same level of reactive power. The building’s power factor, as measured by the electric grid, is reduced in this circumstance [19]. The variation of monthly average PF is shown in Figure 5. The minimum value of PF (0.85 lagging) is measured in May’19, whereas it is maximum (0.95 lagging) in Jan’20. The annual average PF is 0.91 lagging. To increase the PF from its average value (0.91 lagging) to unity, an additional leading reactive power of 68.34 kVAr is required. As a result, shunt capacitor banks (rated at 68.34 kVAr) must be connected to the APFC panel. This calculation of capacitor rating is done by considering the sanctioned load of 150 kW.
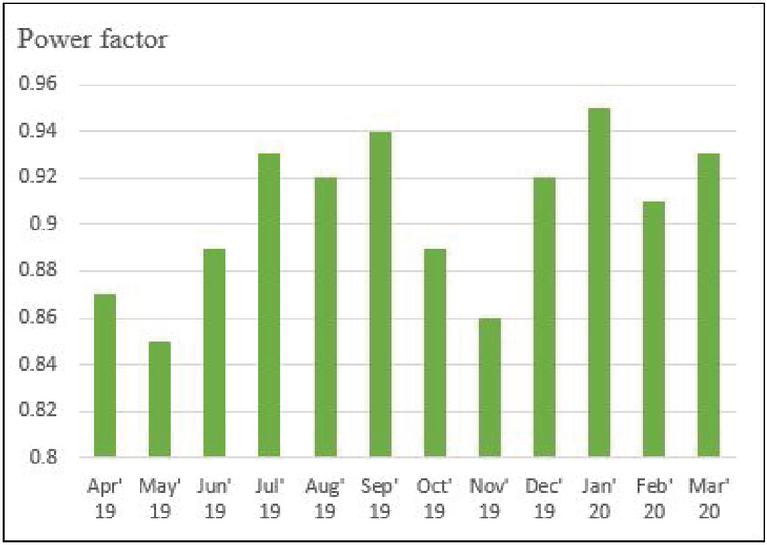
Figure 5 Monthly average PF.
Any electrical machine requires the constant rated rms. voltage (230 V) and ideally zero THD of voltage & current. We took it into consideration and examined phase 1, 2, 3 voltages at the distribution transformer LT panel. The variation of phase voltage and THD are shown in Figures 6 and 7. Because the line voltage is rated at 440 V. As a result, the rated phase voltage is 254.034 V (for a three-phase star connection). The peak voltage is 258.10 V is measured by power analyzer, as illustrated in Figure 6. It is necessary to utilise a three-phase voltage stabiliser for lighting load to keep this high voltage (258.10 V) at 230 V.
When a signal passes through non-ideal, non-linear devices, harmonics of the original frequencies are added to the signal. THD is a measurement of distortion in current and voltage. Harmonics cause overheating of electrical equipment, such as transformers, motors, drives, and power lines. This results in the thermal tripping of circuit breakers, relays, and other protective devices in an unnatural manner. One significant downside of harmonics is that they can create logical mistakes in digital devices and inaccuracies in voltage and current metering. As illustrated in Figure 7, voltage (both line and phase) shows a very low level of distortion (Max 2.10%) and current contains a greater degree of distortion (47.11%). As a result, no reduction of voltage harmonics is necessary but harmonics in the current must be reduced.
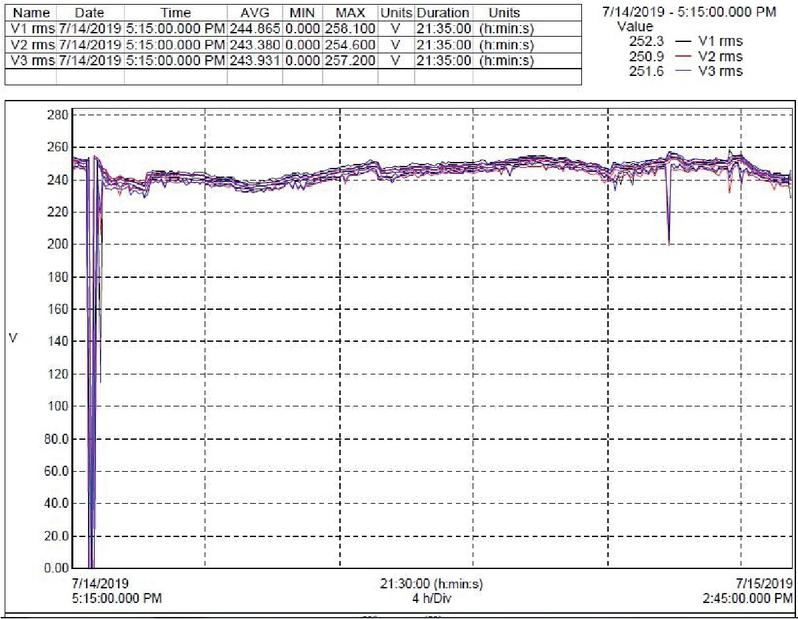
Figure 6 Phase voltage profile.
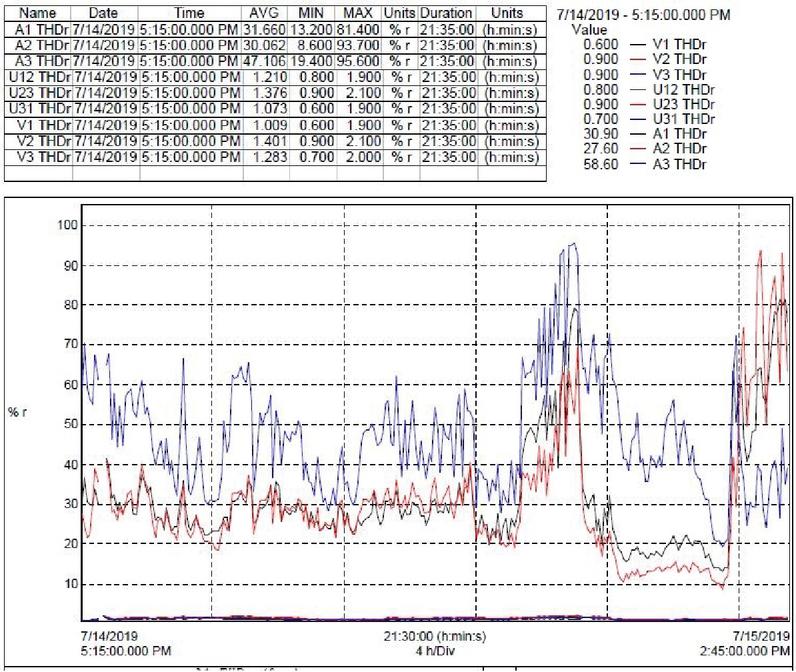
Figure 7 THDv and THDi profile.
3.3 Impact of PV on Transformer Operation
The DT is an electrical device that connects a photovoltaic plant rated at 433 V, 50 Hz to a grid supply of 11 kV, 50 Hz. It can operate in either forward or reverse mode, depending on the amount of solar energy generated and the power requirements of the associated load.
Forward operation: When the power need of load exceeds the PV generated power, the DT receives HV (11 kV) power from the grid and supply to load connected at LV (433 V).
Reverse operation: When the load power requirement is lower than the PV generation, DT supplies the PV generated LV (433 V) power to grid HV (11 kV) and behave as step-up transformer.
During the office working duration from 10.00 AM to 05.00 PM (Monday – Friday), the load power requirement is high and DT work in forward mode. Other than this duration, the PV generated power is supplied to grid. In this way, the loading on transformer is reduced. The monthly variation of DT average loading is shown in Figure 8. The minimum value of percentage loading (47.83%) is obtained in the month of December and April, whare as maximum value of 96.12% is achieved in February. On annual basis, the DT loading is reduced to 64.73%. One of the most critical factors that determines the efficiency of DT is the percentage loading. Depending upon the transformer losses, the efficiency versus % loading curve is plotted for the connected 3 phase DT and shown in Figure 9. The efficiency of transformer is poor, when the transformer is lightly loaded (below 30%) and over loaded (above 100%). After the integration of PV with grid supply, the average loading of DT has shifted in the region of best efficiency ie. in the range from 45% to 75% (as shown in Figures 8 and 9).

Figure 8 Monthly average percentage loading of transformer.
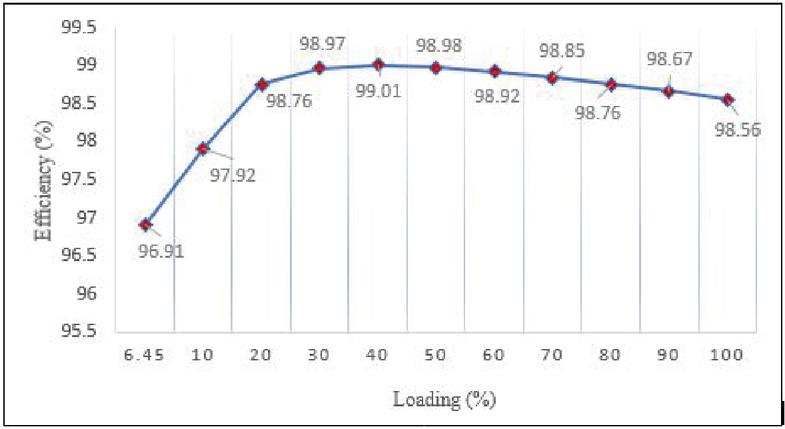
Figure 9 Variation of transformer efficiency with %load.
The transformer’s load also has a role in deciding its life. The lifespan of DT is mostly determined by the temperature of the hot spot (HST). Overloading a transformer increases the HST value and shortens its life (as per the IEEE standard: IEEE C57.110). After connectivity with PV, the reduced loading on DT aids in improving its lifespan.
The Impact of PV on transformer performance is summarised as follows-
1. Transformer efficiency has improved.
2. Reduction in % loading of DT has reduced the HST value and hence the life of DT is improved.
3. Less load on DT necessitates its compact size and thus a more cost-effective system.
The operation of On Load Tap Changer (OLTC) also depend on PV operation. The major objective of the OLTC is to keep the downstream voltage within a certain range under fluctuating loads. However, with the presence of PV, the taps of the OLTC must vary more often, resulting in OLTC failure. The line voltage changes as a result of the current injection through the PV in the system, resulting in frequent upward and downward motion of the OLTC taps. The transformer is in severe danger if the OLTC fails. Because solar energy is intermittent and dependent on sun irradiation, the OLTC operation fluctuates with the seasons. During certain poor weather circumstances, the tap of OLTC must change at twice the typical rate [20]. OLTC operation for the study system is shown in Figure 10. The operation of OLTC is higher in cloudy (August–September) and fog weather (December–January) condition.
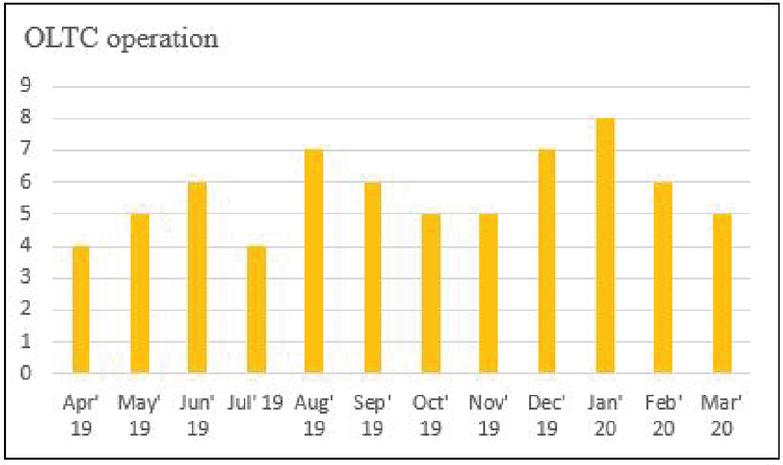
Figure 10 Monthly variation of OLTC operation.
3.4 Reduction in ‘Carbon di oxide’ Emission Due to PV Production
Although solar PV-based energy generation is considered pollution-free, but the ‘Carbon di oxide’ emissions occur during the manufacturing of PV plant components. This is because the PV plant components are built using electricity taken from a thermal power plant. For PV modules, the ‘Carbon di oxide’ emissions over their lifetime are calculated at 0.053 kg per unit (kWh) of electrical energy [21]. In India, thermal power plants generate the majority of electrical energy; ‘Carbon di oxide’ emissions are calculated at 0.98 kg per unit (kWh) of electricity produced at power plant output. Taking into account the 60% t&d losses, the ‘Carbon di oxide’ equivalent for producing 1 unit (kWh) of energy becomes 1.58 kg at the consumer’s end [22]. When the annual energy production of the PV system (under consideration) is taken into account, the net quantity of ‘Carbon di oxide’ mitigation is found 4,108.64 tonnes.
3.5 DG Testing for Specific Fuel Consumption (SFC) and Unit Price Calculation
A diesel generator is a heavy-duty machine that comprises of a mechanical engine and an alternator. It convert mechanical energy to electrical energy. When the grid is unable to provide continuous electricity, DG sets are frequently employed as a backup power source. The study system has a single DG with a capacity of 200 kVA (Kirloskar make).
According to BEE recommendations, energy efficiency evaluations of DG sets can be conducted by completing a one- or two-hour trial on a DG operating at steady load. During the test, following parameters are determined on a regular (15-minute) interval basis [23].
1. Measure the total fuel used by DG during the trial using a dip level or a flow metre.
2. Measurement of electrical units (kWh) generation using power analyzer.
In our study, the test was conducted for 1.5 hours duration (from 01:10 PM to 02:40 PM). The average load on DG was 50.23 kVA and the maximum load was 64.48 kVA. The test findings indicate that at a 25% average load, the diesel consumption of the DG was 25 litres and the unit generation was 81.29 kWh, implying that at a 3.25 kWh/Litre SFC, the unit cost is Rs 21.52. (INR). The high unit cost of DG can be decreased significantly by –
1. The load on DG should be constant.
2. By using the air washer, dust-free air should be provided to DG.
3. To improve the performance of oil, use additives.
4. Continuously adjust fuel injection pumps and conduct regular trials to calculate the real performance of the DG set in accordance with requirements.
4 Conclusion
According to a one-year extensive investigation of a PV-based hybrid power system, it is found that the integration of PV with grid not only produce the pollution-free energy, but it also improves the operation of linked electrical equipment (like transformer). In such systems, careful operation and energy management can provide possibilities for greater energy conservation. The key conclusion of study are as follows.
1. The scope for improvement in PF and current THD varies depending on the extent of PV penetration. In our study, the average PF is decreased to 0.91 lagging. It need the use of a 68.34 kVAr rated shunt capacitor to raise the PF to unity. The average current THD has risen to 47.10%, necessitating the use of a harmonic suppressor.
2. After the installation of PV, the MD and voltage THD have decreased and are now within the allowable range. The penalties are likewise reduced as the MD is reduced.
3. The study categorises the impact of PV on transformer performance by the impact of PV on transformer loading, efficiency, HST, and OLTC operation. Depending on the extent of PV penetration, there is scope for improvement in transformer efficiency and lifetime. Because of solar integration, the load on the transformer has been lowered to 64.73%. It has been discovered that the use of PV reduces the HST of transformers to significant levels.
4. To some extent, PV integration has a positive impact on operation. However, the harmonics effects created by PV have a negative impact on electrical system performance. One of the negative consequences of PV penetration is power reversal. Furthermore, due to PV integration, the frequency of OLTC operation increased, thereby increasing the danger of transformer failure.
Overall, if we can limit the negative consequences of PV integration, the reliability of the power system will improve.
Further, the impact of solar intensity and high solar cell temperature (above ambient temperature) on the power quality parameters of PV generation, along with electrical equipment such as distribution transformers may be determined.
References
[1] A.P. Singh, A. Singhal, A. Athaya, S.K. Rajput, L. Srivastava, and V. Sharma. Energy Audit of Hybrid (Grid, Solar Rooftop Photovoltaic System and Diesel Generator) Electric Power Supply System: A Case Study of Commercial Building. In: Gupta O.H. and Sood V.K. (eds), Recent Advances in Power Systems. Lecture Notes in Electrical Engineering, 699. Springer, Singapore, 2021.
[2] C. Palanichamy, C. Nadarajan, P. Naveen, N.S. Babu, and D. Lakshmi. Budget Constrained Energy Conservation-An Experience with a Textile Industry. IEEE Power Engineering Review, 21(10): 58–58, 2001.
[3] C. Palanichamy and N.S. Babu. Second stage energy conservation experience with a textile industry. Energy Policy, 33(5): 603–609, 2005.
[4] R. Jananthant, S. Ameer, and R. Shiyamini. Comparative study of energy assessment from apparel industries: the context of Sri Lanka. First international conference on industrial and information systems, Sri Lanka, August 2006.
[5] S. U. Kulkarni and Kalpana Patil. Energy Audit of an Industrial Unit- A Case Study. International Journal of Emerging Science and Engineering, 2(1), 2013.
[6] E. Hewitt and Y. Wang. Understanding the Drivers of National-Level Energy Audit Behavior: Demographics and Socioeconomic Characteristics. Sustainability, 12(5):2059, 2020.
[7] A. Kumar, S. Ranjan, M.B.K. Singh, P. Kumari, and L. Ramesh. Electrical Energy Audit in Residential House. Procedia Technology, 21: 625–630, 2015.
[8] P. Thollander, S. Paramonova, E. Cornelis, O. Kimura, A. Trianni, M. Karlsson, E. Cagno, I. Morales, and J.P.J. Navarro. International study on energy end-use data among industrial SMEs (small and medium-sized enterprises) and energy end-use efficiency improvement opportunities. Journal of Cleaner Production, 104: 282–296, 2015.
[9] A. Kluczek and P. Olszewski. Energy audits in industrial processes. Journal of Cleaner Production, 142(4): 3437–3453, 2017.
[10] T. Hussain and A. Wahab. A critical review of the current water conservation practices in textile wet processing. Journal of Cleaner Production, 198: 806–819, 2018.
[11] S. M. Agah and H. A. Abyaneh. Distribution Transformer Loss-of-Life Reduction by Increasing Penetration of Distributed Generation. IEEE Transactions on Power Delivery, 26 (2): 1128–1136, 2011.
[12] E. Chiodo, D. Lauria, F. Mottola, and C. Pisani. Lifetime characterization via lognormal distribution of transformers in smart grids: Design optimization. Applied Energy, 177: 127–135, 2016.
[13] S.K. Rajput and D.K. Dheer. Mathematical modelling and experimental validation for impact of high solar cell temperature on transformer loading and life. Renewable Energy Focus, 39: 27–36, 2021.
[14] O. Gandhi, D.S. Kumar, C.D. Rodríguez-Gallegos, and D. Srinivasan. Review of power system impacts at high PV penetration Part I: Factors limiting PV penetration. Solar Energy, 210: 181–201, 2020.
[15] S. P. Bihari, P. K. Sadhu. A novel function roach and intelligence control technique for power quality improvement in grid incorporated solar photovoltaic system. International Journal of Green Energy, 0(0): 1–21, 2021.
[16] A. Elkholy. Harmonics assessment and mathematical modeling of power quality parameters for low voltage grid connected photovoltaic systems. Solar Energy, 183: 315–326, 2019.
[17] J. Yaghoobi, A. Alduraibi, D. Martin, F. Zare, D. Eghbal, R. Memisevic. Impact of highfrequency harmonics (0–9 khz) generated by grid-connected inverters on distribution transformers. International Journal of Electrical Power Energy Systems, 122: 106177, 2020.
[18] A. Kumari, J. Patra, N. Pal, and N. Kumar. Impact of Solar Panel on the Transformer Performance: A Case Study. Iran. J. Sci. Technol. Trans. Electr. Eng., 44(3): 1197–1206, 2020.
[19] W.N. Macêdo and R. Zilles. Influence of the power contribution of a grid-connected photovoltaic system and its operational particularities. Energy for Sustainable Development, 13(3): 202–211, 2009.
[20] C.Y. Lau, C.K. Gan, Z. Salam, and M. F. Sulaima. Impact of Solar Photovoltaic System on Transformer Tap Changer in Low Voltage Distribution Networks. Energy Procedia, 103: 58–63, 2016.
[21] H. Hondo. Life cycle ghg emission analysis of power generation systems: Japanese case. Energy, 30(11): 2042–2056, 2005.
[22] S. K. Yadav, U. Bajpai. Energy, economic and environmental performance of a solar rooftop photovoltaic system in india. International Journal of Sustainable Energy, 39(1): 51–66, 2020.
[23] Energy efficiency in electrical utilities. Guide book 3 for National Certification Examination for Energy Managers and Auditors, bureau of energy efficiency, India, 2005.
Biographies

Saurabh Kumar Rajput. He is born in Kanpur, UP, India. He received the B.Tech. degree in electrical engineering from UPTU Lucknow, India, in 2006, the M.Tech. degree in energy studies from Indian Institute of Technology Delhi, India, in 2012. Currently he is serving as an assistant professor at the department of electrical engineering, Madhav Institute of Technology and Science Gwalior, MP. He has 11 years of experience in the field of teaching, research and energy audit consultancy.

Dharmendra Kumar Dheer. He is born in Bhagalpur, Bihar, India. He received the B.Sc. engineering degree in electrical engineering from Muzaffarpur Institute of Technology Muzaffarpur, India, in 2007, the M.Tech. degree in electrical engineering with specialization in power system engineering from Indian Institute of Technology Kharagpur, India, in 2010, and the Ph.D. degree in power and energy systems engineering from the department of Energy Science and Engineering, Indian Institute of Technology Bombay, Mumbai, India, in 2017. Currently he is serving as an assistant professor at the department of electrical engineering, National Institute of Technology Patna, Bihar. He has one and half year of teaching experience after M.Tech. degree, six month of research experience as a research associate at IIT Bombay and five and half months of research experience as a postdoctoral researcher at Arizona State University (ASU), USA. His current research interest includes stability and control of microgrids, stability aspects of conventional power systems, active distribution network and solar photovoltaic.
Distributed Generation & Alternative Energy Journal, Vol. 38_1, 67–84.
doi: 10.13052/dgaej2156-3306.3814
© 2022 River Publishers