Optimal Location of Electric Vehicles in a Wind Integrated Distribution System Using Reptile Search Algorithm
Nasir Rehman1,*, Mairaj-ud din Mufti2 and Neeraj Gupta3
1National Institue of Technology, Srinagar, Jammu and Kashmir, India
2Department of Electrical Engineering, NIT Srinagar, India
3Electrical Engineering Department, National Institute of Technology, Srinagar, J&K, India
E-mail: nasirrehman92@gmail.com
*Corresponding Author
Received 15 January 2022; Accepted 07 March 2022; Publication 09 December 2022
Abstract
Distributed generation (DG) has been employed over the years in distribution systems to enhance system voltage profile, improve voltage regulation and minimise power losses leading to improved stability besides economic benefits. This work addresses an application of reptile search algorithm (RSA) based optimization technique to determine the optimal placement of electric vehicles (EVs) in distribution systems. A matrix approach based radial distribution load flow method is adopted to determine the optimal location of DGs with the heuristic intelligent search approach of RSA looking after the optimal placement of EV loads. This work presents a standard IEEE-33 and 69 bus system integrated with a wind turbine generating system (WTGS). The system is modeled for optimal placement of EV loads such that the system voltage is maintained within allowable limits by reducing overall system losses. The optimal placement of EV loads in a radial distribution network (RDN) implies establishing an efficient active distribution network satisfying several operating parameters like bus voltage limits and current capacity of feeders while maintaining network radiality with minimal system losses. The proposed technique is investigated on the benchmark IEEE-33 and 69 bus test systems. The simulated results depict a substantial improvement in convergence characteristics and reduction in system losses.
Keywords: Distributed generations, reptile search algorithm, electric vehicle, optimal location, wind turbine generating system.
1 Introduction
Renewable energy sources (RES) have grown in popularity over the years and have become a vital feature of the integrated grid. They are environmentally beneficial and also provide consumers with a cost-effective alternative to conventional fossil fuels, which are becoming increasingly expensive. The variable significance of renewable energy form power generation units such as wind and solar, along with the inclusion of electric vehicles (EV) into the distribution system, is growing rapidly with each day, causing substantial challenges and uncertainties. A comprehensive understanding of the effects of distributed generations (DGs) and load fluctuation in distribution systems is important for better renewable energy integration. The RES are installed in distribution systems at appropriate locations keeping in mind objectives like, minimizing overall network losses, improving voltage profile, reducing peak load, and managing system security [1]. The overall improvements in the network due to the integration of RES could be both economic and technical in nature [2]. The most significant technical advantages include: minimization of overall network losses, voltage profile improvement and frequency improvement. Besides, reduction in greenhouse emissions, enhancement in power quality, enhancement of reliability and system security are also some added technical advantages. Further, the integration of RES provides some substantial economic advantages including overall reduction of capital expenditure, fuel expenses and reserve requirements leading to the improvement in overall system efficiency. Therefore, the accurate positioning of DGs in the network is of critical concern in the distribution systems. Sizing is also an important concern and must be chosen along with positioning of DGs to achieve the aforesaid benefits. To address these problems, many novel strategies and approaches have been proposed by researchers in the literature so far. All methodologies have merits and drawbacks that are consistent with the data and systems under consideration.
Meta-heuristic techniques have been extensively used in determining size and optimal locations for DG placement in the distributed networks. These algorithms are computational artificial intelligence paradigms especially used for solving sophisticated optimization problems. To name a few, these include genetic algorithm (GA), particle swarm optimization (PSO), differential evolution (DE) algorithm, Artificial bee colony (ABC) algorithm. These techniques range from simple local search procedures to complex learning processes. In [3], GA is used to identify the appropriate location and size of DG units with the objective of minimizing power losses. In [4], the objective function is to reduce the economical and technical constraints of the distribution network for DG employment. To achieve better voltage stability of the distribution system, a stability index [5] for scaling DGs is developed to include DGs at appropriate locations. The authors in [6] have proposed that DGs be planned through GA in order to decrease the cost of energy loss and improve system advancement. The optimal allocation of multi-distributed generators on distribution system reliability and power losses using DE algorithm is investigated in [7]. An effective cumulative performance index, utilizing voltage profile improvement, loss reduction and voltage stability index is considered to minimise system loss using PSO in [8]. Owing to the inherent drawbacks of meta heuristic approaches, many researchers are experimenting with these approaches in conjunction with other optimization methods to achieve best possible results [9, 10, 11].
Meta heuristic techniques have also been employed to determine the optimal placement of EV charging stations by incorporating uncertainties in charging as well as in demand. The objective functions to be minimised comprises energy loss, voltage deviation of the power system network and minimization of resources to incorporate large scale EV integration. In [12], the optimal placement of EV charging stations is determined in a radial distribution network by using DE and harris hawks optimization methods. [13] considers techno-environmental aspects in a distribution system to determine the optimal sites of DGs and EVs by using future search algorithm. The effect of EV charging stations on 33 bus and 85 bus test system by minimizing power loss and maintaining voltage level in presenece of EVs is discussed in [14]. The optimal allocation of EV charging stations using hybrid bi-level programming verified on a 84 bus test system in Tamil Nadu is reported in [15].
The various application of meta heuristic techniques in power system are discussed in [16, 17, 18, 19]. These techniques are employed in reactive power planning and positioning problems of phasor measurement units in the power networks to improve grid observability. [20, 21] have employed the meta heuristic techniques for the parameter estimation of transmission line conductors. These techniques are also used to solve complex engineering problems of other fields as discussed in [22, 23]. This work proposes a similar nature inspired algorithm based on the hunting and encircling behavior of crocodiles known as reptile search algorithm (RSA). It differs from the conventional optimization algorithms in that it uses a special approach developed to update the locations of the solutions utilizing four distinct processes of crocodile hunting. The main focus of RSA is to develop advanced search strategies capable of producing relatively high solutions to complex problems and to obtain new best possible results that can improve in the solving of complex real life scenarios. In this work, its application is performed for optimal allocation of EV loads along with the integration of wind turbine generating system (WTGS) as a DG into distribution system. To determine the superiority of RSA, first the locations of DGs are specified using distribution system load flow method, then the optimal placement of EVs are optimized using the RSA. The integration of various DGs in the distribution network enhances the voltage profile and lowers the overall system losses and thus may cause the restructuring of networks and increase the capital costs. The main contribution of this work is summarized as:
• The impact of EV loads are evaluated in an active distribution network.
• A new advance strategic nature based algorithm inspired by crocodile hunting is proposed to evaluate the EV load sites in the network.
• The network is integrated with WTGS units and EV loads in such a way that the voltage profile is maintained and overall system losses are minimised.
This work is divided into several sections; The WTGS is discussed with the mathematical modeling in Section 2 and EV modeling in Section 3. The distribution load flow method is discussed in Section 4 and in Section 5, the optimization algorithm employed is thoroughly illustrated with mathematical modeling. The problem formulation in Section 6. The consolidated flowchart of the approach employed is discussed in Section 7. Results and discussions in Section 8 and, finally, the conclusion in Section 9.
2 Wind Turbine Generating System
2.1 Principle
RES like solar and wind are in demand due to their abundance and renewable nature. Wind energy conversion systems (WECS) convert wind energy into mecchanical energy by employing wind generators like permanent magnet synchronous generators (PMSG), doubly fed induction generators (DFIG), induction generators and synchronous generators. Wind turbine generators convert mechanical energy into electrical energy which is then utilized to power windmills, pump water, process grains, or drive machinery. To get optimum power output from a WECS, the generator’s rotational speed is raised. A pulse width modulation converter, a generator-side converter, and a grid-side inverter are in charge of delivering the generator’s output power to the grid. Figure 1 depicts the integration of a WECS in a power system.
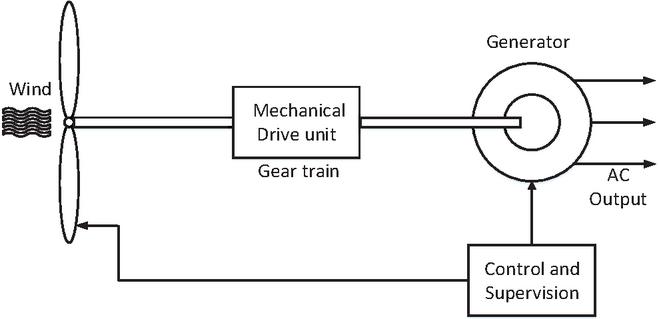
Figure 1 Wind energy conversion system.
2.2 Wind Power Statistics
Renewable resources, such as wind, are becoming a big aspect of energy generation in recent times, and their significance is growing. For the reliable integration of wind energy into the grid, appropriate models must be applied to study the impacts of wind power, which vary on wind speed. Although wind speed is uncertain, the probability of a specific wind speed can be predicted. The discrete histogram represents the wind speed (m/s) and number of hours per year that the wind blows (as measured from site data). A continuous probability density function (PDF) can be used to describe the information provided in a discrete histogram. The region between any two wind speeds represents the possibility that the wind is between those two speeds, which is the distinguishing property of such a PDF. The Weibull PDF is the basic foundation for analyzing wind speed statistics. The wind stastics of wind power is thouroughly illustrated in [24], and it is derived as:
| (1) |
where represents wind speed, c as scaling factor and k is the shape parameter, which modifies the characteristics of PDF. For k = 2, the weibull PDF is characterised as the Rayleigh PDF computed by Equation (2) and is the most commonly used distribution function estimating wind speeds, because it has intervals of low and strong wind speeds.
| (2) |
2.3 Output Power From Wind Turbine
In regard to the output power of a wind turbine, a reliable technique of measuring wind speed is important. The instantaneous output power of a wind turbine is calculated using a power curve provided by the manufacturer of a specific model. The output power of a wind turbine is a function of wind speed and can be converted into mechanical power given in [24] as can be seen in Figure 2.
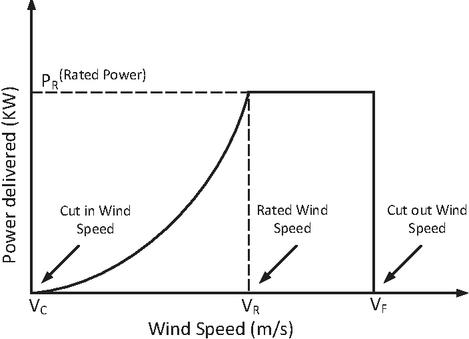
Figure 2 Power wind speed characteristics
In this study, the wind turbine featured in the wind farm are stall-regulated fixed-speed wind turbines. The steady-state equivalent model of an induction machine shown in Figure 3 is applied in the mathematical model of wind turbine [25]. They are directly coupled to power system networks through a transformer. The active and reactive powers of machine are computed as:
| (3) | ||
| (4) |
Where V signifies the terminal voltage and s as the machine’s slip. Also B to X are constants. In [24], the thorough analysis of mechanical power conversion from wind speed is illustrated. The values of all the variables and constants used in FSWG parameters are given in [26].

Figure 3 Equivalent model of an induction machine.
2.4 Load Flow with WTGS
Wind is a major part of producing electrical energy in most countries. Wind-generated electricity is much expensive to supply to commercial and residential consumers than it is to industrial customers, as the distribution market will see the most substantial changes in deregulated electricity networks. Electric power generally flows from the substation to the end of feeders in distribution networks throughout planning and operation. However, the incorporation of WTGS may result in reverse power flow in the distribution lines. There are various approaches for load flow using WTGS for distribution systems in the literature. In this research, matrix based approach is used to integrate power output from WTGS into distribution systems [27]. Induction generators are explored as WTGS power conversion devices; they primarily function as variable reactive power generators. The wind turbine power curve given by the manufacturer is used to determine the active power output, and the reactive power required can be expressed as:
| (5) |
where, is the reactive power at bus i consumed by WTGS. is the reactive power delivered by capacitor at bus i.
3 EV Load Modelling
Modeling of EVs is divided into several categories based on the various types of EVs. In this work, the ZIP load model, which is a commonly used form of EV load, is analyzed using voltage dependent load (VDL) modeling for active and reactive powers.
For steady state analysis, EV load modeling involves a thorough knowledge of the battery profile. Thus, for battery chargers to deliver improved voltage and current quality, efficient charging techniques are required. Nowadays, all battery chargers use traditional charging techniques such as constant voltage and constant current with unidirectional chargers [28]. Figure 4 illustrates a traditional configuration of an on-board EV battery charger, which represents two converters: an AC-DC converter and a DC-DC converter. The detailed analysis of the charger parameters is discussed in [29]. As seen in Figure 4, the grid voltage and grid current are given to the battery charger from the grid side, while the terminal voltage of the battery is , and is the current absorbed by the battery. The dynamic parameters of the battery describe the terminal voltage of the battery, . During the charging process, the active and reactive powers on the grid side can be calculated as follows:
| (6) |
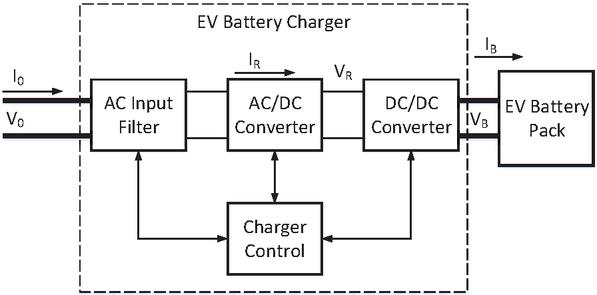
Figure 4 On-board EV battery charger.
The active and reactive powers consumed from the AC side are recorded at each state of charge (SOC) and voltage level, whereas a set of and values are acquired at different nominal voltage levels for a range of (180V–230V) and SOC (10%–100%). These acquired values are analyzed to evaluate the voltage-dependent characteristics of the EV load at various levels of SOC. To ascertain the EV ZIP values, a constrained least-squared approach is used to generate a best-fit approximation to the recorded values. Finally, the best-fit ZIP values can be used in the ZIP equations shown below:
| (7) |
where and are active load power and reactive load power acquired from Equation (6). is the bus voltage at which load is connected and is the nominal rated voltage. , and are constant impedance, constant current and constant power parameters of active fraction of EV load. , and are constant impedance, constant current and constant power parameters of reactive fraction of EV load.
4 Distribution Load Flow Method
A simplified method of load flow analysis is hinged on the product of bus injection to branch current (BIBC) and branch current to bus voltage (BCBV) matrices. This method is briefly elucidated in [30]. The advantage of this approach include its non-dependence on matrix decomposition and interchanging of admittance and jacobian matrices resulting in computational ease. BIBC matrix depicts the correlation of currents between network buses and branches whereas BCBV matrix depicts the correlation between currents in a branch and their corresponding bus voltages. Figure 6 illustrates the flowchart of load flow algorithm used in distribution system.
BIBC is the correlation between currents obtained by applying kirchoff’s current law in the branches of the distribution radial system.
| (8) |
And can be expressed in matrix form as:
| (9) | |
| (10) |
BIBC matrix contains only 0 and 1 elements to form upper triangular matrix. By applying kirchoff’s voltage law, BCBV matrix can be obtained in the same manner as BIBC and is given as:
| (11) | ||
| (12) |
Where DLF represents a distribution load flow that yields the power flow analysis of the IEEE test bus systems by multiplying the above two matrices (BIBC and BCBV).
5 Optimization Algorithm
RSA is inspired by the hunting action of crocodiles, recently introduced by [31]. This search algorithm is motivated by the social behavior, hunting mechanisms and encircling processes of crocodiles and is given in the form of exploitation (local search) and exploration (global search) stages. Crocodiles hunt by surrounding and encircling their prey. To demonstrate the suggested RSA and execute the optimization procedures, these mechanisms are mathematically represented in next section. As RSA is a gradient-free and population based approach, it may be used to both complex and simple optimization problems with specified constraints.
5.1 Mathematical Modelling of Algorithm
The RSA follows four distinct processes to evaluate the optimization procedure.
5.1.1 Initialization Phase
In RSA, the optimization system starts with a collection of candidate solutions (Y), as shown in Equation (13), which is formed stochastically, and the strongest attained solution in each iteration is designated the approximately optimum solution.
| (13) |
where Y indicates a collection of candidate solutions produced at random using Equation (14). N is the number of candidate solutions and n is the number of locations. means the location of the solution and is computed as:
| (14) |
where rand is a random variable and UB as upper and LB as lower bounds of problem respectively.
5.1.2 Encircling Phase
In this portion, the exploration of the RSA is discussed. Crocodiles engage in two movements when encircling: high walking and belly walking, according to their encircling behavior. These movements pertain to various reigns, each of which is dedicated to the exploratory search (globally). Unlike the other search spaces, the high and belly motion of crocodile motions do not allow them to reach the intended prey due to perturbations (hunting phase). There are two requirements that must be met throughout this phase of the search. condition for the high walking movement strategy, while and condition for the belly walking movement approach. This indicates that this requirement will be met for around half of the exploration cycles (high walking) and the other half (belly walking). The position update equations for the exploration phase are provided in this study as:
where indicates the place in the best-attained solution thus far, rand determines a random number between 0 and 1, t signifies the present iteration number and the maximum iterations represented by T. The hunting operator specifies the location in the solution, which is determined using Equation (16). is a sensitive parameter that influences the encircling phase exploration accuracy (i.e., High walking) throughout the course of iterations and is set to 0.1. To reduce the search area, decrease function is computed using Equation (17). signifies a random position of the solution, and is a random value between [1 N]. Evolutionary Sense ES(t) is a probability ratio derived using Equation (18) that takes randomly decreasing values between 2 and -2 across the number of repetitions.
| (16) | |
| (17) | |
| (18) |
is a tiny value, is a random integer number between 1 and 1. The correlation value is utilised as 2 in Equation (18) to yield values between 2 and 0. The percentage difference between the current position of and best attained solution at this place is signified by and computed as:
| (19) |
is the average position of the solution, as computed by Equation (20). The sensitive factor , which is set to 0.1, regulates the exploration efficiency for hunting involvement throughout the iteration process.
| (20) |
5.1.3 Hunting Phase
This section explains exploitative behavior of RSA. Crocodiles have two hunting tactics, according to their hunting behavior: hunting coordination and cooperation. The RSA exploitation mechanisms take use of these tactics in search space to locate the best solution and can be computed using Equation (21). When and the hunting coordination approach is used; otherwise, when and the hunting cooperation strategy is used. The following position reviewing formulations are proposed for the exploitation phase.
5.1.4 Time complexity
The intricacy of the proposed RSA is determined by three primary factors i.e., solution updates, number of fitness evaluations and initialization processes.
With N solutions, the computational complexity of the initialization step is O(N). The updating procedures have a computational complexity of . As a result, the suggested RSA’s computational complexity is as follows:
| (22) |
where T determines the number of iterations, N is the number and D is the size of solution utilised respectively.
The overview of the processes executing in the proposed optimization algorithm is graphically illustrated as a flowchart in Figure 5.
6 Problem Formulation
DGs are often installed on the distribution side that is proximate to the load side of the power system. Most of the loads connected in a distribution network are frequency and voltage-dependent loads. A greater level of DGs in distribution systems significantly impacts the topology and operation of networks by influencing the planning techniques of distribution companies considering overall economic and technical factors. In most cases, the DG allocation task is characterized as a nonlinear, probabilistic, or even as a heuristic function. The formulation of the objective function varies in every approach as per varied objectives.
In this work, the voltage profile is being considered with the integration of the WTGS model by reducing overall system losses. Unoptimized placement of DGs may have a negative effect in a power system like steep voltage rise and increased power losses due to reverse power flow. The optimal placement of EV loads is very important to maintain a steady voltage profile of the system in addition to WTGS integration. Thus, finding the appropriate arrangement and placement of EV loads in a radial distribution network means establishing an efficient active distribution network that satisfies several operating parameters, such as voltage limits of buses and current capacity of feeders, and maintains the network radiality while incurring minimal overall losses.
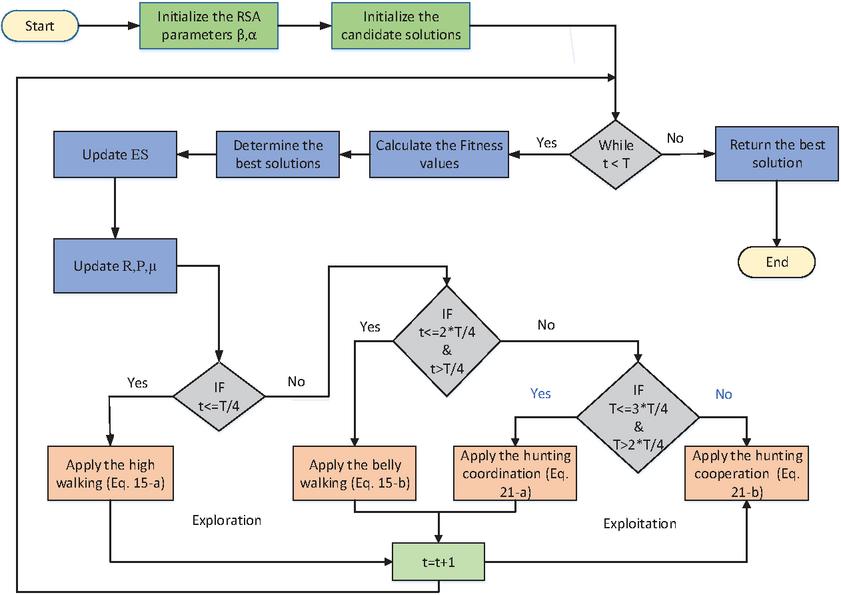
Figure 5 Flowchart of algorithm.
6.1 Objective Function for Voltage Profile
| (23) |
where, is voltage at bus i and is rated voltage.
6.2 Constraints
• Power balance constraint : The active and reactive powers must be equal to the total generated power and the overall load of the systems included the overall losses in the system.
• Voltage constraint : The voltage at each bus should be limited within minimum and maximum limits.
• DG power generation constraints : The DG capacity is constrained by the resources at any certain locations. Thus, it is required to limit DG power generation capacities.
7 Consolidated Flowchart of the Approach
In this work, the RSA approach is employed in the allocation of EV loads in an integrated distribution network. The flowchart of methodology is shown in Figure 6 and the step-by-step process of approach in the proposed problem is stated as:
• The busdata and linedata of the test systems are initialized.
• BIBCBCBV matrices are formed to obtain distribution load flow method.
• The bus voltages and line currents are determined to identify voltage violated buses in the system.
• The proposed DGs (WTGS) are installed at the weak buses to enhance the voltage profile of the system.
• The busdata and linedata of the system are updated for the allocation of EV loads.
• The number of EV loads to be connected are decided as candidates for the initialization of RSA.
– The collection of candidates randomly produces the candidate solutions using Equation (14) within minimum number of EV loads (lower bound) and maximum number of EV loads (upper bound) to be incorporated.
– The placement of EV loads (candidate solutions) are employed at various buses to determine optimal solutions.
– The best solutions are identified, depending upon the intricacy of the approach. The more the location of EV loads set initaially, the more the exploration of solutions.
• The EV loads are integrated at best candidate solutions.
• The busdata and linedata of the integrated system are updated to ascertain the voltage profile and losses of the system.
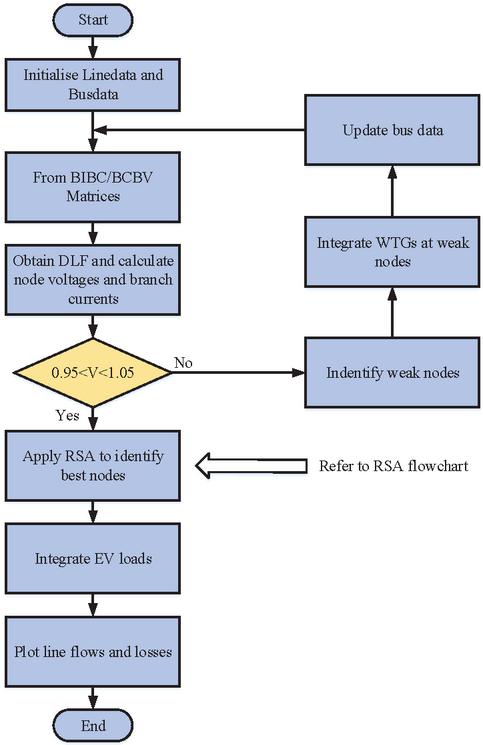
Figure 6 Flowchart of methodology.
8 Results and Discussion
To verify the efficiency and scalability of the proposed RSA, two IEEE test bus systems are considered. The distribution load flow approach is initially employed on test bus systems to identify weak buses by monitoring voltage limit violations in order to determine where DGs should be placed. The EV loads are then integrated in the network employing RSA such that the voltage at buses remains close to unity with minimum impact on active power losses.
8.1 IEEE-33 Bus Test System
The IEEE-33 bus test system comprises of 33 nodes (buses) and 32 branches. The rated voltage of the said system is 12.66 kV with base of 100 MVA. The total active load is 3.715 MW and reactive load is 2.3 MVar.
Table 1 Voltage profile of IEEE-33 test bus integrated system
| Bus Numbers | Voltages (p.u) Without Integration | Voltages (p.u) With Integration of Wind | Voltages (p.u) With Integration of Wind and EV Loads |
| 1 | 1 | 1 | 1 |
| 2 | 0.997 | 0.998 | 0.9979 |
| 3 | 0.9829 | 0.9892 | 0.9887 |
| 4 | 0.9755 | 0.9857 | 0.9849 |
| 5 | 0.9681 | 0.9824 | 0.9813 |
| 6 | 0.9497 | 0.9742 | 0.9721 |
| 7 | 0.9462 | 0.9753 | 0.9723 |
| 8 | 0.9414 | 0.9773 | 0.974 |
| 9 | 0.9351 | 0.9827 | 0.9787 |
| 10 | 0.9294 | 0.9885 | 0.9839 |
| 11 | 0.9286 | 0.9895 | 0.9848 |
| 12 | 0.9271 | 0.9915 | 0.9867 |
| 13 | 0.921 | 1.0024 | 0.9965 |
| 14 | 0.9187 | 1.0078 | 1.0012 |
| 15 | 0.9173 | 1.0134 | 1.0064 |
| 16 | 0.9159 | 1.0203 | 1.0128 |
| 17 | 0.9139 | 1.0363 | 1.0281 |
| 18 | 0.9133 | 1.0399 | 1.0317 |
| 19 | 0.9965 | 0.9975 | 0.9974 |
| 20 | 0.9929 | 0.9939 | 0.9938 |
| 21 | 0.9922 | 0.9932 | 0.9931 |
| 22 | 0.9916 | 0.9926 | 0.9925 |
| 23 | 0.9794 | 0.9857 | 0.9852 |
| 24 | 0.9727 | 0.9791 | 0.9785 |
| 25 | 0.9694 | 0.9758 | 0.9752 |
| 26 | 0.9478 | 0.9724 | 0.9702 |
| 27 | 0.9452 | 0.9699 | 0.9677 |
| 28 | 0.9338 | 0.9587 | 0.9566 |
| 29 | 0.9255 | 0.9507 | 0.9485 |
| 30 | 0.922 | 0.9473 | 0.9451 |
| 31 | 0.9178 | 0.9432 | 0.941 |
| 32 | 0.9169 | 0.9423 | 0.9401 |
| 33 | 0.9166 | 0.9421 | 0.9398 |
The distribution system matrix based load flow method is applied on IEEE-33 bus data to identify voltage voilated buses. As seen in Table 1, the voltage (p.u) of bus number 17 and bus number 18 are 0.9139 and 0.9133 which is very low and is optimal location for DG integration. By integrating WTGS at these optimal locations, the voltage profile of overall system is enhanced. The Figure 8 clearly shows the improvement in voltage profile at various buses of IEEE-33 bus system. After integration of DGs, the appropriate sitting of EV loads is performed using RSA by considering the objective function given in Equation (23) while maintaining the constraints keeping voltage range close to the voltage profile of wind integrated system.
In Figure 9, the integration of EV loads using RSA approach clearly depicts that the voltage profile is kept close to the enhanced voltage profile. The voltage at buses are kept within constraints and the overall active power losses also remain at lower side shown in Figure 10. The deviation in voltage profile of system regulates the active power losses which affects the overall system losses. Thus the integration of WTGS in the system not only enhances the voltage profile but also lowers the overall system losses as clearly shown in histogram (Figure 10). The layout of integrating DGs and EV loads in an IEEE-33 test bus system is shown in Figure 7.
8.2 IEEE-69 Test Bus System
IEEE-69 bus test system comprises of 69 nodes (buses) and 68 branches. The total active load is 3.8 MW and reactive load is 2.69 MVar. Similar to IEEE-33 bus system, the load flow is initially run to identify voltage violated buses.
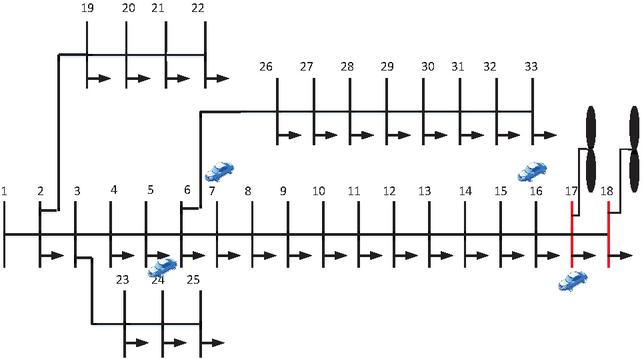
Figure 7 IEEE 33 bus test system.
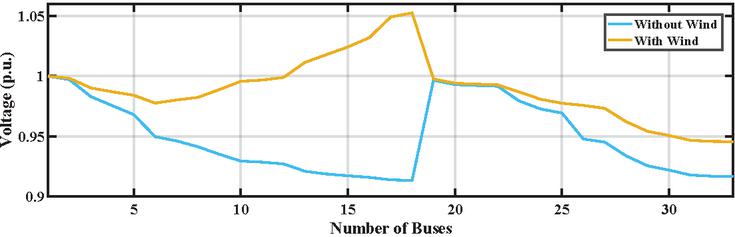
Figure 8 Voltage profile of IEEE-33 bus integrated with wind system.
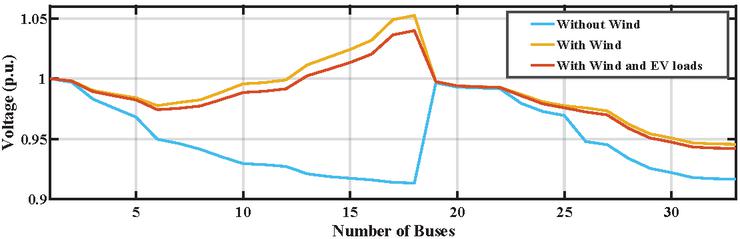
Figure 9 Voltage profile of IEEE-33 bus system integrated with wind and EV loads.
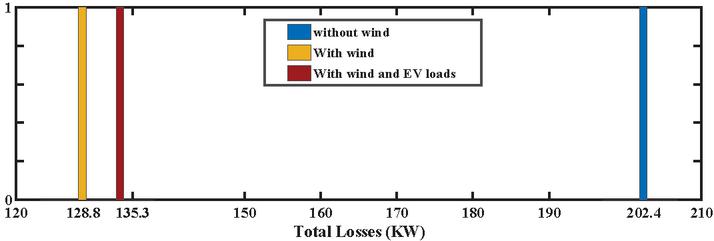
Figure 10 Histogram of active power losses of IEEE-33 test bus system.
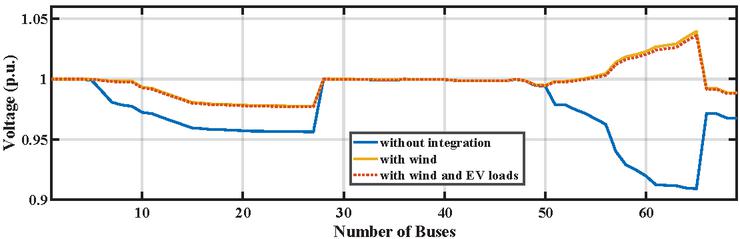
Figure 11 Voltage profile of IEEE-69 test bus system integrated with wind and EV loads.
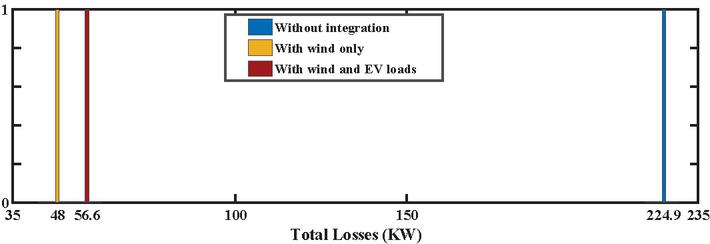
Figure 12 Voltage profile of IEEE-69 test bus system integrated with wind and EV loads.
Table 2 Voltage profile of IEEE-69 test bus integrated system
| Bus numbers | Voltages (p.u) Without Integration | Voltages (p.u) With Integration of Wind | Voltages (p.u) With Integration of Wind and EV Loads |
| 1 | 1 | 1 | 1 |
| 2 | 1 | 1 | 1 |
| 3 | 0.9999 | 1 | 1 |
| 4 | 0.9998 | 0.9999 | 1 |
| 5 | 0.999 | 0.9998 | 0.9999 |
| 6 | 0.9901 | 0.9989 | 0.9992 |
| 7 | 0.9808 | 0.9979 | 0.9984 |
| 8 | 0.9786 | 0.9976 | 0.9983 |
| 9 | 0.9774 | 0.9976 | 0.9983 |
| 10 | 0.9724 | 0.9927 | 0.9934 |
| 11 | 0.9713 | 0.9916 | 0.9923 |
| 12 | 0.9682 | 0.9885 | 0.9892 |
| 13 | 0.9653 | 0.9857 | 0.9863 |
| 14 | 0.9624 | 0.9828 | 0.9835 |
| 15 | 0.9595 | 0.98 | 0.9807 |
| 16 | 0.959 | 0.9795 | 0.9802 |
| 17 | 0.9581 | 0.9786 | 0.9793 |
| 18 | 0.9581 | 0.9786 | 0.9793 |
| 19 | 0.9576 | 0.9782 | 0.9789 |
| 20 | 0.9573 | 0.9779 | 0.9786 |
| 21 | 0.9568 | 0.9774 | 0.9781 |
| 22 | 0.9568 | 0.9774 | 0.9781 |
| 23 | 0.9567 | 0.9773 | 0.978 |
| 24 | 0.9566 | 0.9772 | 0.9779 |
| 25 | 0.9564 | 0.977 | 0.9777 |
| 26 | 0.9564 | 0.9769 | 0.9776 |
| 27 | 0.9563 | 0.9769 | 0.9776 |
| 28 | 0.9999 | 1 | 1 |
| 29 | 0.9999 | 0.9999 | 1 |
| 30 | 0.9997 | 0.9998 | 0.9999 |
| 31 | 0.9997 | 0.9998 | 0.9999 |
| 32 | 0.9996 | 0.9996 | 0.9999 |
| 33 | 0.9993 | 0.9994 | 0.9997 |
| 34 | 0.999 | 0.9991 | 0.9996 |
| 35 | 0.9989 | 0.999 | 0.9996 |
| 36 | 0.9999 | 1 | 1 |
| 37 | 0.9997 | 0.9998 | 0.9998 |
| 38 | 0.9996 | 0.9996 | 0.9996 |
| 39 | 0.9995 | 0.9996 | 0.9996 |
| 40 | 0.9995 | 0.9996 | 0.9996 |
| 41 | 0.9988 | 0.9989 | 0.9989 |
| 42 | 0.9986 | 0.9986 | 0.9986 |
| 43 | 0.9985 | 0.9986 | 0.9986 |
| 44 | 0.9985 | 0.9985 | 0.9986 |
| 45 | 0.9984 | 0.9984 | 0.9985 |
| 46 | 0.9984 | 0.9984 | 0.9985 |
| 47 | 0.9998 | 0.9999 | 0.9999 |
| 48 | 0.9985 | 0.9986 | 0.9988 |
| 49 | 0.9947 | 0.9948 | 0.9954 |
| 50 | 0.9942 | 0.9943 | 0.9949 |
| 51 | 0.9785 | 0.9976 | 0.9983 |
| 52 | 0.9785 | 0.9976 | 0.9982 |
| 53 | 0.9747 | 0.9986 | 0.9994 |
| 54 | 0.9714 | 0.9997 | 1.0006 |
| 55 | 0.9669 | 1.0013 | 1.0025 |
| 56 | 0.9626 | 1.003 | 1.0044 |
| 57 | 0.9401 | 1.0119 | 1.0138 |
| 58 | 0.929 | 1.0163 | 1.0185 |
| 59 | 0.9248 | 1.018 | 1.0203 |
| 60 | 0.9197 | 1.0204 | 1.0228 |
| 61 | 0.9123 | 1.0239 | 1.0267 |
| 62 | 0.9121 | 1.0251 | 1.0279 |
| 63 | 0.9117 | 1.0262 | 1.0291 |
| 64 | 0.9098 | 1.0315 | 1.0346 |
| 65 | 0.9092 | 1.0361 | 1.0394 |
| 66 | 0.9713 | 0.9916 | 0.9922 |
| 67 | 0.9713 | 0.9916 | 0.9922 |
| 68 | 0.9679 | 0.9882 | 0.9889 |
| 69 | 0.9679 | 0.9882 | 0.9889 |
In IEEE-69 test bus system, there are 5 buses identified as seen in Table 2. The DGs are not integrated on all the 5 violated buses because the voltage level is enhanced beyond the limit. Thus, only 4 DGs are integrated to enhance the voltage profile to be within the constraints. The EV loads are incorporated using RSA such that the voltage at buses are close to unity. As shown in Figure 11, the integration of WTGS clearly depicts the enhancement in voltage profile. Additionally, the incorporation of EV loads does not deteriorate the voltage profile of buses of test system shown by dotted line in Figure 11. The comparison of system losses by the incorporation of WTGS and EV loads in the system is shown by histogram in Figure 12.
The improved voltage profile of IEEE-33 and 69 test systems by incorporating WTGS and EV loads is graphically shown in Figures 9 and 11 respectively. Also the voltage profile of the both test systems are tabulated in Tables 1 and 2. It is evident that the proposed algorithm performs better by maintaining bus voltages close to enhanced voltage eventually leading to an increased efficiency.
9 Conclusion
This paper presents the maiden application of crocodile-inspired reptile search algorithm (RSA) to determine the optimal placement of electric vehicle (EV) load units in a wind integrated distribution system. The RSA optimized EV load units along with the wind turbine generating systems (WTGS) effectively minimizes the overall active power loss, leading to a stable bus voltage profile at weak nodes of the system. To summarize, the work presents:
• The optimal location of WTGS by employing analytical method of distribution load flow based on matrix approach.
• The application of RSA technique to ascertain the optimal placement of EV load units resulting in increased efficiency.
• Minimization of overall active power losses by maintaining bus voltages within permissible limits.
The future extension of this work may include various power system challenges, such as determining the optimal sizing of EV loads, FACTS and energy storage devices by employing meta-heuristic techniques. The minimization of objective function can be carried out by employing a multi-objective approach.
References
[1] Attia A. El‐Fergany, “Optimal allocation of multi-type distributed generators using backtracking search optimization algorithm”, International Journal of Electrical Power & Energy Systems, vol. 64, pp. 1197–1205, 2015.
[2] Rajkumar Viral and D.K. Khatod, “Optimal planning of distributed generation systems in distribution system: A review”, Renewable and Sustainable Energy Reviews, vol. 16, no. 7, pp. 5146–5165, 2012.
[3] Deependra Singh, Devender Singh, and KS Verma, “Ga based optimal sizing & placement of distributed generation for loss minimization”, International Journal of Electrical and Computer Engineering, vol. 2, no. 8, pp. 556–562, 2007.
[4] Soma Biswas, Swapan Kumar Goswami, and Amitava Chatterjee, “Optimum distributed generation placement with voltage sag effect minimization”, Energy Conversion and Management, vol. 53, no. 1, pp. 163–174, 2012.
[5] S. Mohammad Hadi Hadavi, Behrooz Zaker, Hossein Karami, Ali Asghar Khodadoost Arani, and Gevork Babamalek Gharehpetian, “Optimal placement and sizing of dgs considering static voltage stability”, 2017 Conference on Electrical Power Distribution Networks Conference (EPDC), pp. 12–16, 2017.
[6] Mostafa F. Shaaban, Yasser M. Atwa, and Ehab F. El-Saadany, “Dg allocation for benefit maximization in distribution networks”, IEEE Transactions on Power Systems, vol. 28, no. 2, pp. 639–649, 2013.
[7] Pathomthat Chiradeja, Suntiti Yoomak, and Atthapol Ngaopitakkul, “Optimal allocation of multi-dg on distribution system reliability and power losses using differential evolution algorithm”, Energy Procedia, vol. 141, pp. 512–516, 2017, Power and Energy Systems Engineering.
[8] Naveen Jain, S. N. Singh, and S. C. Srivastava, “Planning and impact evaluation of distributed generators in indian context using multi-objective particle swarm optimization”, in 2011 IEEE Power and Energy Society General Meeting, 2011, pp. 1–8.
[9] G. Carpinelli, G. Celli, F. Pilo, and A. Russo, “Distributed generation siting and sizing under uncertainty”, in 2001 IEEE Porto Power Tech Proceedings (Cat. No.01EX502), 2001, vol. 4, pp. 7.
[10] M. Gandomkar, M. Vakilian, and M. Ehsan, “A combination of genetic algorithm and simulated annealing for optimal dg allocation in distribution networks”, in Canadian Conference on Electrical and Computer Engineering, 2005., 2005, pp. 645–648.
[11] M. Mardaneh and G.B. Gharehpetian, “Siting and sizing of dg units using ga and opf based technique”, in 2004 IEEE Region 10 Conference TENCON 2004., 2004, vol. C, pp. 331–334. Vol. 3.
[12] Arnab Pal, Aniruddha Bhattacharya, and Ajoy Kumar Chakraborty, “Allocation of electric vehicle charging station considering uncertainties”, Sustainable Energy, Grids and Networks, vol. 25, pp. 100422, 2021.
[13] J.Vara Prasad, U. Kumar, and Krishna Thandava Pandraju, “Future search algorithm for optimal integration of distributed generation and electric vehicle fleets in radial distribution networks considering techno-environmental aspects”, SN Applied Sciences, vol. 3, 04 2021.
[14] Ahmet Dogan, “Optimum sitting and sizing of wts, pvs, esss and evcss using hybrid soccer league competition-pattern search algorithm”, Engineering Science and Technology, an International Journal, vol. 24, no. 3, pp. 795–805, 2021.
[15] Charles Raja S, Vijaya Kumar N M, Senthil kumar J, and Jeslin Drusila Nesamalar J, “Enhancing system reliability by optimally integrating PHEV charging station and renewable distributed generators: A Bi-Level programming approach”, Energy, vol. 229, no. C, 2021.
[16] Rohit Babu, Saurav Raj, Bishwajit Dey, and Biplab Bhattacharyya, “Optimal reactive power planning using oppositional grey wolf optimization by considering bus vulnerability analysis”, Energy Conversion and Economics, vol. 3, no. 1, pp. 38–49, 2022.
[17] Swetha Shekarappa G, Sheila Mahapatra, and Saurav Raj, “Voltage constrained reactive power planning problem for reactive loading variation using hybrid harris hawk particle swarm optimizer”, Electric Power Components and Systems, vol. 49, no. 4-5, pp. 421–435, 2021.
[18] Nikolaos P. Theodorakatos, Miltiadis Lytras, and Rohit Babu, “Towards smart energy grids: A box-constrained nonlinear underdetermined model for power system observability using recursive quadratic programming”, Energies, vol. 13, no. 7, 2020.
[19] Rohit Babu and Biplab Bhattacharyya, “Optimal placement of phasor measurement unit using binary particle swarm optimization in connected power network”, in 2015 IEEE UP Section Conference on Electrical Computer and Electronics (UPCON), 2015, pp. 1–5.
[20] Muhammad Suhail Shaikh, Changchun Hua, Mannan Hassan, Saurav Raj, Munsif Ali Jatoi, and Muhammad Mohsin Ansari, “Optimal parameter estimation of overhead transmission line considering different bundle conductors with the uncertainty of load modeling”, Optimal Control Applications and Methods, vol. n/a, no. n/a.
[21] Muhammad Suhail Shaikh, Changchun Hua, Saurav Raj, Shubash Kumar, Mannan Hassan, Muhammad Mohsin Ansari, and Munsif Ali Jatoi, “Optimal parameter estimation of 1-phase and 3-phase transmission line for various bundle conductor’s using modified whale optimization algorithm”, International Journal of Electrical Power & Energy Systems, vol. 138, pp. 107893, 2022.
[22] Sheila Mahapatra, Bishwajit Dey, and Saurav Raj, “A novel ameliorated harris hawk optimizer for solving complex engineering optimization problems”, International Journal of Intelligent Systems, vol. 36, no. 12, pp. 7641–7681, 2021.
[23] Khaled H. Almotairi and Laith Abualigah, “Hybrid reptile search algorithm and remora optimization algorithm for optimization tasks and data clustering”, Symmetry, vol. 14, no. 3, 2022.
[24] Neeraj Gupta, “A review on the inclusion of wind generation in power system studies”, Renewable and Sustainable Energy Reviews, vol. 59, pp. 530–543, 2016.
[25] Andrés Feijóo and José Cidrás, “Modeling of wind farms in the load flow analysis”, IEEE Transactions on Power Systems, vol. 15, pp. 110–115, 2000.
[26] Nasir Rehman, M. D. Mufti, and Neeraj Gupta, “Steady state analysis of distribution system with wind and solar under various electric vehicle load models”, in 2021 IEEE 4th International Conference on Computing, Power and Communication Technologies (GUCON), 2021, pp. 1–6.
[27] J.-H. Teng, “Modelling distributed generations in three-phase distribution load flow”, IET Generation, Transmission & Distribution, vol. 2, no. 3, pp. 330, 2008.
[28] Mithat Kisacikoglu, Burak Ozpineci, and Leon Tolbert, “Reactive power operation analysis of a single-phase ev/phev bidirectional battery charger”, 07 2011, pp. 585–592.
[29] Ahmed Haidar and Kashem Muttaqi, “Behavioral characterization of electric vehicle charging loads in a distribution power grid through modeling of battery chargers”, IEEE Transactions on Industry Applications, vol. 2015, pp. 1–1, 01 2015.
[30] Jen-Hao Teng, “A direct approach for distribution system load flow solutions”, IEEE Transactions on Power Delivery, vol. 18, no. 3, pp. 882–887, 2003.
[31] Laith Abualigah, Mohamed Abd Elaziz, Putra Sumari, Zong Woo Geem, and Amir H. Gandomi, “Reptile search algorithm (rsa): A nature-inspired meta-heuristic optimizer”, Expert Systems with Applications, vol. 191, pp. 116158, 2022.
Biographies

Nasir Rehman born in Jammu and Kashmir in may 1992, graduated in Electrical and Renewable Energy engineering from BGSB university in 2014 and received his Master’s in Power Systems from Al-Falah university in 2016. He is currently pursuing Ph.D from National Institute of Technology, Srinagar, Jammu and Kashmir. His areas of interest include distribution systems, renewable energy sources, electric vehicle technologies and optimization techniques.

Mairaj-ud din Mufti received Bachelors in Electrical Engineering from NIT Srinagar in 1986. He completed his Masters in Control engineering and instrumentation in 1991 and Ph.D. in Power System Control in 1998 from the Indian Institute of Technology (IIT) Delhi, India. Currently, he is working as Professor in the Department of Electrical Engineering, NIT Srinagar. He has held important positions like Dean Research and Development, Dean Academic Affairs and Head-Department of Electrical Engineering. In 2006, he was a visiting research fellow at the Osaka university, Japan. His research interests include Power System Control, Intelligent and Advanced Control, Renewable Energy, Application of Energy Storage Devices and Power System Stability, Dynamics and Control.

Neeraj Gupta is Ph.D in power systems from Indian Institute of Technology Roorkee, Roorkee, India. He is a senior member of IEEE. He was a faculty with the Thapar University, from 2008 to 2009, Adani Institute of Infrastructure Engineering, Ahmedabad, India, in 2015 and NIT Hamirpur from 2015 to 2018 and presently, he has been working as an Assistant professor with the Electrical Engineering Department, National Institute of Technology, Srinagar, J&K, India. His work has been published in Q-1 international journals of repute like IEEE, Elsevier etc. He is also in the scientific advisory/organizing secretary of many reputed conferences of the country. He is referee of reputed journals of IEEE, Elsveir, Taylor and Francis, IET etc. His research interests include uncertainty quantification of power system, probabilistic power system, solar, wind, and electric vehicle technologies, Artificial intelligence, Machine learning, prediction etc.
Distributed Generation & Alternative Energy Journal, Vol. 38_1, 141–168.
doi: 10.13052/dgaej2156-3306.3817
© 2022 River Publishers