Power Quality Improvement of a Hybrid Renewable Energy Sources Based Standalone System Using Neuro-Fuzzy Controllers
Karanam Deepak*, Rajib Kumar Mandal and Vimlesh Verma
Department of Electrical Engineering, National Institute of Technology (NIT), Patna, Bihar, India
E-mail: karanamd.ph21.ee@nitp.ac.in; rajib@nitp.ac.in; vimlesh.verma@nitp.ac.in
*Corresponding Author
Received 20 December 2022; Accepted 04 July 2023; Publication 26 August 2023
Abstract
Wind and Photovoltaic (PV) based hybrid standalone systems for supplying electricity to remote consumers are becoming increasingly popular around the world. In general, power generation from both PV and wind is always variable due to irradiance and speed fluctuations. Furthermore, the load is unpredictably variable and changes at random. As a result, one of the main challenges in such standalone micro grids is maintaining power quality. To maintain power quality in such standalone systems, a novel controller should be developed. Furthermore, due to the unpredictable random changes in wind speed, solar irradiance, and load, a battery bank must be integrated into the standalone system via a bidirectional converter. Furthermore, the interconnection of multiple wind turbines and PV panels can create a powerful hybrid system. This paper examines a 1 MW stand-alone power generation system using numerous PV and wind systems. Maximum power points tracking devices with perturbed and observe algorithms are used to optimize the utilization of individual PV modules and wind turbines. Because of its superior priority over conventional PI controllers, a Neuro-Fuzzy integrated controller-based novel control scheme for both inverter and bidirectional converter is proposed to achieve precise response while maintaining power quality. This paper discusses extensive results obtained by establishing hardware-in-the-loop on the OPAL-RT platform to evaluate the responses of proposed controllers. The experimental results also included to provide strength to the paper.
Keywords: Wind energy, photovoltaic, power quality, hardware-in the-loop, standalone microgrid.
1 Introduction
Carbon emissions must be reduced in order to extend human life on Earth. Scholars are investigating various methods of utilizing many renewable energy sources as one of the best ways to reduce the production of carbon components [1, 2]. The generation of electricity from renewable energy sources may provide the best solution for reducing global warming by reducing the consumption of fossil fuels. As long as humans exist, wind and sun energy can freely enter the earth. Nevertheless, in order to turn mechanical energy from a wind turbine into electricity, a generator is needed. Photovoltaic (PV) modules are also needed in order to generate power from sunlight. Permanent Magnet Synchronous Generators (PMSGs) are typically utilized as generators in wind systems to produce medium power. Yet, due to the impracticality of accessing the main utility grid, localized hybrid wind-PV based standalone power generating systems are highly common in many locations, including remote ones [3]. The availability of sunlight to power PV cells continuously for 24 hours and to cause sporadic changes in the natural world is unfortunate. Moreover, the wind speed varies randomly from time to time and is not consistent at all times. Moreover, the electrical loads used by the load bus fluctuate arbitrarily. As a result, the integration of PV and wind can increase system reliability, though not always because a mechanism is needed to maintain the energy balance between generation and load. By maintaining adequate energy balance in this scenario, an energy storage device can be crucial in reducing the impact of erratic fluctuations in generation and load [4, 5]. The ability of a battery bank to react fast to changes in generation or load makes it one of many devices that can function well. Its ability to react swiftly during the battery’s charging and discharging processes [4] makes it possible to reach power balance extremely quickly. As a result, the battery bank is incorporated into the hybrid wind-PV system to increase the quality of the electricity and continually provide reliable power to meet the load. Between the battery bank and dc-link, a bidirectional DC to DC converter is employed to maintain the battery’s efficient charging and discharging process using the suggested controller. However, in order to increase system efficiency, both wind and solar power systems must be used to their full potential [4, 6]. In order to work with individual wind and PV systems and their corresponding maximum power point tracker (MPPT) algorithms, boost converters are used. Also, the distribution system needs an inverter with an appropriate control strategy because it combines single-phase and three-phase loads.
The battery bank will be charged using excess power from wind and solar energy when the load is less than the total generation, thanks to the suggested control method of the bidirectional DC to DC converter. When the generation is lower than the load, the battery is also compelled to discharge to meet the load by increasing the voltage until the power balance is maintained. The voltage at the dc-link [7], which is the point of typically linking the outputs of the PV systems, wind systems, the battery bank, and an inverter, can be used to impose the power shortfall between the total generation and the load. In order to maintain power balance, the control strategy used with a bidirectional DC to DC converter is created to maintain the dc-link voltage at its reference value. Due to the operation of single phase loads, unbalanced loads will typically be operated in a distribution system [7]. Due to uneven voltage losses across an RLC filter connected between the load and a three phase inverter, an unbalanced load may result in unbalanced voltages at the point of common coupling (PCC). As a result, the inverter’s suggested control strategy should provide balanced voltages at the PCC by producing various modulation indices for its three legs under an imbalanced load. The control strategy using a fuzzy controller can offer valuable responsiveness during random changes in comparison to proportional plus integral controllers (PIs) [8]. Also, rule sets produced by a Neuro-Fuzzy based controller advantages produce intelligible and reusable information [9, 10] and are entirely consistent with conclusions based on statistical research. Moreover, compared to Mamdani fuzzy, the Takagi-Sugeno-Kang fuzzy controller has higher design flexibility [8]. Thus, both the bidirectional DC to DC converter and inverter control techniques are implemented using a Neuro based Takagi-Sugeno-Kang fuzzy logic controller. In addition to this introduction section, the article is divided into sections that describe the system in Section 2 and give suggested controllers in Section 3. In Section 4, results from hardware in-loop (HIL) testing are examined with the use of the OPAL-RT platform. Section 5 contains the experimental results, while Section 6 discusses the conclusion. The parameters of various systems utilized in standalone systems are compressed and included in the appendix.
2 System Description
The individual MPPT devices of “X” PV groups are taken into account in order to satisfy the power requirement. Each group is created by connecting “M” PV strings in parallel, each string being compressed with “N” modules connected in series to get the necessary voltage at the dc-link. The parameters for a single PV module are presented in Appendix (Table 1). Similar to how several wind turbines are connected to dc-link through their individual MPPT converters are multiple wind turbines and their PMSGs. As a result, all PV and wind systems are linked collectively in order to create a robust dc-link employing numerous converters as MPPTs. A bidirectional DC to DC converter also connects the battery bank to dc-link. In general, all MPPT converters (also known as boost converters) function by modulating their duty cycles in accordance with the supply of renewable energy. As a result, the battery bank’s bidirectional DC to DC converter has a chance to control the voltage at the dc-link voltage. A filter connects the PCC to the mixture of single and three phase loads. In order to accommodate all the loads, a four wire system is built because some public loads are also operated in a standalone system. Most loads linked at PCC are typically either nonlinear or reactive power loads. Figure 1 depicts the entire freestanding wind-PV-Battery microgrid. From [1, 7, 11–13], modelling of wind, PV, battery bank, and RLC filter is taken into consideration. Many academics have proposed similar types of systems, however just a few of those are featured in this section. The authors of [1] create a coordinated energy management system for a hybrid smart grid with wind, solar, and batteries. The authors of [3] have planned the best place for an energy management system. The authors of [4] suggest an unique MPPT method for a PV system under partial shade situations. The authors of [5] investigated the control strategy of a PV-battery powered standalone system. The authors of [6] presented a self-contained system powered by PV and wind for a more sustainable future. The authors of [7] implemented a control scheme for regulating the voltage of a standalone PV-Wind system. The authors of [8] proposed a TS-Fuzzy
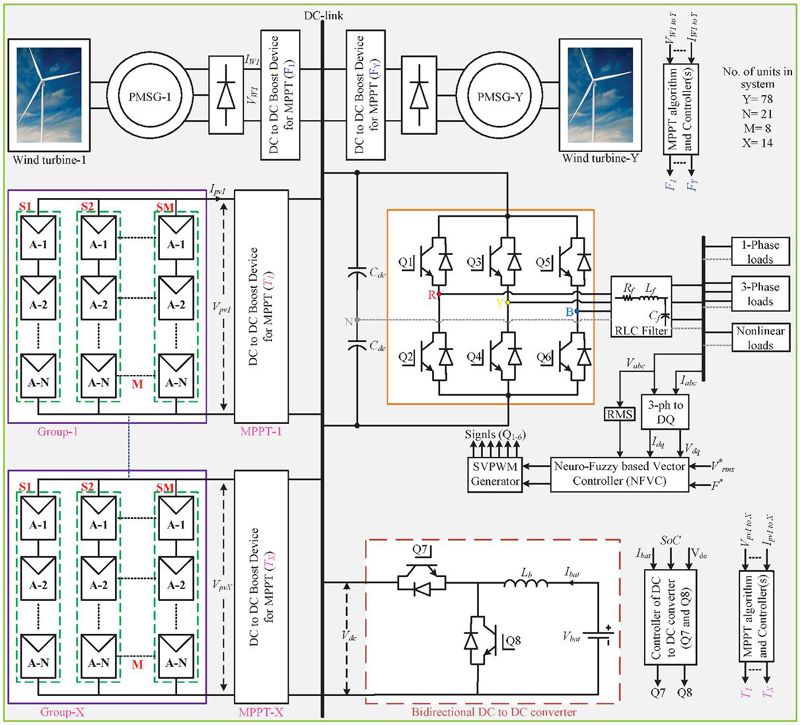
Figure 1 Wind-PV-Battery operated hybrid standalone microgrid.
based controller for a hybrid PV-Diesel-Battery system, but there is a diesel generator that is harmful to the environment. Authors [13] propose a double loop PI controller-based control scheme for a standalone microgrid’s DC to DC converter. The authors present a comparative study on nonlinear controllers in PV-based standalone systems in [14]. However, the authors listed above do not take into account multiple power units and control schemes with Neuro-Fuzzy controllers. Nonlinear loads, in general, will always be operated at PCC due to charges and other electronic equipment operated by consumers. These nonlinear loads have the potential to introduce harmonics into other sensitive loads. As a result, active power filter [5] controllers are required, as well as a DSTATCOM type controller to compensate for the reactive power consumed at PCC [16]. However, these nonlinear and unbalanced loads can cause second frequency voltage oscillations at the dc-link. These oscillations will generate heat across the PV module terminals while also causing damage to the shaft by shortening the fatigue life of the PMSGs. As a result, novel control schemes that are both effective and novel are required to suppress these oscillations and improve power quality at PCC. The proposed inverter control forces it to function as an active power filter as well as a DSTACOM.
3 Control Schemes of DC-Link Voltage and Inverter
There is no guarantee that all PV groups will receive the same irradiance, and all wind turbines will not operate at the same wind speed. As a result, individual MPPT converters, such as boost converters, are connected to them to inject current into the dc-link by regulating their duty cycles. The bidirectional DC to DC converter, on the other hand, regulates the voltage at the dc-link by managing the charging and discarding current of the battery bank in response to the power mismatch between the generation and the load. The detailed procedure for selecting battery bank ratings is provided in the appendix. As a result, the DC to DC converter’s control scheme is designed by comparing the dc-link voltage to its reference value. The lower dc-link voltage to its reference reflected a lack of generation over the load, so the battery must be discharged via switch (Q8). Similarly, higher dc-link voltage than reference value indicates surplus power (i.e., generation exceeds load), so battery should be charged via switch (Q7). Because PI controllers have fixed gains, a fuzzy controller can produce accurate output faster than a PI controller during transients. A Neuro-Fuzzy system is also more efficient than a traditional fuzzy system. In proposed control schemes, the Neuro-Takagi-Sugeno-Kang fuzzy (NTSKF) controller is developed to replace PI controllers. Figure 2 depicts the generalized block diagram of the TSKF controller. The controller accepts two inputs: error and changing error.
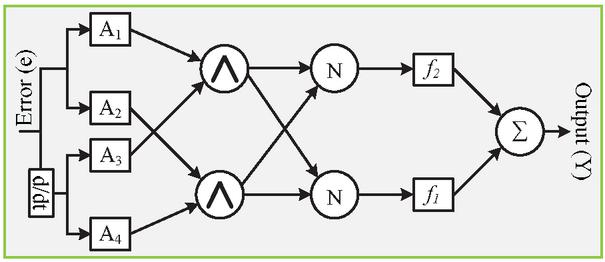
Figure 2 Sketch of a NTSKF control system.
The ‘2’ oscillations are imposing voltage at the dc-link due to an unbalanced and nonlinear load at PCC. These oscillations can generate heat at the PV system terminals, reducing the power generation capability. Furthermore, these ‘2’ oscillations cause a shaking effect on the PMSG shaft, reducing fatigue life by causing crakes on it. As a result, a path should be created to circulate these oscillations so that they do not enter the PV or PMSG side. As a result, the proposed control scheme for the DC to DC converter is designed in such a way that those oscillations are circulated through the battery and converter. Creating this alternate path for ‘2’ oscillations can help charge the battery while also suppressing PV and wind generation. The proposed control scheme of the bidirectional DC to DC converter based on the NTSKF controller is shown in Figure 3.
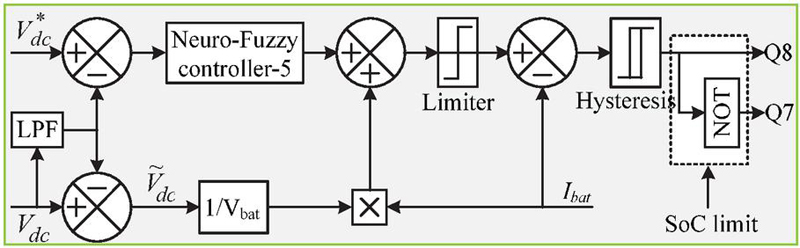
Figure 3 Proposed control scheme of the bidirectional converter.
The variations in voltage at the dc-link represent the power mismatch between load and total generation (from all wind and PV). As a result, the converter’s control scheme is designed by comparing the dc-link voltage to its reference value. If the generation exceeds the load, the battery can charge; otherwise, it will discharge into the load to achieve power balance in the standalone system. The error signal between the dc-link voltage and its reference value is sent to the NTSKF controller, which generates the battery bank’s required reference current. To bypass ‘2’ oscillations, imposed oscillations obtained with a low pass filter (LPF) are converted into the required oscillating component of battery current and added to reference battery current. A limiter is used to limit the current of a battery to prevent overcharging and discharging. The limiter output is treated as the battery’s final reference current, and it is compared to the actual battery current to generate the required pulses for the bidirectional DC to DC converter via a hysteresis loop. As a result, the control can force the converter to circulate the existing ‘2’ oscillations between the battery and the converter. Furthermore, the battery’s state of charge (SOC) is taken into account in the control to keep charging and discharging within permissible limits.
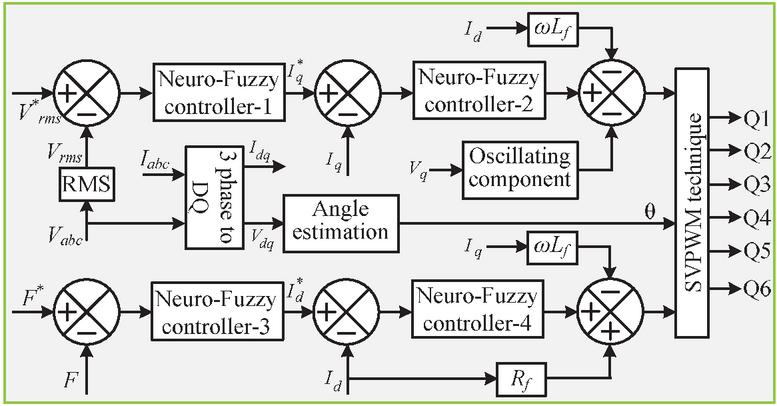
Figure 4 NTSKF controllers based proposed inverter control.
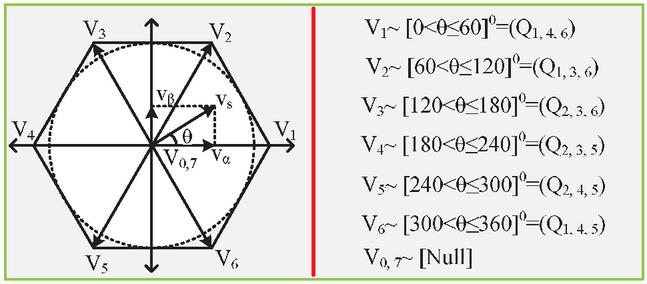
Figure 5 SVPWM technique.
A proper inverter control scheme is required to produce AC at PCC [17, 18]. A stabilised voltage at the dc-link can assist in producing the required AC voltage at the PCC via the inverter by generating modulation indexes with the proposed control scheme. Figure 4 depicts the detailed proposed control of an inverter using NTSKF controllers. In standalone power supply systems, both voltage and frequency at PCC are critical. Changes in frequency reflect the required active power, and changes in reactive power cause changes in RMS voltage at the PCC. As a result, NTSKF controllers generate the reference components of direct and quadrature axis currents by comparing frequency and voltage at their respective reference values. The decoupling components are also added by including the filter parameters. The drop due to filter resistance is also added to the direct axis reference component only. This can assist in overcoming the drop across the filter/line resistance regardless of load current (s). The space vector pulse width modulation (SVPWM) technique, as shown in Figure 5, is used to generate the inverter’s required pulses.
4 Results and Discussions
The results presented in this section were obtained by employing real-time simulator (RTS) modules. The RTS is a digital simulator that is used to solve power system equations quickly enough to simulate real-time conditions [1]. However, because the entire model will run on the same processor, a single RTS module cannot make the system more realistic. As a result, two modules are used to create an HIL by connecting them in a loop, one for the plant and the other for the control scheme. Both the plant and control models are implemented on units 1 and 2. To create a closed loop, the analogue signals from the plant are connected to the control unit, and the digital signals from the control unit are connected to the plant unit/module. Extensive results are collected from another computer for better visual presentation. Figure 6 depicts the HIL model setup using two OPAL-RT-4510 units. The standalone system depicted in Figure 1 is divided into control and plant units, with the corresponding block diagram of an HIL lab setup depicted in Figure 7 with proper color coding.
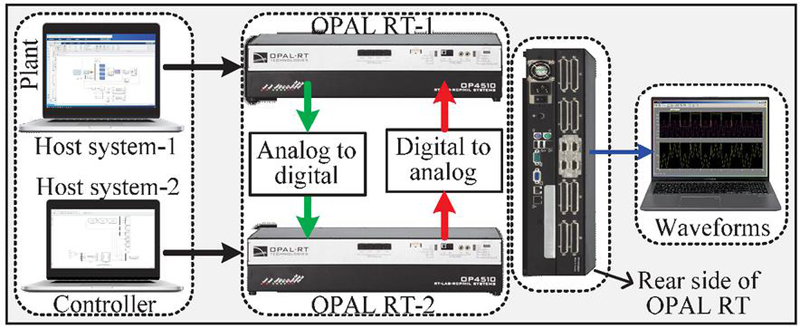
Figure 6 Model setup of HIL configuration.
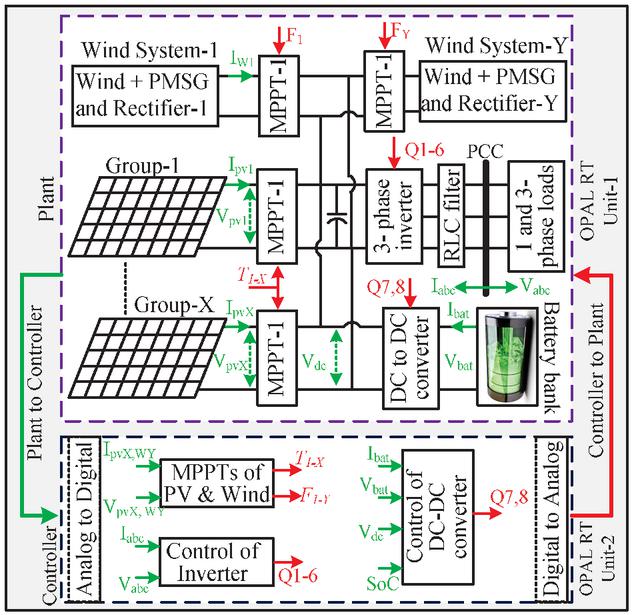
Figure 7 Lab setup of HIL of standalone system.
Case-1: performance under only operation of PV and load Because all PV groups cannot receive the same irradiance, the total PV power is obtained by adding all PV powers. Figure 8(a) depicts the changes considered in this case for variations in irradiance and load at PCC. Under these rapid changes in both PV and load, the battery acts quickly to make the power balance in the standalone system with the help of the battery’s DC to DC converter by effectively charging and discharging. The positive sign of battery power indicates discharging, while the negative sign indicates charging. The corresponding voltage at the dc-link is shown in Figure 8(b). the voltage has a significant dip and rise during sudden changes in load, but these changes are very nominal when compared to the nominal value (i.e., 720.0 V). However, as shown in Figure 8, constant three phase RMS voltages at PCC are critical (c). These power quality responses are obtained as a result of proposed control schemes based on TSKF controllers, which are capable of acting very quickly during changes in the standalone system. The response of the proposed control schemes is usually determined by observing the instantaneous waveform. As a result, the instantaneous waveforms of three phase currents drawn at PCC are depicted in Figure 9.

Figure 8 (a) Various powers, (b) Voltage at dc-link, (c) RMS voltage at PCC.
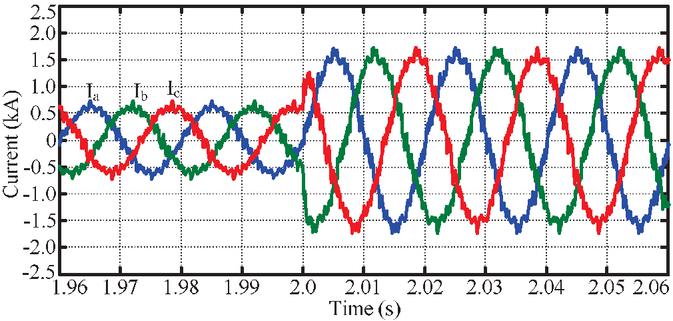
Figure 9 Instantaneous changes in currents.

Figure 10 (a) three phase unbalanced load, (b) balanced RMS voltage.
Case-2: Responses under unbalanced load drawn at PCC In a standalone system, the presence of single phase loads prevents all three phases from drawing the same current, resulting in an imbalanced load condition. Figure 10 shows the unbalanced load condition that was taken into account in this case study. Since there is no change in one phase current, the worst profile of an unbalanced load state was taken into consideration to analyse system performance. Voltages at the PCC become uneven during this process as a result of unequal dips that happened across the filter for the three phases. By generating various modulation indices for the three legs, the proposed control of the inverter can maintain balanced voltage at PCC during this unbalanced condition. Figure 10 displays the planned control of the inverter’s corresponding three phase RMS voltages (b). However, there is a slight variation in voltage that occurs when currents suddenly fluctuate and balance out (230V in steady state). Moreover, the voltages across the generators will be subject to second frequency fluctuations. By establishing a bypass path through a bidirectional converter, the proposed control method for the battery bank can be removed. The acquired responses of this voltage with and without the suggested control method are shown in Figure 11 for the MPPT of PV group-1, which is operated at voltage level (i.e., 636.3V). By using the suggested control, the second frequency component of the voltage has been abolished, which is shown in Figure 11. The same kind of response is seen in all PMSG units.

Figure 11 Second frequency oscillations in voltage.
Case-3: MPPT Performance of wind Generator under change in speed A single PMSG-based wind turbine is taken into consideration in this case for the evolution of the MPPT tracking response under change in wind speed from 12 to 7.0 m/s at t 5.0 sec. as shown in Figure 12. The standalone system consists of multiple wind turbines (a). Figure 12 displays the wind turbine’s mechanical and reference torque response (b). By looking at Figure 12(b), the wind turbine’s MPPT indicates that it is producing its maximum amount of electricity [3, 16].
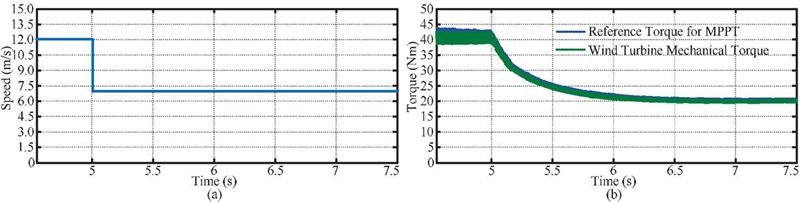
Figure 12 (a) Change in wind speed, (b) response of MPPT.
Case-4: Response of standalone system with the operation of only wind energy Many times the sunlight will not be available like night time and some times during day due to clouds. Under such circumstances, the power generation will be possible with only PMSG based wind turbines. However, the battery bank can maintain power balance between load and generation. Made the solar irradiance zero from 150 W/m at t 2.0 sec and considered constant wind speed (i.e. 12 m/s) to perform this case study. The load is kept at constant (i.e. 250 kW) throughout the process. As a result, the battery begins by charging and then begins to discharge at time t 2.0 sec because there isn’t enough generation to handle the load. Figure 13 illustrates the several abilities engaged in this procedure (a). Figures 13(b) and 13(c) illustrate the corresponding voltage at the battery bank’s dc-link and SoC, respectively.
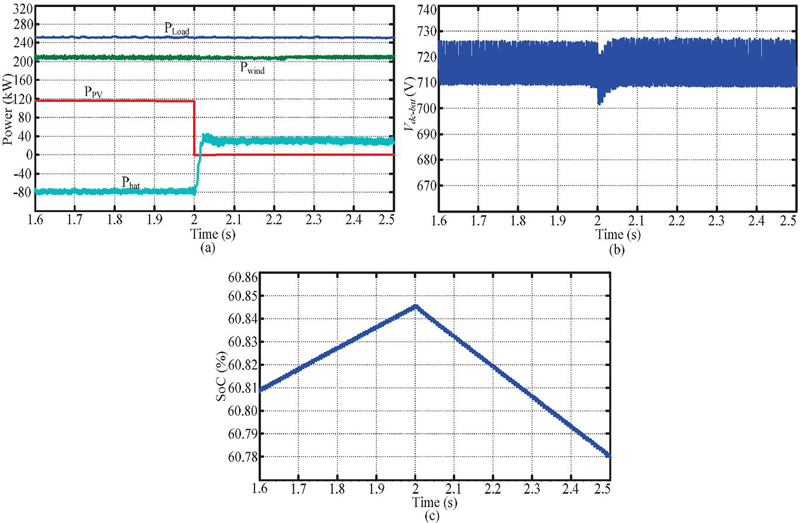
Figure 13 (a) Various powers, (b) voltage at dc-link, and (c) SoC of the battery bank.
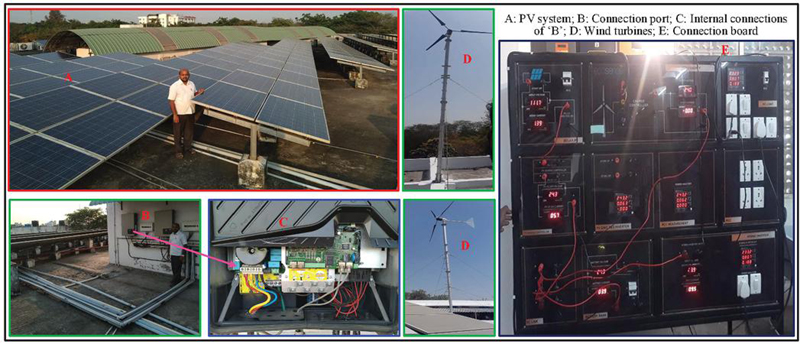
Figure 14 Wind-PV hybrid power supply system on 1st building.
5 Experimental Results
A standalone system is tested using 56 wind turbines, each of which is a 1.5 kW generator, and 0.5 MWh of solar energy. Figure 14 on building-1 depicts the experimental configuration, which consists of PV, wind, battery, and appropriate connections. Similar hybrid systems have been installed on seven different projects, resulting in a daily production of 500 kWh from solar energy and about 80 kW from all wind turbines. Figure 15(a) depicts computer-generated time-sample variations for PV power, and Figure 15(b) illustrates matching features (b). Hence, the battery begins to discharge into load when the combined demand for all buildings’ load hits 1 MW. Figure 16 shows the load’s corresponding powers in relation to total generation. The instantaneous single phase voltage at PCC is depicted in Figure 17 for a clearer understanding of AC voltage. The RMS value is 227.60, and the observed percentage of voltage regulation is 1.49%, which is below the allowable limit. Tables 1 and 2 for solar and wind power generation on various buildings, respectively, provide a list of those buildings.
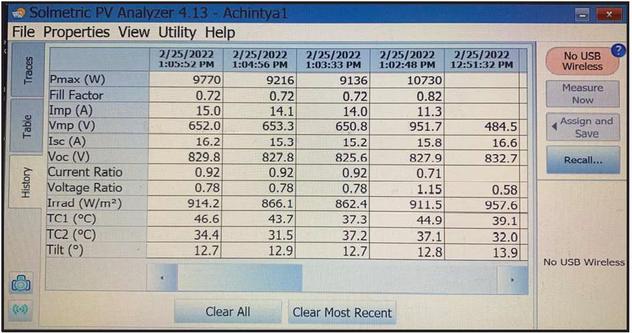
Figure 15(a): A single PV array time to time power generation.
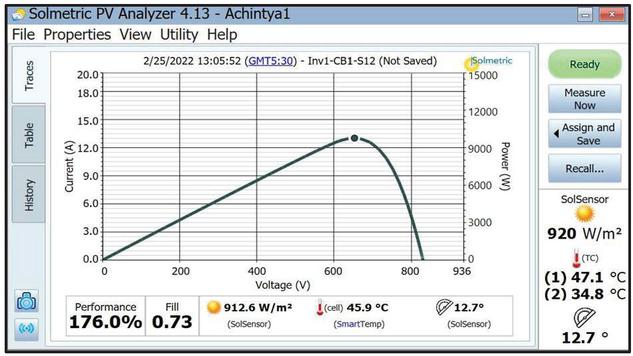
Figure 15(b): PV-characteristic.
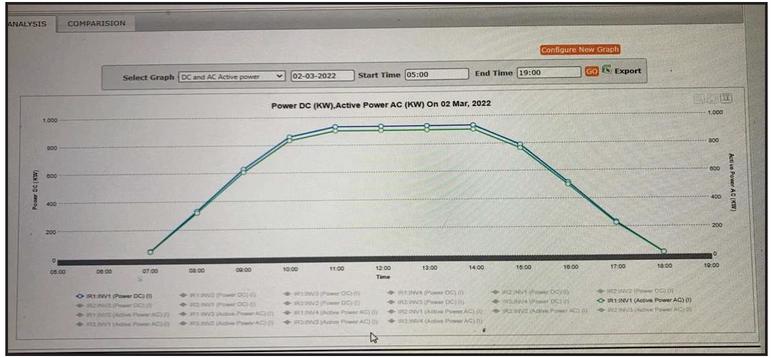
Figure 16 Powers (generation and load).

Figure 17 Full load phase voltage at PCC.
Table 1 Power generation from PV units on different buildings (Computer data)
| Solar PV installation capacity (502.4 kWp) Generation [kWh] | ||||||||
| 2022-Feb | 1-Building | 2-Building | 3-Building | 4-Building | 5-Building | 6-Building | 7-Building | Avg.Total |
| DATE | 100.7 kWp | 100.0 kWp | 100.6 kWp | 50.3 kWp | 50.2 kWp | 50.1 kWp | 50.0 kWp | 502.4 kWp |
| 01-2022 | 446.71 | 245.36 | 465.66 | 213.76 | 106.64 | 232.11 | 110.52 | 1820.76 |
| 02-2022 | 462.55 | 201.16 | 480.90 | 221.56 | 100.57 | 239.69 | 98.63 | 1805.06 |
| 03-2022 | 430.59 | 220.56 | 435.63 | 212.73 | 102.72 | 217.40 | 102.72 | 1722.35 |
| 04-2022 | 402.89 | 200.78 | 403.52 | 201.09 | 99.78 | 201.34 | 100.74 | 1610.14 |
| 05-2022 | 466.84 | 210.63 | 463.20 | 233.67 | 104.52 | 230.52 | 101.45 | 1810.83 |
| 06-2022 | 446.55 | 207.58 | 448.09 | 221.72 | 103.79 | 223.57 | 105.71 | 1757.01 |
| 07-2022 | 481.04 | 205.08 | 485.57 | 237.59 | 102.54 | 242.25 | 102.54 | 1856.61 |
| 08-2022 | 429.84 | 214.62 | 435.27 | 211.32 | 100.1 | 217.13 | 100.1 | 1708.38 |
| 09-2022 | 311.15 | 210.78 | 311.33 | 155.70 | 102.29 | 155.44 | 102.29 | 1348.98 |
| 10-2022 | 481.14 | 211.78 | 480.58 | 240.46 | 105.89 | 239.86 | 107.96 | 1867.67 |
| 11-2022 | 470.18 | 209.78 | 469.10 | 234.88 | 103.82 | 234.10 | 104.85 | 1826.71 |
| 12-2022 | 474.8 | 209.46 | 476.88 | 235.38 | 104.73 | 237.69 | 105.47 | 1844.41 |
| 13-2022 | 345.61 | 206.47 | 336.01 | 177.58 | 102.87 | 167.93 | 100.78 | 1437.25 |
| 14-2022 | 475.23 | 200.78 | 478.98 | 239.09 | 99.45 | 240.23 | 100.25 | 1834.01 |
| 15-2022 | 436.3 | 168.36 | 440.65 | 217.03 | 77.85 | 220.98 | 79.69 | 1640.86 |
| 16-2022 | 419.52 | 175.78 | 420.63 | 208.39 | 86.78 | 210.74 | 88.52 | 1610.36 |
| 17-2022 | 419.03 | 179.12 | 419.29 | 209.24 | 89.56 | 210.17 | 91.25 | 1617.66 |
| 18-2022 | 372.25 | 193.56 | 371.35 | 186.42 | 96.78 | 186.19 | 99.78 | 1506.33 |
| 19-2022 | 446.42 | 200.45 | 443.62 | 224.63 | 94.73 | 222.21 | 95.63 | 1727.69 |
| 20-2022 | 446.55 | 212.58 | 443.81 | 225.25 | 93.65 | 222.35 | 94.25 | 1738.44 |
| 21-2022 | 409.43 | 199.12 | 410.04 | 204.55 | 99.56 | 205.37 | 100.72 | 1628.79 |
| 22-2022 | 414.22 | 209.04 | 413.87 | 208.42 | 104.52 | 207.73 | 105.47 | 1663.27 |
| 23-2022 | 393.79 | 207.36 | 388.76 | 199.35 | 103.68 | 194.80 | 102.26 | 1590 |
| 24-2022 | 448.71 | 205.72 | 450.09 | 224.61 | 102.86 | 225.89 | 103.78 | 1761.66 |
| 25-2022 | 490.69 | 209.78 | 490.47 | 246.08 | 104.89 | 246.02 | 105.14 | 1893.07 |
| 26-2022 | 456.42 | 281.56 | 452.13 | 230.56 | 102.45 | 226.78 | 100.82 | 1850.72 |
| 27-2022 | 522.39 | 274.25 | 519.96 | 262.42 | 101.57 | 260.39 | 110.47 | 2051.45 |
| 28-2022 | 539.35 | 246.96 | 539.57 | 269.33 | 105.72 | 270.36 | 106.78 | 2078.07 |
| Total | 12340.2 | 5918.46 | 12374.96 | 6152.81 | 2804.32 | 6189.23 | 2828.57 | 48608.2 |
| Ave/day | 440.72 | 211.37 | 441.96 | 219.74 | 100.15 | 221.04 | 101.02 | 1736 |
Table 2 Power generation units from wind systems on different buildings (Computer data)
| Wind turbines total (56 wind turbines) Generation [kWh] | ||||||||
| FEB-2022 | Building-1 | Building-2 | Building-3 | Building-4 | Building-5 | Building-6 | Building-7 | Total.kWh |
| DATE | 10 wind | 9 wind | 11 wind | 6 wind | 8 wind | 5 wind | 7 wind | 56 Wind |
| 01-2022 | 148.57 | 129.64 | 172.12 | 83.25 | 131.57 | 72.48 | 94.18 | 831.81 |
| 02-2022 | 141.28 | 132.86 | 172.86 | 90.62 | 128.58 | 69.18 | 98.63 | 834.01 |
| 03-2022 | 144.91 | 131.91 | 152.63 | 102.78 | 117.72 | 67.54 | 102.72 | 820.21 |
| 04-2022 | 141.89 | 143.24 | 143.64 | 91.58 | 127.78 | 71.62 | 90.74 | 810.49 |
| 05-2022 | 149.32 | 132.78 | 163.20 | 83.46 | 124.52 | 70.81 | 111.45 | 835.54 |
| 06-2022 | 152.31 | 131.94 | 148.09 | 91.84 | 123.79 | 73.91 | 95.41 | 817.29 |
| 07-2022 | 132.42 | 131.83 | 165.57 | 76.64 | 112.54 | 72.14 | 92.1 | 783.24 |
| 08-2022 | 136.82 | 129.88 | 135.27 | 79.32 | 130.12 | 67.23 | 112.16 | 790.8 |
| 09-2022 | 144.79 | 131.27 | 171.33 | 85.71 | 129.29 | 65.24 | 112.35 | 839.98 |
| 10-2022 | 154.32 | 127.69 | 180.28 | 84.44 | 126.89 | 69.76 | 107.91 | 851.29 |
| 11-2022 | 129.56 | 132.84 | 169.10 | 92.56 | 127.82 | 64.18 | 94.72 | 810.78 |
| 12-2022 | 136.52 | 138.12 | 176.88 | 94.81 | 129.73 | 57.47 | 95.43 | 828.96 |
| 13-2022 | 129.87 | 127.11 | 156.01 | 91.17 | 129.87 | 57.34 | 90.58 | 781.95 |
| 14-2022 | 141.11 | 138.21 | 178.98 | 78.09 | 118.45 | 60.21 | 102.52 | 817.57 |
| 15-2022 | 142.45 | 137.94 | 140.65 | 85.41 | 117.15 | 60.14 | 99.19 | 782.93 |
| 16-2022 | 149.20 | 135.55 | 148.63 | 87.39 | 124.92 | 70.18 | 98.52 | 814.39 |
| 17-2022 | 132.51 | 136.46 | 149.29 | 81.32 | 119.68 | 61.24 | 101.95 | 782.45 |
| 18-2022 | 139.23 | 136.78 | 171.35 | 77.47 | 126.24 | 66.29 | 99.78 | 817.14 |
| 19-2022 | 150.21 | 138.92 | 143.62 | 84.56 | 124.47 | 62.46 | 92.82 | 797.06 |
| 20-2022 | 151.42 | 140.13 | 143.81 | 85.86 | 130.62 | 62.35 | 94.29 | 808.48 |
| 21-2022 | 142.86 | 139.25 | 150.04 | 74.58 | 119.78 | 65.36 | 104.71 | 796.58 |
| 22-2022 | 132.86 | 142.54 | 153.87 | 78.24 | 124.92 | 67.73 | 101.75 | 801.91 |
| 23-2022 | 141.08 | 140.89 | 158.76 | 89.15 | 131.42 | 64.27 | 103.96 | 829.53 |
| 24-2022 | 147.56 | 134.34 | 150.09 | 84.17 | 128.59 | 65.63 | 103.93 | 814.31 |
| 25-2022 | 145.32 | 134.98 | 170.47 | 86.28 | 124.19 | 69.85 | 115.65 | 846.74 |
| 26-2022 | 145.98 | 133.76 | 152.13 | 80.14 | 129.45 | 61.95 | 90.92 | 794.33 |
| 27-2022 | 151.24 | 142.59 | 159.96 | 72.39 | 111.54 | 70.48 | 99.73 | 807.93 |
| 28-2022 | 152.11 | 142.94 | 169.57 | 79.34 | 109.22 | 70.56 | 96.18 | 819.92 |
| Total | 4007.72 | 3796.39 | 4448.2 | 2372.57 | 3480.86 | 1857.6 | 2804.28 | 22767.62 |
| Ave/ day | 143.133 | 135.585 | 158.864 | 84.735 | 124.316 | 66.343 | 100.153 | 813.129 |
6 Conclusions
In a 1 MW hybrid Wind-PV-Battery power supply standalone system, new control techniques based on Neuro-Takagi-Sugeno-Kang fuzzy controllers are presented for the inverter and bidirectional DC to DC converter of the battery. With the aid of OPAL-RT modules, the standalone system configuration is created to increase the realism of HIL-based results. In this study, a 1 MW power generation system is established using several PV panels and wind turbines. The bidirectional DC to DC converter’s linked battery bank’s control mechanism is used to achieve the system’s power balance. During unbalanced load scenarios, the proposed inverter control can maintain constant RMS voltages at PCC. Furthermore, the proposed control removes second frequency oscillations from the dc-link voltage. As a result, the proposed method can help to reduce heat across PV systems while also increasing the fatigue life of all wind turbine shafts. The proposed control schemes improve the significant power quality. This paper includes extensive HIL and experimental results to validate the proposed method in a variety of scenarios.
Appendix
Table 3 Parameters of a 1MW PV generation
| Single module (215 W) | ||
| S.No | Parameter | Value |
| 1 | Current when short circuit | 8.01A |
| 2 | Open-circuit voltage | 36.9V |
| 3 | Voltage corresponding to MPP | 30.3V |
| 4 | Current corresponding to MPP | 7.10A |
| Series and parallel combinations for 1MW | ||
| 5 | ‘N’ in String (number of modules) | 21 |
| 6 | ‘M’ in Group (number of strings) | 8 |
| 7 | ‘X’ in PV System (number of groups) | 14 |
Parameters of Battery Bank
The capacity of the battery bank is determined based on voltage as well as number hours for supplying power to loads when there is no power from generation units. In this paper, considered 480V of a battery bank and designed for backup of 72 hrs at 0.5 MW load. The required current rating (Ah) is calculated by below equation at 0.6 SoC (60%).
Table 4 parameters of battery bank
| 480V, 125 kAh rating battery bank | ||
| S.No | Parameter | Value |
| 1 | Voltage rating of Single battery | 48.0V |
| 2 | Current rating of single battery | 125A |
| 3 | Number of batteries connected in series (string) | 10 |
| 4 | Number of parallel strings | 1000 |
Table 5 Parameters of the wind turbine, two mass drive train and PMSG [3, 26]
| Parameter | Value |
| 4.0 s | |
| 0.10 Ht | |
| K | 0.30 p.u per el.rad |
| 0.7 p.u.s/el.rad | |
| Density of air | 1.255 Kg/m |
| Area swept by blades | 1.06 m |
| Optimum coefficient | 1.678 10 Nm/(rad/s) |
| Wind speed Base | 12.0 m/s |
| Number of pair of poles | 5 |
| Rated rotational speed | 153.0 rad/s |
| Armature resistance per phase () | 0.425 |
| Stator inductance () | 8.4 mH |
| Flux linkage | 0.433 Wb |
| Rated armature current | 12.0 A |
| Rated developed torque | 9.8 Nm |
| Rated output power | 1.5 kW |
References
[1] Siva Ganesh Malla, et al., “Coordinated Power Management and Control of Renewable Energy Sources based Smart Grid”, International Journal of Emerging Electric Power Systems, early access, https://doi.org/10.1515/ijeeps-2021-0113.
[2] A. Dash, et al., “DC-Offset Compensation for Three-Phase Grid-Tied SPV-DSTATCOM Under Partial Shading Condition With Improved PR Controller,” IEEE Access, vol. 9, 2021, doi: 10.1109/ACCESS.2021.3115122.
[3] H. U. R. Habib et al., “Optimal Planning and EMS Design of PV Based Standalone Rural Microgrids”, IEEE Access, vol. 9, 2021, doi: 10.1109/ACCESS.2021.3060031.
[4] C. Pradhan, et al., “Coordinated Power Management and Control of Standalone PV-Hybrid System With Modified IWO-Based MPPT”, IEEE Systems Journal, vol. 15, no. 3, pp. 3585–96, Sept. 2021, doi: 10.1109/JSYST.2020.3020275.
[5] D. Bhule, S. Jain and S. Ghosh, “Control Strategy for Photovoltaic-Battery Based Standalone System”, IEEE First International Conference on Smart Technologies for Power, Energy and Control (STPEC), 2020, pp. 1–6, doi: 10.1109/STPEC49749.2020.9297685.
[6] H. U. Rahman Habib, S. Wang and M. T. Aziz, “PV-Wind-Battery Based Standalone Microgrid System with MPPT for Green and Sustainable Future,” 2019 9th International Conference on Power and Energy Systems (ICPES), 2019, pp. 1–6, doi: 10.1109/ICPES47639.2019.9105395.
[7] S.G. Malla, C.N. Bhende, “Voltage control of stand-alone wind and solar energy system”, International Journal of Electrical Power & Energy Systems, Volume 56, 2014, Pages 361–373, https://doi.org/10.1016/j.ijepes.2013.11.030.
[8] S.G. Malla, C.N. Bhende, “Enhanced operation of stand-alone “Photovoltaic-Diesel Generator-Battery” system”, Electric Power Systems Research, Volume 107, Pages 250–257, 2014, https://doi.org/10.1016/j.epsr.2013.10.009.
[9] Jorge Cervantes, et al., “Takagi-Sugeno Dynamic Neuro-Fuzzy Controller of Uncertain Nonlinear Systems, IEEE Transactions on Fuzzy Systems”, Vol. 11, No. 4, Dec 2012, doi: 10.1109/TFUZZ.2016.2612697.
[10] Mariana Landína, R.C. Roweb, P. Yorkb, “Advantages of Neurofuzzy Logic Against Conventional Experimental Design and Statistical Analysis in Studying and Developing Direct Compression Formulations”, European Journal of Pharmaceutical Sciences, Vol. 38, pp. 325–331, 2009, doi: 10.1016/j.ejps.2009.08.004.
[11] U. R. Muduli, et al., “Cell Balancing of Li-ion Battery Pack with Adaptive Generalised Extended State Observers for Electric Vehicle Applications”, IEEE Energy Conversion Congress and Exposition (ECCE), 2021, pp. 143–147, doi: 10.1109/ECCE47101.2021.9595601.
[12] U. R. Muduli, et al., “Predictive Battery SoC Control for Dual Propulsion Differential Four Wheel Drive Electric Vehicle”, IEEE Energy Conversion Congress and Exposition (ECCE), 2021, pp. 1490–95, doi: 10.1109/ECCE47101.2021.9595587.
[13] R. D. Bhagiya and R. M. Patel, “PWM based Double loop PI Control of a Bidirectional DC-DC Converter in a Standalone PV/Battery DC Power System”, IEEE 16th India Council International Conference (INDICON), 2019, pp. 1–4, doi: 10.1109/INDICON47234.2019.9028974.
[14] Manisha, M. M. Masoom and N. Kumar, “Comparative Study of Nonlinear Controllers for Standalone PV System”, Second International Conference on Electronics and Sustainable Communication Systems (ICESC), 2021, pp. 25–31, doi: 10.1109/ICESC51422.2021.9532701.
[15] U. R. Muduli and K. Ragavan, “Dynamic modeling and control of shunt active power filter,” 2014 Eighteenth National Power Systems Conference (NPSC), 2014, pp. 1–6, doi: 10.1109/NPSC.2014.7103893.
[16] A. Dash, et al., “Performance Evaluation of Three-Phase Grid-tied SPV-DSTATCOM with DC-offset Compensation Under Dynamic Load Condition”, IEEE Access, doi: 10.1109/ACCESS.2021.3132549.
[17] V. Narayanan, S. Kewat and B. Singh, “Solar PV-BES Based Microgrid System With Multifunctional VSC”, IEEE Transactions on Industry Applications, Vol. 56, no. 3, pp. 2957–2967, May–June 2020, doi: 10.1109/TIA.2020.2979151.
[18] X. Song, Y. Zhao, J. Zhou and Z. Weng, “Reliability Varying Characteristics of PV-ESS-Based Standalone Microgrid”, IEEE Access, Vol. 7, pp. 120872–120883, 2019, doi: 10.1109/ACCESS.2019.2937623.
[19] Y. He, M. Wang and Z. Xu, “Coordinative Low-Voltage-Ride-Through Control for the Wind-Photovoltaic Hybrid Generation System”, IEEE Journal of Emerging and Selected Topics in Power Electronics, Vol. 8, no. 2, pp. 1503–1514, June 2020, doi: 10.1109/JESTPE.2019.2958213.
[20] H. Dong, S. Li, H. Dong, Z. Tian and S. Hillmansen, “Coordinated Scheduling Strategy for Distributed Generation Considering Uncertainties in Smart Grids”, IEEE Access, Vol. 8, pp. 86171–86179, 2020, doi: 10.1109/ACCESS.2020.2992342.
[21] A. Imran et al., “Heuristic-Based Programable Controller for Efficient Energy Management Under Renewable Energy Sources and Energy Storage System in Smart Grid”, IEEE Access, Vol. 8, pp. 139587–139608, 2020, doi: 10.1109/ACCESS.2020.3012735.
[22] X. Chang, Y. Xu, W. Gu, H. Sun, M. Chow and Z. Yi, “Accelerated Distributed Hybrid Stochastic/Robust Energy Management of Smart Grids”, IEEE Transactions on Industrial Informatics, 2021 early access, doi: 10.1109/TII.2020.3022412.
[23] M. Xia, H. Shao, X. Ma and C. W. De silva, “A Stacked GRU-RNN-based Approach for Predicting Renewable Energy and Electricity Load for Smart Grid Operation”, IEEE Transactions on Industrial Informatics, 2021 early access, doi: 10.1109/TII.2021.3056867.
[24] Y. M. Alharbi, A. A. A. Alahmadi, N. Ullah, H. Abeida, M. S. Soliman and Y. S. H. Khraisat, “Super Twisting Fractional Order Energy Management Control for a Smart University System Integrated DC Micro-Grid”, IEEE Access, Vol. 8, pp. 128692–128704, 2020, doi: 10.1109/ACCESS.2020.3008858.
[25] G. Dehnavi and H. L. Ginn, “Distributed Load Sharing Among Converters in an Autonomous Microgrid Including PV and Wind Power Units”, IEEE Transactions on Smart Grid, Vol. 10, no. 4, pp. 4289–4298, July 2019, doi: 10.1109/TSG.2018.2856480.
[26] M. E. Haque, M. Negnevitsky, and K. M. Muttaqi, “A novel control strategy for a variable-speed wind turbine with a permanent-magnet synchronous generator,” IEEE Trans. Ind. Appl., Vol. 46, no. 1, pp. 331–339, Jan./Feb. 2010.
[27] S. G. Malla and C. N. Bhende, “Study of Stand-Alone Microgrid under Condition of Faults on Distribution Line”, International Journal of Emerging Electric Power Systems, Issue 5, Vol. 15, 2014.
[28] J. Bélanger, P. Venne, and J. N. Paquin, “The What, Where and Why of Real-Time Simulation; Opal-RT Technologies Inc.: Montreal, QC, Canada”, IEEE PES General Meeting, Vol. 1, pp. 37–49, July 2010.
[29] M. Misaghi, and M. Yaghoobi, “Improved Invasive Weed Optimization Algorithm (IWO) based on Chaos Theory for Optimal Design of PID Controller”, Journal of Computational Design and Engineering, Vol. 6, no. 3, pp. 284–295, July 2019.
Biographies

Karanam Deepak Received the B.Tech degree in Electrical and Electronics Engineering from Prakasam Engineering College, Kandukuru, Prakasam (DT), A.P, India, in 2013. He has completed M.Tech in Power Electronics and Drives from VNR Engineering College, Ponnuru, Guntur (DT), A.P, India. Currently he is pursuing a Ph.D in National Institute of Technology (NIT), Patna, India. In addition, his areas of interest are Power Systems, Electrical machines.

Rajib Kumar Mandal received the Bachelor of Engineering degree from MACT (REC), Bhopal, India, in 1999, the Master of Engineering degree from Jadavpur University, Kolkata, India, in 2004, and the Ph.D. degree from the National Institute of Technology at Patna (NIT), Patna, India, in 2018. He is currently working as an Associate Professor with the Department of Electrical Engineering and Head of the Department, NIT. He has published various international journals and conferences. His current research interests include power systems, renewable energy systems, power electronics converters, and microgrids.

Vimlesh Verma (Senior Member, IEEE) was born in Mumbai, India. He received the B.Tech. degree in electrical and electronics engineering from Andhra University, Visakhapatnam, India, in 2002, the M.Tech degree in power apparatus and systems from Nirma University, Ahmedabad, India, in 2005, and the Ph.D. degree in electrical engineering from the Indian Institute of Technology Kharagpur, Kharagpur, India in 2015. He is currently an Assistant Professor with the Department of Electrical Engineering, National Institute of Technology Patna, Patna, India. His research interests include the sensor less control of ac drives, fault diagnosis, motor drives, power converters, electric vehicles, and renewable energy.
Distributed Generation & Alternative Energy Journal, Vol. 35_4, 1815–1838.
doi: 10.13052/jwe1540-9589.2022
© 2021 River Publishers