Positive Sequence Superimposed Based Islanding Detection Method Used in Distributed Generation
Javeed Bashir1,* and Premalata Jena2
1Department of Electrical Engineering, Islamic University of Science and Technology, Kashmir, India
2Department of Electrical Engineering, Indian Institute of Technology Roorkee, India
E-mail: javeed.bashir@iust.ac.in; premalata.jena@ee.iitr.ac.in
*Corresponding Author
Received 21 February 2022; Accepted 28 July 2022; Publication 03 January 2023
Abstract
This paper presents a passive method based localized islanding detection method for distributed generation (DG) connected to a main grid. The approach in this paper is based on the calculation of the magnitude of positive sequence based superimposed components of current and voltage, and the angle between them at the DG end. These three physical quantities altogether are used to identify the islanding. The prevailing active detection techniques introduce deliberately disturbances into the system which might lead to problems related to power quality, stability, and reliability of the power system. On the contrary, passive methods based islanding detection techniques has the issue of large non-detection zone (NDZ). The proposed technique overcomes the NDZ problem and does not introduce any disturbances. PSCAD/EMTDC is used to simulate the two systems. Various tests are carried out on these systems to access the execution of the proposed method and it was found that the suggested method has least NDZ and can detect the islanding within 10 ms well below the time required by a recloser which is 150 ms.
Keywords: Real power mismatch, micro-grid, distributed generation (DG), rate of change of frequency (ROCOF), positive sequence superimposed component.
1 Introduction
With increased price of fossil fuels, natural gases and environmental issues, existing power network has gone through considerable changes in structure building, operation, regulation and planning. The power network is forced to operate close to its operational margin and utilize the maximum infrastructure, owing to the new restrictions set up by political, economic and environmental concerns. This situation leads to the proliferation of distributed generation systems. It has become necessary to integrate the distributed generation (DG) to the utility as it reduces the line losses, reliance on fossil fuel for energy generation and hence improves the distribution system efficiency and reliability. Along with these advantages it has got certain disadvantages as well. The main problem is the islanding condition [1]. The islanding phenomena occurs when the main utility is interrupted but the DG continues to deliver electricity to the network. [2]. The islanding process may be intentional [3] (due to maintenance outage) or unintentional (due to fault and subsequent switching actions) in nature. Energized islanding network (unintentional islanding) has got certain issues. The main problems are safety hazards; extreme transient stresses when reconnected to the grid, inadequate and uncoordinated grounding, customers, equipments and utility workers may be endangered because of wild behaviour of the voltage and frequency [4]. Current practice dictates that the DG be removed from the main grid as soon as reasonably possible, within 2 seconds according to IEEE Std. 1547.
It is essential to identify the islanding before taking any necessary measure. Islanding detection techniques are classified in three types: (1) active, (2) passive and (3) the methods based on communication. Passive methods observe the different system quantities like impedance, current, voltage, THD, frequency at any preferred point and then compared them with the pre-defined limit to determine islanding. Passive approaches are desirable as they don’t put any influence on normal functioning of the DG system because they employ data that is already accessible at the DG terminals. The Non-detection zone (NDZ) is the primary drawback of this approach. The different passive techniques that have been developed till date are rate of change of frequency (ROCOF) [5], over/under voltage (OVP/UVP) [6, 7], total harmonic distortion present in the current [8, 9], rate of change of power (ROCOP) [10, 11], phase shift method [12] and rate of change of voltage (ROCOV) [13]. Active methods decide about the islanding by intentionally introducing a small amount of perturbation into the system and recording feedback based on the perturbation. The feedback will be negligible in case of the non-islanding condition and hence no changes will be done in the operating conditions. But in case of islanding the system parameters will experience significant change as the main grid is disconnected. The major advantage of these methods is that they have a small NDZ but suffers from the drawback of power quality problems owing to the addition of perturbation to the system. Active islanding approaches include active Frequency Drift [14–17], slip-mode frequency shift [18, 19] voltage shift method [17] and current injection [20–22].
Communication links between different DGs are used as the base to determine the islanding situations in case of islanding detection techniques based on communication [23–28]. This technique has got the highest possible accuracy as it has got negligible NDZs but suffers from the drawbacks of high speed requirement which makes it most expensive. Most of these techniques use phasor measurement units (PMUs). PMUs are used in various applications in finding different power system states and islanding detection can be one of them. A novel local passive islanding detection technique is presented in this paper where the magnitude of the positive sequence superimposed current and voltage and the angle between them [29] at the DG terminal are used to decide about the islanding. Sampling of voltage and current is done at the rate of 1 kHz for all conditions. Least square method [30] is used for phasor estimation of current and voltage. The amplitude of the positive sequence superimposed current and voltage, as well as the phase angle between them, are used to determine the islanding situation. The implementation of given technique is assessed for less than 15% of active power mismatch. The proposed technique performs well even for zero power imbalance. At the DG terminals, the suggested technique’s performance is evaluated for several non-islanding cases like capacitor switching, load switching, balanced, and unbalanced faults etc.
2 The System Studied
Figure 1 shows a 400 kV, 50 Hz system which is used to test the proposed method. 10 MVA is taken as the base power and the system considered is taken as a radial distribution system connected to the main grid, with 4 DG units, through the point of common coupling (PCC). The operating voltage of the grid is 25 kV and the DG units are kept at 20 km away from each other and are separated from each other by transmission lines modelled as pi sections. The components of the selected system are taken from the reference [31] and their description is given in the appendix.
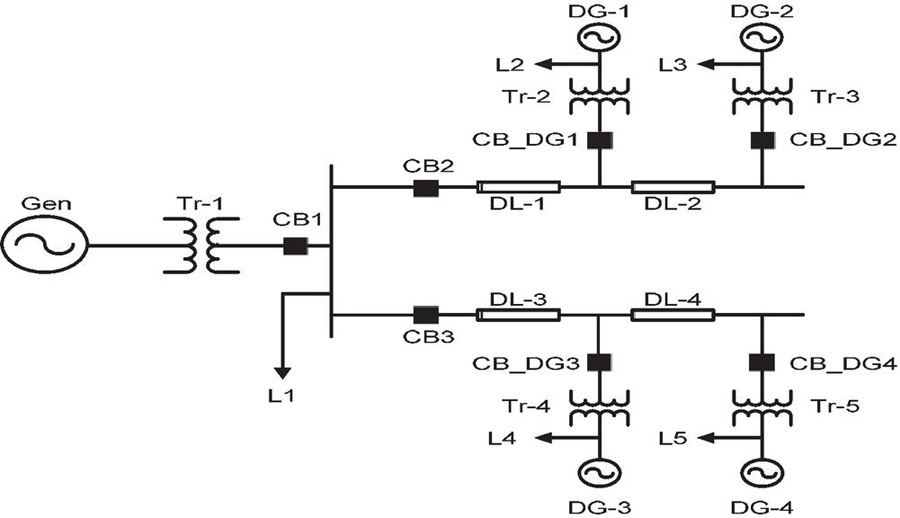
Figure 1 System on which proposed technique is tested.
2.1 Proposed Technique
Amplitude, phase angle and frequency are calculated using phasor estimation method. The proposed technique is based on monitoring the magnitude of positive sequence superimposed voltage and current, and angle between the two before and after the disturbance. Estimation of ROCOF should also be done as the proposed technique has to be compared with ROCOF relays. The proposed method uses the least square method for the estimation of respective phasors. The voltage and current signal can be modelled as [32]:
| (1) |
where, the maximum value of the fundamental component, the fundamental frequency component, rad/s, phase angle of the signal, rad, sampling interval, s. It is assumed that this signal contains a decaying DC component of amplitude and time constant , as this is usually the case of the disturbance; k is the k sample and is the sampling time. Equation (1) is linearized and written as:
| (2) |
where , , and . Similarly , , and . Then Equation (1) can be written as:
| (3) |
where,
| (4) |
and
| (5) |
In Equation (5), N denotes the number of sample points per cycle. The variable vector becomes:
| (6) |
To estimate the unknown variable , fundamental component is obtained using the following equation:
| (7) |
The frequency can be estimated as follows:
| (8) |
where is the phase angle of fundamental component of the voltage and p 0, 1, 2…and finally,
| (9) |
The positive sequence voltage and current from the three phase measured values of voltages and currents can be calculated as follows:
| (10) |
where a is an operator which shifts a phasor by 120 degrees in anti-clockwise direction without changing magnitude. Following the computation of the positive sequence voltage and current phasors, the negative sequence superimposed component of voltage and current is computed as follows [33–37]:
| (11a) | |
| (11b) |
where and are the positive sequence voltages before and after the disturbance or islanding respectively. Similarly and are the positive sequence currents for the same conditions. Finally, the phase angle () between positive sequence superimposed voltage and current is given as:
| (12) |
A sample network shown in Figure 2 is used for simplified mathematical analysis in which a DG is connected to a main grid through a PCC and it supplies some load through this point.
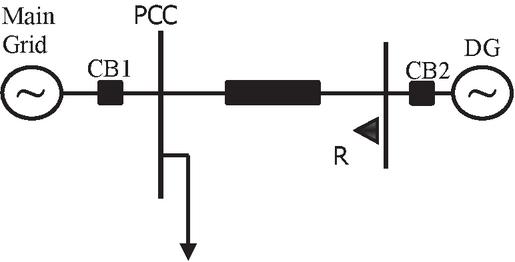
Figure 2 System during normal operation.
The relay R is located at DG bus. The sequence diagram for the system is shown in Figure 3 below:
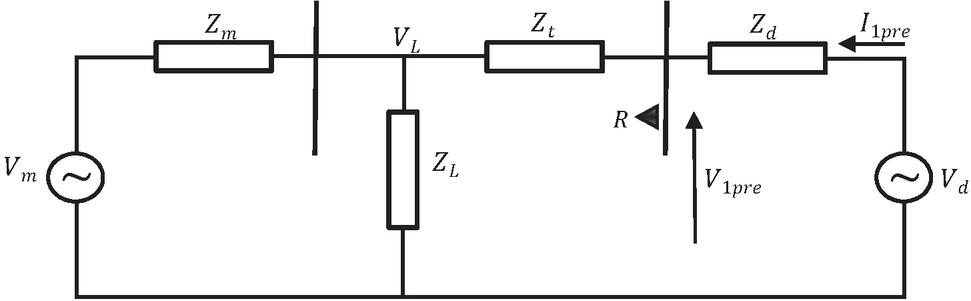
Figure 3 Sequence network during normal operation.
The pre-islanding positive sequence voltage (V) and current (I) can be found by using superposition principal to Figure 3. Individual contributions of the two sources are taken independently as shown in Figures 4 and 5 respectively.
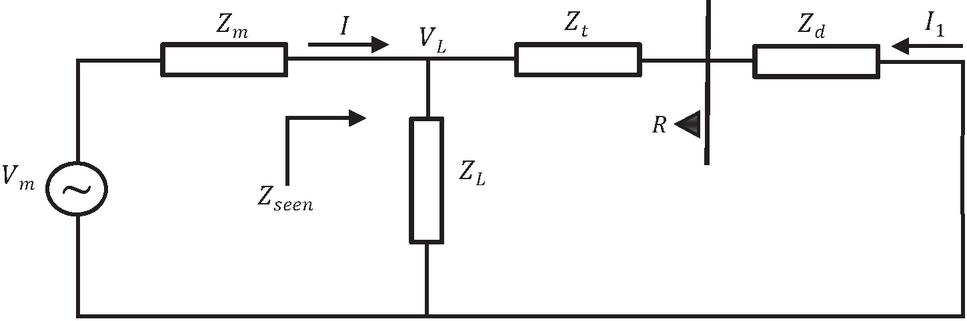
Figure 4 Contribution due to main source.
The contribution of the main source can be calculated as:
| (13) | ||
| (14) | ||
| (15) |
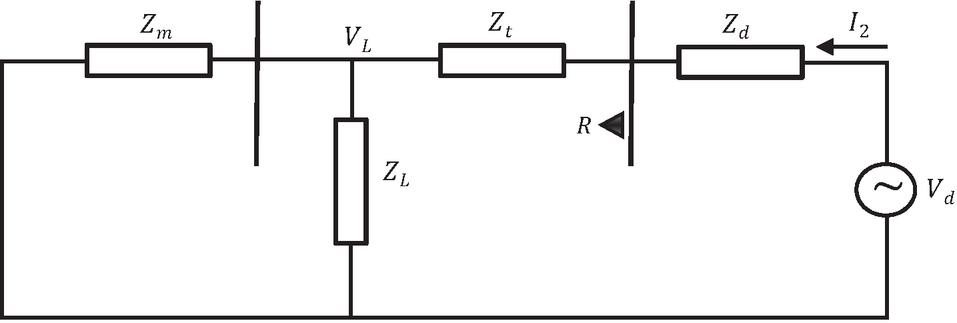
Figure 5 Contribution of DG.
The contribution of the DG is:
| (16) | |
| (17) |
where is the total impedance seen by the DG. The net current supplied by the DG will be the algebraic sum of (15) and (17):
| (18) | |
| (19) |
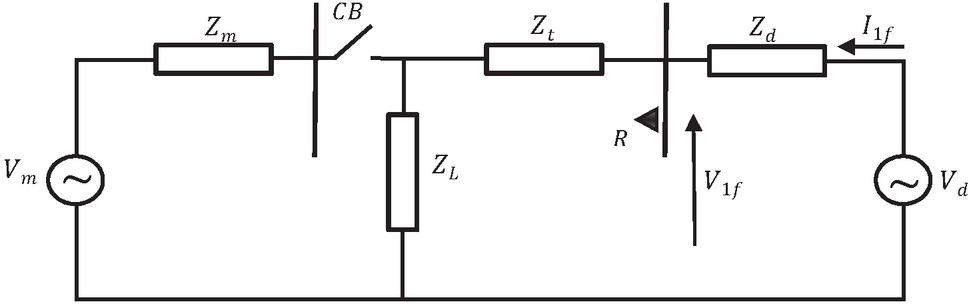
Figure 6 Sequence network during islanding condition.
The post-islanding positive sequence voltage (V1f) and current (I1f) can be found by using Figure 6.
| (20) | ||
| (21) |
The corresponding phasor diagrams for the above systems (before and after the islanding event respectively) is revealed in Figures 7(a), and 7(b) respectively and Figure 7(c) shows it for positive sequence component of current (I) and positive sequence component of voltage (E). Clearly this angle is negative for islanding condition as is seen in Figure 7(c).
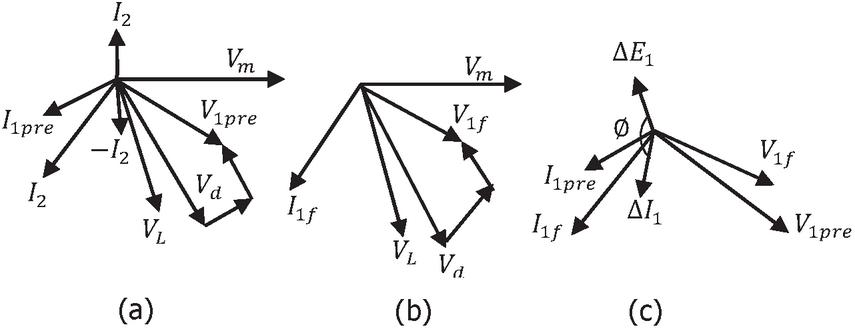
Figure 7 Phasor diagrams during islanding.
3 Results
3.1 ROCOF Method and its Working
The islanding situation will arise from the opening of the primary breaker (CB1) in Figure 1 at t 0.08 s. The first non-islanding condition is created by tripping DG-2 by disconnecting the circuit breaker CB_DG2. The second non-islanding situation is simulated by disconnecting distribution line section-2 (DL-2) with an active power mismatch of 60%. The voltage and current data for the two examples are stored at the DG-1 and DG-3 ends, respectively, and the positive sequence voltage and current phasor values are computed using the one cycle least square approach. The frequency and ROCOF of voltage signal are calculated using (8) and (9) respectively. The performance curve of conventional method (ROCOF) with 60% real power imbalance in islanding condition and first non-islanding case is revealed in Figure 8. Islanding and non-islanding conditions are differentiated from each other by using a suitable threshold. It is found that the variation in ROCOF is not uniform. Furthermore, the value of ROCOF may touch to zero value during the islanding condition in case of zero power imbalance which may create problem in distinguishing the two conditions. Figure 9 shows islanding and non-islanding cases (section-2 cut off) with a real power imbalance of 60%.
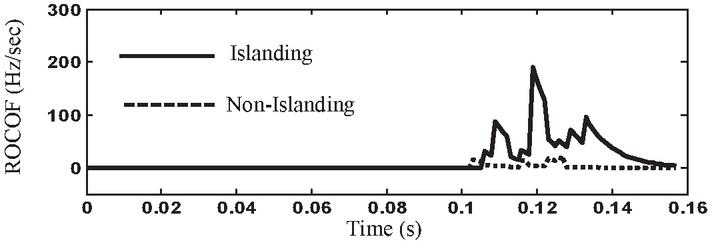
Figure 8 Curves showing performance for ROCOF at DG-1 for islanding and non-islanding (DG-2 tripped) cases with an active power mismatch of 60%.
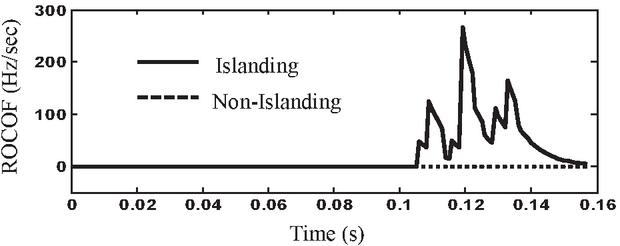
Figure 9 Curves showing performance for ROCOF at DG-3 for islanding and non-islanding (section-2 completely cut off) cases with an active power mismatch of 60%.
Real power imbalance modulates the rate of change of frequency in power system. The capability of the traditional technique (ROCOF) is evaluated for real power difference ranging from 15% to 80%. At higher active power mismatch, the value of ROCOF is higher and with an appropriate threshold it is very easy to differentiate the islanding. For lower active power difference, the magnitude of ROCOF decreases and may be less than the threshold which makes it impossible to distinguish the islanding.
Figure 10 shows it more clearly for the conditions of 15% to 80% real power difference. The islanding for 0% active power mismatch may be unnoticed. The conventional approach (ROCOF) is clearly incapable of detecting islanding, as shown in Figure 11, when the real power imbalance is less than 15%. As the threshold changes with the change in real power mismatch, it is difficult to determine a suitable threshold for islanding detection.
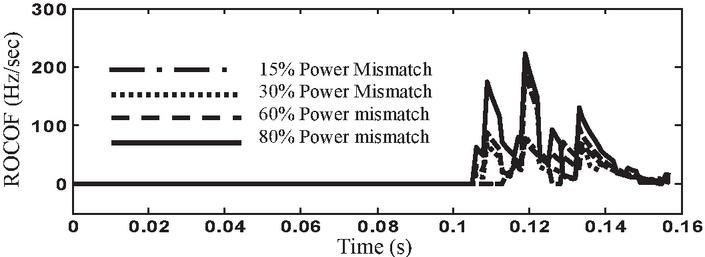
Figure 10 ROCOF at DG-1 for islanding conditions with 15 to 80% active power mismatch.
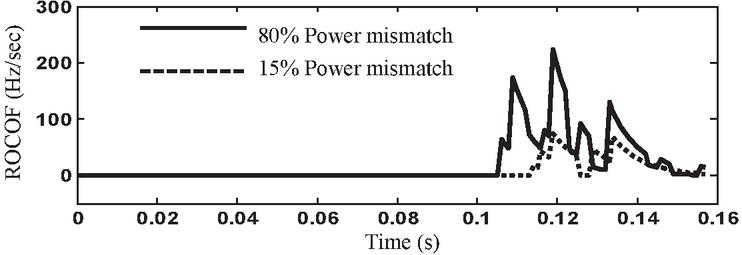
Figure 11 Curves for ROCOF at DG-3 for islanding conditions with 15 and 80% real power difference.
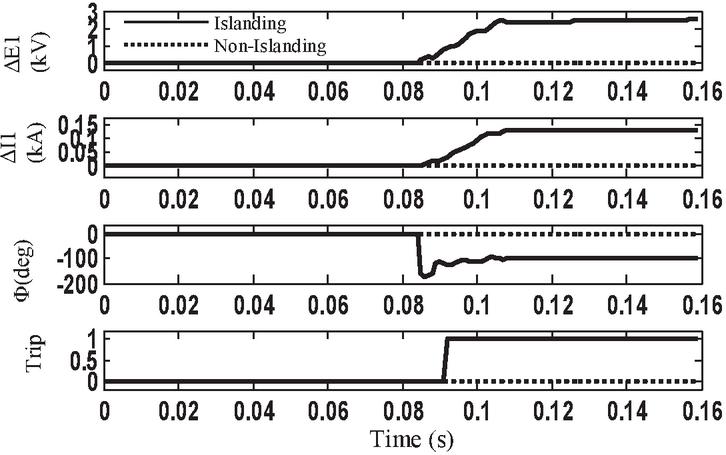
Figure 12 SIC1 at DG-1 with 50% active power mismatch for islanding and non-islanding condition (tripping of DG-2).
3.2 Proposed Technique
In the proposed method, the positive sequence superimposed component of current and voltage are computed along with the phase angle between the two. When islanding situation occurs, the values of positive sequence superimposed current and voltage exceeds to a great extent that of non-islanding condition as shown in Figure 12. Two criteria have been used, the value of and and the angle between the two. If the value of and are greater than the threshold (70V for and 3A for ) and the angle () between the two has negative value, islanding is declared otherwise not. Figure 12 reveals the performance plot of proposed method for islanding and non-islanding (tripping of DG-2) conditions. Both and (in kV and kA respectively) have the prominent values (greater than threshold) so the angle () comes out to be negative in islanding and zero (negligible) in non-islanding. The islanding condition is detected within 8 to 10 ms and the trip signal shows dynamic consistency. Islanding condition is obtained here by simulating the tripping of CB1 in Figure 1 with 50% real power imbalance. Simulation of other non-islanding condition with a 20 % real power imbalance include load switching at the PCC. The working of proposed technique is evaluated and tested at the location of DG-2 end and the corresponding curve is shown in Figure 13. Corresponding angle between and is zero in case of non-islanding condition.
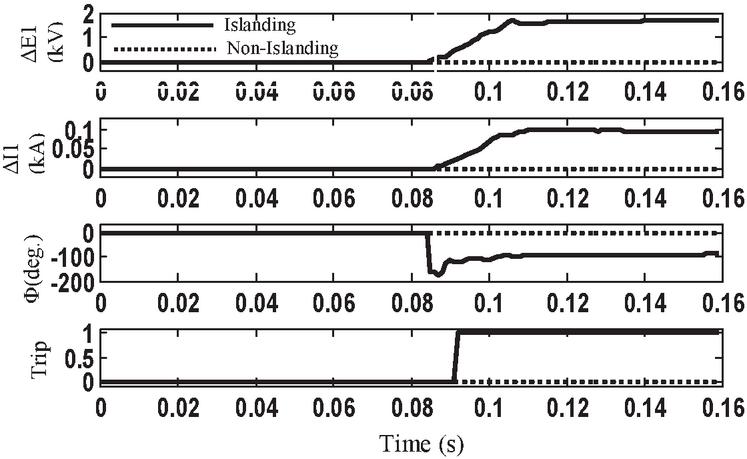
Figure 13 SIC1 at DG-2 with 20% real power imbalance for islanding and non-islanding situation (load change at PCC).
In Figure 14 same conclusion can be made where load switching (non-islanding condition) is done with 5% real power imbalance at DG-2 end. The phase angle between and is zero for non-islanding and non-zero for islanding situations. The load change and the capacitor bank switching are among other critical non-islanding situations which are also checked. Figures 15 and 16 are the important ones as the value of and for non-islanding situations (load changing at DG-3 end and capacitor bank switching at DG-1 respectively) is greater than the threshold, but the magnitude of the phase angle in these cases is positive as is clear from the figures. As a result, distinguishing non-islanding from islanding conditions is simple because in the proposed methodology this angle has to be negative for islanding condition along with the above conditions.
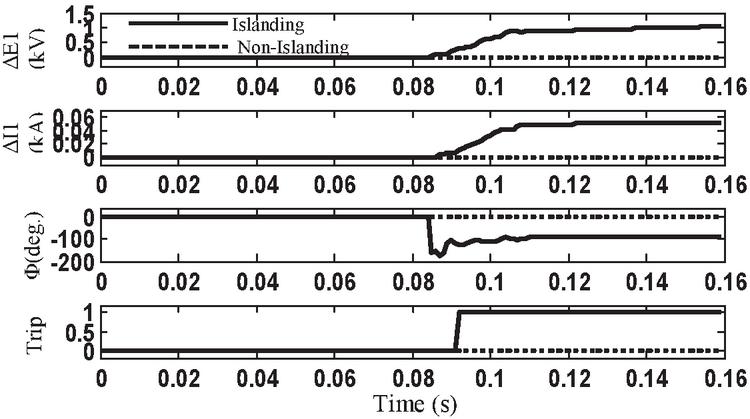
Figure 14 SIC1 at DG-3 with 5% real power imbalance for islanding and non-islanding situation (load switching at DG-2 end).
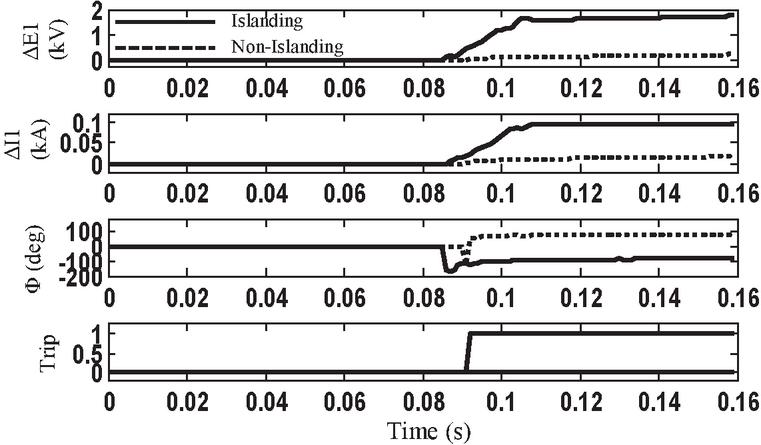
Figure 15 SIC1 at DG-3 with 5% real power difference for islanding and non-islanding condition (load change at DG-3 end).
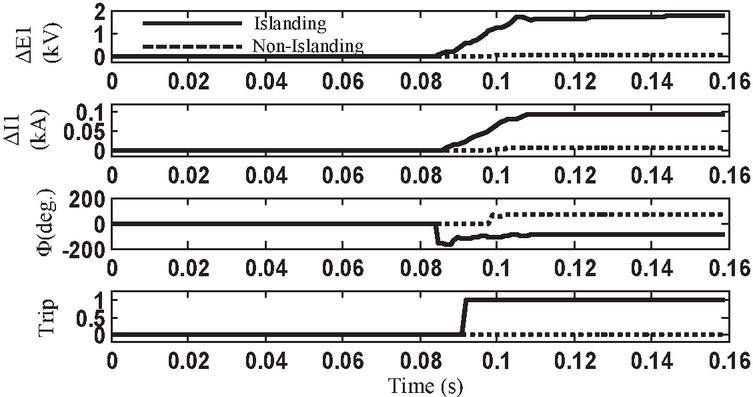
Figure 16 SIC1 at DG-1 with 5% real power imbalance for islanding and non-islanding situation (capacitor bank switching at DG-1 end).
The important point is that there is no need to worry about the value of E_1 and I_1 going beyond the threshold, the angle will take care at that time. The value of E_1 and I_1 is greater than the threshold in these cases because the monitoring and the non-islanding condition take place at the same place. Figure 17 shows how the proposed technique differentiates the islanding from non-islanding condition with 0% active power mismatch (completely cut-off of section-2). To determine the performance of islanding detection relay for any real power imbalance is an important factor. Islanding condition is simulated with 0% and 80% real power imbalance by opening CB1 in Figure 1 at t 0.08 s. Figure 18 reveals the working of given technique at DG-4 terminal with 0 and 80% real power difference.
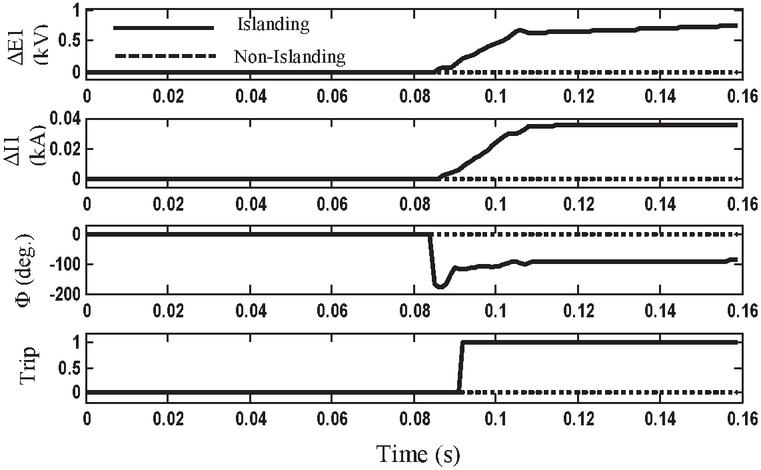
Figure 17 SIC1 at DG-1 with 0% real power imbalance for islanding and non-islanding condition (complete cut-off of section 2).
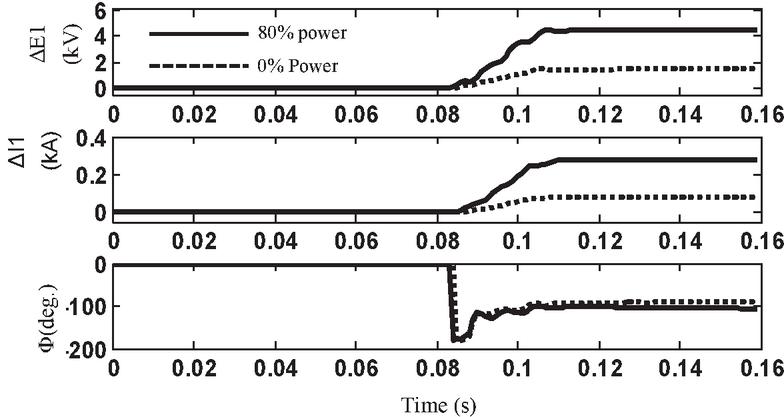
Figure 18 SIC1 at GD-4 for islanding detection with 0 and 80% active power mismatch.
Finally, Figure 19 shows this proposed technique tested for islanding with a real power imbalance of zero to 80%. From the figure it is clear that the angle is always negative for 0 to 80% power mismatch with negligible variation. But it looks like that that the value of and may be less than the threshold for lower active power mismatches and in that case the proposed technique may fail. The value of and for 0% active power mismatch after the delay is 948 V and 45 A respectively, which are well above the threshold. So the chances of failing the technique are negligible as these values will increase when the active power mismatch increases. Table 1 also shows these results in tabular form. Different types of fault cases may create problem in detecting the islanding situation. To check the working of the proposed method for unbalanced faults, ABG fault is simulated at DG-3 end for 0% real power imbalance. Corresponding performance curve is revealed in Figure 20. The graph clearly shows that the technique works successfully in case of unbalanced faults as well.
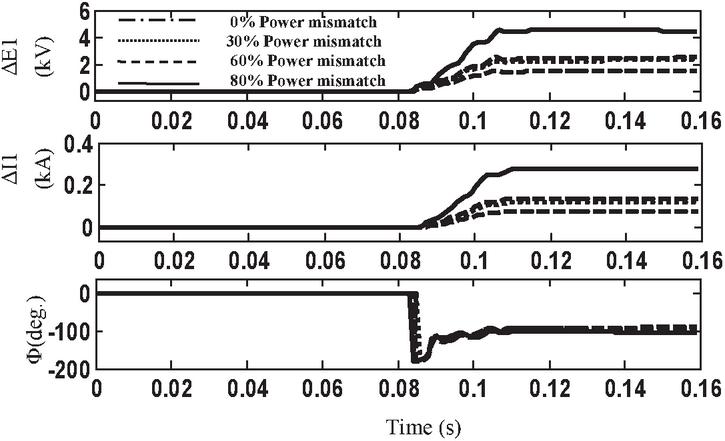
Figure 19 SIC1 at GD-1 with 0 to 80% real power imbalance for islanding detection.
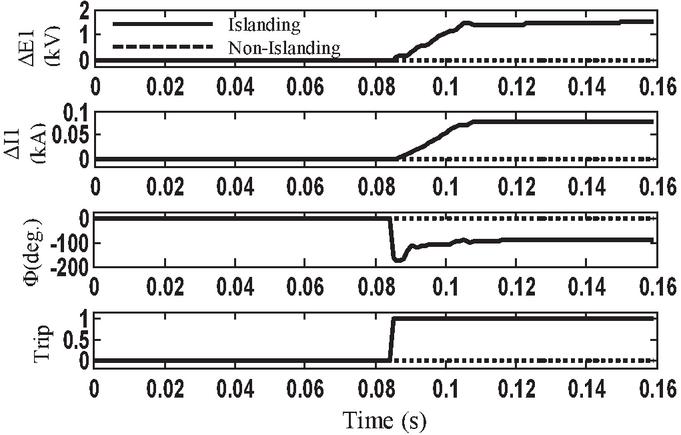
Figure 20 SIC1 at GD-1 with 0% active power imbalance for islanding and ABG fault at DG-3 (non-islanding condition).
Reactive power mismatch is also another concern in distributed generation network. The reactive power mismatch in the distributed network is varied from 0% to 80% and islanding condition is simulated for these situations. Performance plot for the proposed technique is shown in Figure 21 for reactive power imbalance with 0% and 80% at DG2. It is seen that the reactive power imbalance has negligible impact on the proposed technique.
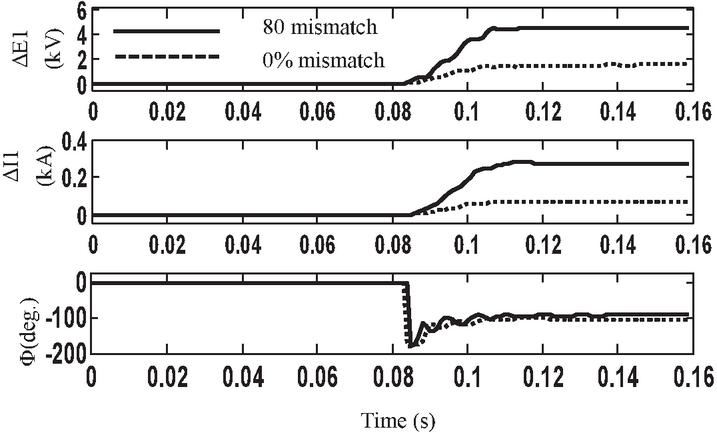
Figure 21 SIC1 at GD-2 with 0% and 80% reactive power imbalance for islanding detection.
3.3 Working of the Given Technique for IEEE-34 Bus System
Realization of the suggested technique in this paper is tested for IEEE-34 bus network as shown in Figure 22. This network has 10 DGs including 6 wind generators (9 MW each) and 4 emergency diesel generators (5 MW each). It has got a total load of 74 MW active power and 10 MVAR reactive power. Figure 23 reveals the performance plot of the given technique, which is tested for islanding and load change at DG-3 end (non-islanding conditions) with 0% real power imbalance. As a result, it is determined that the proposed approach works effectively to detect the islanding condition in IEEE-34 bus system even with 0% active power imbalance.
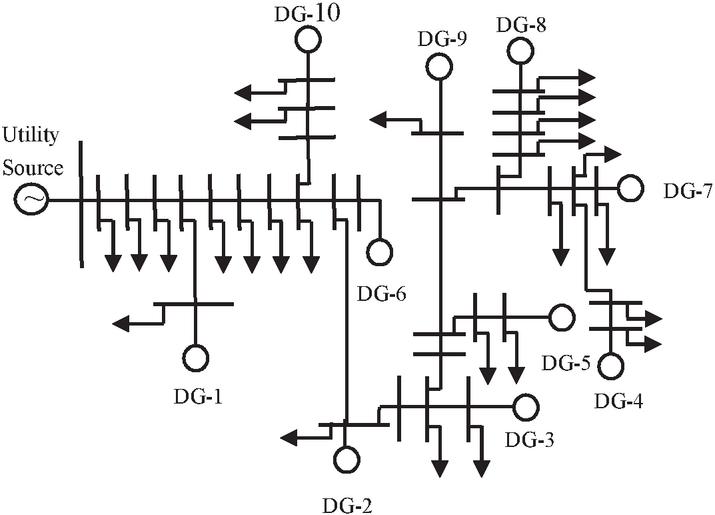
Figure 22 Standard IEEE-34 bus system.
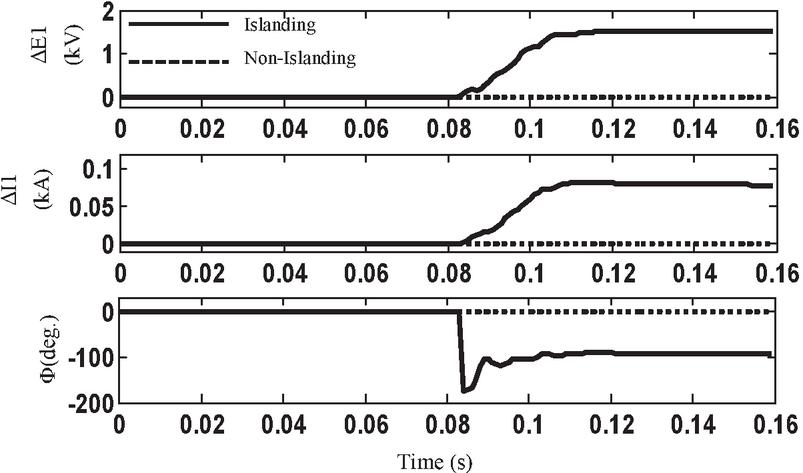
Figure 23 SIC1 at GD-1 with 0% active power imbalance for islanding and load change at DG-3 (non-islanding condition) in IEEE-34 bus network.
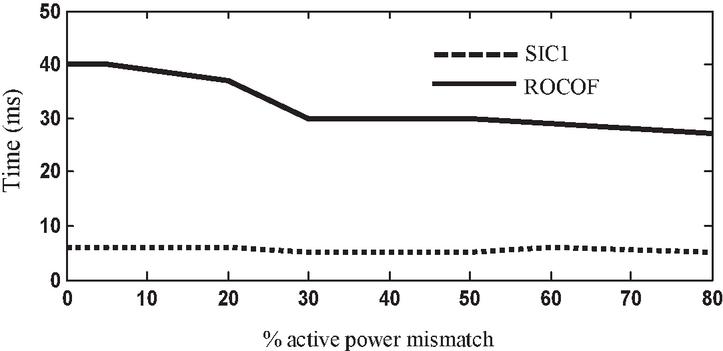
Figure 24 Active power mismatch vs operating time.
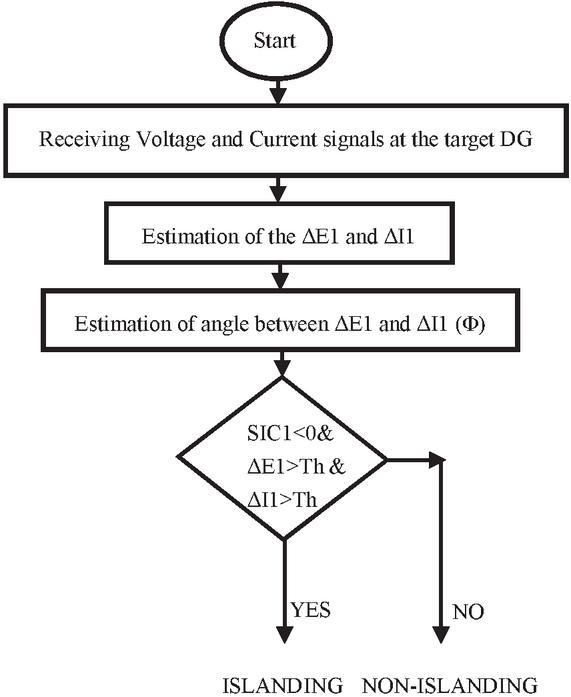
Figure 25 Complete algorithm of the proposed technique for islanding detection.
4 Discussion
It is found from the above analysis that the real power mismatch plays an important role in detecting the islanding condition in conventional technique (like ROCOF based technique). The technique detects the islanding condition when the real power imbalance is large but it fails when the real power imbalance is less than 15%. The proposed technique, on the other hand, works satisfactorily regardless of the real power mismatch. The suggested approach is validated on the other non-islanding situations like load change, capacitor bank switching and the load switching at the same target DG and it works well to distinguish these situations from islanding. The active power mismatches vs the operating time plot is shown in Figure 24 for ROCOF and proposed technique. It is evident from Figure 24 that the operating time
Table 1 Outcomes for the islanding and nonislanding situation
| Pre-island | Island | Pre-island | Island | Superimposed | Superimposed | ||||||||||
| Current | Current | Voltage | Voltage | Component of | Component of | ||||||||||
| Phasor | Phasor | Phasor | Phasor | Voltage | Current | Angle | Output | ||||||||
| Mag | Angle | Mag | Angle | Mag | Angle | Mag | Angle | Mag | Angle | Mag | Angle | Difference | |||
| Event | (kA) | (deg.) | (kA) | (deg.) | (kV) | (deg.) | (kV) | (deg.) | (kV) | (deg.) | (kA) | (deg.) | () (deg.) | ||
| Islanding | 0% | 0.0019 | 113.3 | 0.046 | -177.6 | 20.40 | -84.0 | 19.49 | -84.88 | 0.9488 | 113.3 | 0.044 | -138.5 | -108.16 | 1 |
| 30% | 0.0027 | -128.61 | 0.068 | -132.3 | 20.39 | -84.14 | 19.07 | -85.94 | 1.459 | 120.01 | 0.065 | -132.4 | -107.5 | 1 | |
| 60% | 0.003 | -129.24 | 0.079 | 50.68 | 20.38 | -84.22 | 18.88 | -86.05 | 1.629 | 117.48 | 0.0761 | -129.7 | -112.78 | 1 | |
| 80% | 0.016 | -89.83 | 0.1637 | -136.5 | 20.35 | -84.73 | 17.63 | -87.06 | 2.823 | 109.96 | 0.153 | -140.8 | -109.2 | 1 | |
| Non-islanding | DL-2 cut off | 0.003 | -121.2 | 0.0054 | -105.6 | 20.39 | -84.19 | 20.37 | -84.31 | 0.045 | 156.9 | 0.0026 | 97.44 | 0 | 0 |
| Load switching | 0.0057 | -75.42 | 0.0048 | -69.32 | 20.437 | -83.77 | 20.45 | -83.72 | 0.023 | -39.92 | 0.0011 | 75.32 | 0 | 0 | |
| DG-2 Tripping | 0.0051 | -75.77 | 0.005145 | -75.79 | 20.40 | -84.10 | 20.437 | -83.742 | 0.0002 | 118.4 | 6e-6 | -90.64 | 0 | 0 | |
| Load switching | 0.0037 | -115.5 | 0.0108 | -103.5 | 20.40 | -83.74 | 20.49 | -83.84 | 0.125 | -35.59 | 0.0072 | -97.5 | 0 | 0 | |
| ABC fault | 0.003 | -109.53 | 0.006 | -103.26 | 20.408 | -84.07 | 20.402 | -84.23 | 0.0566 | 179.96 | 0.003 | -96.92 | 0 | 0 | |
for the proposed technique is almost constant (independent of change in real and reactive power imbalance) whereas in case of conventional technique, it varies with variation in real power imbalance. The reaction time of the proposed method is lesser than the ROCOF relays showing the fastness of the proposed method. Since the proposed method works effectively upto 0% real power imbalance, hence the Non-Detection Zone (NDZ) is reduced. The complete process of the proposed method is shown in Figure 25. Also Table 1 shows the values of different values of voltages and currents for various islanding and non-islanding conditions.
5 Conclusion
This research paper presents a novel approach for detecting islanding in distributed generation. The suggested technique is successful over a wide range of real power mismatches in which the ROCOF fails to identify islanding. The reaction time of proposed method is around half-cycle from the event initiation, revealing swiftness of recommended method in comparison to ROCOF technique. The most essential conclusion is that the suggested approach can work even with a 0% real power imbalance., thus decreasing the non-detectionzone (NDZ) as compared to existing ROCOF method.
Appendix
The following are the ratings for the various elements featured in the sample system:
• Generator: short-circuit rating 1000 MVA, f 50 Hz, rated kV 120, Vbase 120 kV.
• Distributed Generators (DGs):
(i) DG-1, DG-2 and DG-3: Wind farm (9 MW) with six 1.5-MW wind turbines. For the suggested technique, the doubly-fed induction generator (DFIG) has been explored.
(ii) DG-4: Diesel Generator, 400 V and 5.0 MW.
• Transformer TR-1: ratings: 50 MVA, f 50 Hz and rated kV 120/25 kV, Vbase 25 kV, X1 .1 pu, R1 .00375 pu, Xm 500 pu and Rm 500 pu.
• Transformer TR-2, TR-3, TR-4 and TR-5: ratings: 10 MVA, f 50 Hz and rated kV 575 V/25 kV (excluding TR-5: 400V/25 kV), Vbase 25 kV, X1 .1 pu, R1 .00375 pu, Xm 500 pu and Rm 500 pu.
• Distribution lines (DL): DL-1, DL-2, DL-3, and DL-4: PI-Section, having a length of 20 km each, rated kV 25, rated MVA 25 MVA, Vbase 25 kV, R1 0.413 /km, R0 0.1153 /km, L1 3.32e-3 H/km, L0 1.05e-3 H/km, C1 5.01e-09 F/km and C0 11.33e-9 F/km.
• Normal loading data:
L1 15 MW, 5 MVAr.
L2, L3, L4 and L5 8 MW, 3 MVAr.
References
[1] O. N. Faqhruldin and H. H. Zeineldin, ‘Islanding Detection for Multi DG system using Inverter based DGs,’in in Power and Energy Society General Meeting (PES), IEEE, Vancouver, BC, 2013.
[2] H. H. Zeineldin and J. Kirtley, ‘A simple technique for islanding detection with negligible non-detection zone,’ in IEEE Transactions on Power Delivery, vol. 24, no. 2, pp. 779–786, April 2009.
[3] A. Mishra and P. Jena, ‘A Scheduled Intentional Islanding Method based on Ranking of Possible Islanding Zone, ‘IEEE Transactions. on Smart Grid, Vol. 12, No. 3, May 2021.
[4] A. Mazloomzadeh and O. A. Mohammad, ‘Islandind Detection using Synchrinized Measurement in Smart Microgrids,’ in Innovative Smart Grid Technologies Latin America (ISGT LA), 2013 IEEE PES, Sao Paulo, 2013.
[5] W. Freitas, W. Xu, C. M. Affonso and Z. Huang, ‘Comparative analysis between ROCOF and vector surge relays for distributed generation applications,’ IEEE Trans. Power Del., vol. 20, pp. 1315–1324, 2005.
[6] Zeineldin, H.H., Kirtley and J.L., ‘Performance of the OVP/UVP and OFP/UFP Method With Voltage and Frequency Dependent Loads,’ IEEE Trans. Power Del., vol. 24, no. 2, pp. 772–778, 2009.
[7] M. Ropp, M. Begovic, A. Rohatgi, G. Kern, S. Bonn, R. H. and S. Gonzalez, ‘Determining the relative effectiveness of islanding detection methods using phase criteria and nondetection zones,’IEEE Trans. Energy Convers., vol. 15, no. 3, pp. 290–296, Sep. 2000.
[8] M. Sumner, B. Patethorpe, D. W. P. Thomas, P. Zanchetta and M. C. D. Piazza, ‘A technique for power supply harmonic impedance estimation using a controlled voltage disturbance,’ IEEE Trans. Power Electron., vol. 17, pp. 207–215, march 2002.
[9] S.-I. Jang and K.-H. Kim, ‘An islanding detection method for distributed generations using voltage unbalance and total harmonic distortion of current,’ IEEE Trans. Power Del., vol. 19, no. 2, pp. 745–752, April 2004.
[10] M. Redfern, O. Usta and G. Fielding, ‘Protection against loss of utility grid supply for a dispersed storage and generation unit,’IEEE Trans. Power Del., vol. 8, no. 3, pp. 848–854, July 1993.
[11] M. A. Redfern and O. Usta, ‘A new microprocessor based islanding protection algorithm for dispersed storage and generation units,’IEEE Trans. Power Del., vol. 10, pp. 1249–1254, July 1995.
[12] G. Hung, C. Chang and C. Chen, ‘Automatic phase-shift method for islanding detection of grid-connected photovoltaic inverter,’IEEE Trans. Energy Conv., vol. 18, pp. 169–173, March 2003.
[13] P. Mahat, Z. Chen and B. Bak-Jensen, ‘A hybrid islanding detection technique using average rate of voltage change and real power shift,’ IEEE Trans. Power Del., vol. 24, pp. 764–771, April 2009.
[14] A. Yafaoui, B. Wu, and S. Kouro, ‘Improved active frequency drift anti-islanding detection method for grid connected photovoltaic systems,’ IEEE Trans. Power Electron. vol. 27, no. 5, pp. 2367–2375, May 2012.
[15] P. Gupta, R. S. Bhatia, and D. K. Jain, ‘Average absolute frequency deviation value based active islanding detection technique,’ IEEE Trans. Smart Grid, vol. 6, no. 1, pp. 26–35, Jan. 2015.
[16] P. Gupta, R. S. Bhatia, and D. K. Jain, ‘Active ROCOF relay for islanding detection,’ IEEE Trans. Power Del., vol. 32, no. 1, pp. 420–429, Feb. 2017.
[17] L. Lopes and H. Sun, ‘Performance assessment of active frequency drifting islanding detection methods,’ IEEE Trans. Energy Convers, vol. 21, no. 1, pp. 171–180, March 2006.
[18] P. Kumar, P. Jena, ‘Active Slip Frequency Based Islanding Detection Technique for Grid-Tied Inverters,’ IEEE Transactions On Industrial Informatics, vol. 16, no. 7, Jul. 2020.
[19] H. H. Zeineldin and M. M. A. Salama, ‘Impact of load frequency dependence on the NDZ and performance of the SFS islanding detection method,’ IEEE Trans. Ind. Electron., vol. 58, no. 2, pp. 139–146, Jan. 2011.
[20] G. Hernandez-Gonzalez and R. Iravani, ‘Current injection for active islanding detection of electronically-interfaced distributed resources,’ IEEE Trans. Power Del., vol. 21, no. 3, pp. 1698–1705, Jul. 2006.
[21] H. Karimi, Yazdani, A. and Iravani, R., ‘Negative-Sequence Current Injection for Fast Islanding Detection of a Distributed Resource Unit,’ IEEE Trans. Power Electronics., vol. 23, no. 1, pp. 298–307, Jan. 2008.
[22] P. K. Ganivada and P. Jena, ‘Frequency disturbance triggered d-axis current injection scheme for islanding detection,’ IEEE Transactions on Smart Grid, vol. 11, no. 6, pp. 4587–4603, 2020.
[23] O. Rintamaki and K. Kauhaniemi, ‘Applying modern communication technology to loss of mains protection,’ in 20th Int. Conf. Elect. Distrib., Prague, Czech Republic, 2009.
[24] J. Cardenas and J. Kaminsky, ‘Islanding detection with phasor measurement units,’ in Actual Trends in Development of Power System Protection and Automation. Sochi, Russia: CIGRE, Jun. 2015, pp. 61–69.
[25] X. Liu, D. M. Laverty, R. J. Best, K. Li, D. J. Morrow, and S. McLoone, ‘Principal component analysis of wide-area phasor measurements for islanding detection—A geometric view,’ IEEE Trans. Power Del., vol. 30, no. 2, pp. 976–85, Apr. 2015.
[26] D. M. Laverty, R. J. Best, and D. J. Morrow, ‘Loss-of-mains protection system by application of phasor measurement unit technology with experimentally assessed threshold settings,’ IET Gener. Transm. Distrib., vol. 9, no. 2, pp. 146–153, Jan. 2015.
[27] F. Coffele, P. Moore, C. Booth, A. Dysko and Burt, ‘Centralized Loss of Mains protection using IEC-61850,’ in the 10th IET Int. Conf. Develop. Power Syst. Protect., Manchester, U.K., 2010.
[28] P. Kumar and P. Jena, ‘Pearson’s Correlation Coefficient for Islanding Detection Using Micro-PMU Measurements’ IEEE System Journal Accepted, 2020.
[29] H. Muda, P. Jena, ‘Phase Angle-Based PC Technique For Islanding Detection of Distributed Generations,’ IET Renewable Power Generation, Jan. 2018.
[30] P. Jena and A. K. Pradhan, ‘A Positive-Sequence Directional Relaying Algorithm for Series-Compensated Line,’ IEEE Transactions On Power Delivery, vol. 25, no. 4, pp. 2288–2298, Oct 2010.
[31] A. S. R. S. Samui, ‘Assessment of ROCPAD Relay for Islanding Detection in Distributed Generation,’ IEEE Transactions On Smart Grid, vol. 2, no. 2, 2011.
[32] H. Muda, P. Jena, ‘Rate Of Change Of Superimposed Negative Sequence Impedance Based Islanding Detection Technique for Distributed Generations,’ IET Generation, Transmission & Distribution, June 2016.
[33] H. Muda, P. Jena, ‘Superimposed Adaptive Sequence Current Based Microgrid Protection: A New Technique,’ Ieee Transactions On Power Delivery, vol. 32, no. 2, April 2017.
[34] H. Muda, P. Jena, ‘Sequence Currents Based Adaptive Protection Approach for DNs with Distributed Energy Resources,’ IET Generation, Transmission & Distribution, Aug 2016.
[35] B. Kumari and P. Jena, ‘Superimposed Impedance Based Passive Islanding Detection Scheme for DC Micro-grids’ Accepted in IEEE Journal of Emerging and Selected Topics in Power Electronics, Accepted, 2021.
[36] K. Dubey and P. Jena, ‘Impedance Angle Based Differential Protection Scheme for Microgrid Feeders, ‘Accepted in IEEE System Journal, 2020.
[37] P. Kumar and P. Jena, ‘Voting Technique based Islanding Detection Using Superimposed Phase Angle Variation,’ IET Renewable Power Generation, 2020.
Biographies

Javeed Bashir received the bachelor’s degree in Electrical Engineering from National Institute of Srinagar in 2010, the master’s degree in Electrical Engineering with specialization Power System Engineering from Indian Institute of Technology Roorkee in 2014, respectively. He is currently working as an Assistant Professor at the Department of Electrical Engineering, Islamic University of Science and Technology, Kashmir, Pulwama, India. His research areas include Islanding detection, power system protection and smart grid.

Premalata Jena (Member, IEEE) received the B.Tech. degree in electrical engineering from Utkal University, Bhubaneswar, India, in 2001, and the M. Tech and Ph.D. degrees in power system engineering from the Indian Institute of Technology Kharagpur, Kharagpur, India, in 2006 and 2011, respectively. Since 2012, she has been an Assistant Professor with the Department of Electrical Engineering, Indian Institute of Technology Roorkee, Roorkee, India. Her research interests include power system protection, microgrid protection, and issues due to the integration of renewables with the existing power grid. Dr Jena is a recipient of the Women Excellence Award-2017 from the Department of Science and Technology, New Delhi, the Young Engineer Award, Indian National Academy of Engineering, and the Power System Operation Corporation Limited Power System Award, Power Grid Corporation of India Ltd., India, in 2013.
Distributed Generation & Alternative Energy Journal, Vol. 38_2, 367–392.
doi: 10.13052/dgaej2156-3306.3821
© 2023 River Publishers