A Novel Knapsack Algorithm-Based Energy Routing in a Microgrid
S. Nethravathi and Venkatakirthiga Murali*
Department of Electrical and Electronics Engineering, National Institute of Technology, Tiruchirappalli, Tamil Nadu, India
E-mail: nethrapallavi@gmail.com; mvkirthiga@nitt.edu
*Corresponding Author
Received 09 February 2022; Accepted 09 May 2022; Publication 03 January 2023
Abstract
The increase in penetration of renewable energy sources has transformed the existing grid into a multisource and multipath energy network. For real-time energy transactions in the new microgrid, it is essential to realize an energy router interface, which is the core of the energy internet. The energy router controls the bidirectional energy and data flow and achieves end-to-end energy transmission efficiently. With this consideration, this article proposes a new energy routing algorithm based on the knapsack optimization technique. The proposed work aims to minimize the net energy from the main grid and efficiently utilize solar photovoltaic (SPV) energy through meticulous energy routing. The effectiveness of the proposed work is validated for case studies with various types of loads viz residential, non-residential, and electric vehicle loads. In this work, the best set of loads for optimal energy routing with minimum energy costs are determined. The results show a substantial reduction ranging from 16 to 28% in the peak energy drawn from the grid and at the same time, the cost of electricity to be paid to the utility is noticeably reduced in the range of 39% to 50% for various load types. Further, a sensitivity analysis is carried out to evaluate the effect of variations in input parameters such as PV output, and load demand on the cost of electricity.
Keywords: Demand side management, microgrid, direct load control, knapsack algorithm, energy routing.
Nomenclature
| M | Metabolic rate |
| W | External work |
| p | Partial vapour pressure |
| t | Ambient air temperature |
| f | Clothing area factor |
| t | Clothing surface temperature |
| t | Radiant temperature |
| h | Heat transfer coefficient |
| I | Clothing insulation in clothes |
| v | Air velocity |
1 Introduction
Microgrids allow the integration of various renewable energy resources into the distribution systems to manage the increasing electrical energy demand [1]. Increasing the power generation capacity, adding energy storage systems, and applying demand-side management (DSM) techniques are the widely used solutions to address the mismatch in generation and demand. Implementing DSM techniques is cost-effective compared to other solutions. The DSM objective is to reshape the load curve by employing suitable techniques like peak levelling, valley filling, loads shifting, strategic load growth, strategic conservation, and flexibility in load curve [2–5].
Recently, the concept of internet of energy, wherein energy is exchanged between consumer and utility or between the consumers, has gained prominence [6]. Energy internet combines smart grid features and the internet of things (IoT) supporting bidirectional energy flow and peer-to-peer energy trading [7].
Energy routing algorithms play vital role in energy internet since they dynamically regulate the energy and exchange real-time information [8–10]. An energy router with switching functionality is developed for a home energy management system, which switches between different loads and energy sources depending on the power rating of the loads and the availability of the power from renewable energy resources in literature [11, 12]. Authors in [13] proposed an energy sharing algorithm which shares excess energy between microgrids An experiential algorithm based on a generic result is presented in [14], which analyses the route for energy from source to stations to charge EVs in an energy internet network.
To manage peak energy demand, direct load control of a group of air conditioners is an economic strategy of demand side management. Effective design of air conditioner management has the potential to cut the peak load and electricity cost [15]. Authors in [16] proposed an intelligent algorithm to decide which air conditioners to turn on/off so that the energy consumed reaches the target and keeps the customer’s comfort zone. Another control strategy for air conditioners is proposed in [17], where thermostat set points are adjusted so that the energy consumption follows desired trajectory using clustering technique while maintaining customer comfort. In [18], PMV based fuzzy control algorithm is proposed to balance energy consumption and occupant’s thermal comfort.
Demand side management strategies are applied for educational institutions to reduce consumption and achieve savings in literature [19, 20]. A green awareness project is executed to achieve energy savings in schools using an IoT infrastructure that accomplishes 20% energy savings [21]. In a university campus of Saudi Arabia, supervision of load power demand and controlling the lighting and thermostats of air condition units is done using a building energy management system to reduce the electrical energy consumption [22].
The authors in [23] proposed an optimized home energy management system for demand-side management where the load scheduling problem was formulated as a multiple knapsack problem. Direct Load Control (DLC) using knapsack method is employed in literature [24] for peak levelling of loads along with backup load management. A priority based day ahead load shifting technique mapped to multiple knapsack algorithm to mitigate rebound peaks is proposed in literature [25]. Literature [26] proposed an algorithm based on knapsack technique to normalize the consumption peaks and manage residential appliances to keep the overall energy within a specific limit. Additionally, knapsack technique is used widely for energy efficient routing in Wireless multimedia Sensor Networks [27] and energy conservation practices [28].
In light of the literature survey, a combination of DLC and energy routing approach has not been implemented so far to the best of the author’s knowledge. With this context, a novel algorithm for thermal comfort model based DLC and efficient energy routing from the SPV energy source using the knapsack method has been attempted in this paper. The versatility and robustness of the proposed methodology are validated for a Lecture Hall Complex (LHC) of an academic institution, a residential building, and a community electric vehicle (EV) charging station. Specifically, the contribution of the paper is listed as follows:
• Machine Learning models are used for weather forecasting and to predict load curves.
• DLC is employed for air conditioning loads depending upon the thermal comfort parameters: predicted mean vote (PMV) and predicted percentage of dissatisfied (PPD).
• Furthermore, the knapsack optimization method is used to route energy from the SPV source to different loads.
• The proposed methodology is validated through cost-benefit analysis for various loads and case studies.
The rest of the paper is organized as follows: Section 2 describes the proposed approach, workflow diagram, and the methodologies adopted. Section 3 presents the results and discussions, and Section 4 concludes the paper.
2 Proposed Methodology
The workflow of the algorithm is represented by a flowchart, as shown in Figure 1. The time granularity considered is one hour. The inputs to the algorithm are historical weather information, load energy required, SPV source output, types of occupants, and their activities. Weather information is required for two reasons in this proposed work. First is to calculate PMV and PPD index values which are used for DLC of air conditioners and second is to calculate the SPV output. The energy requirement for loads is another input for the proposed algorithm which is used to ascertain the load selection for routing from alternate source. Additionally, the PMV value along with depending on the prevailing weather conditions it also depends on the occupant type and the activity.
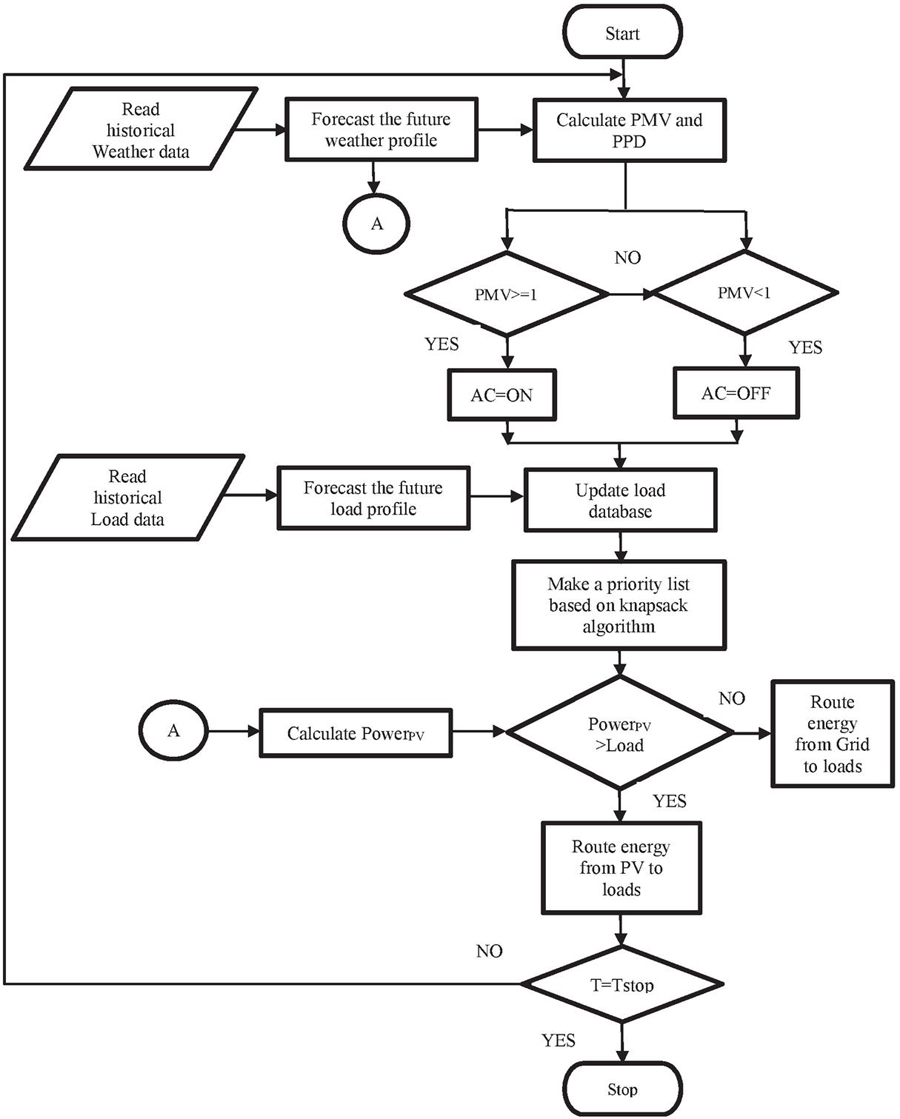
Figure 1 Flowchart for the proposed work.
The proposed work is divided into three parts which are executed sequentially. In the first fragment, the machine learning technique forecasts the day ahead weather and loads. These are the inputs for the second fragment, which employs the thermal comfort model. Here, the decision on controlling the air conditioning loads is taken based on the PMV and PPD values. The knapsack algorithm then selects the loads to route from the SPV source.
The predicted weather data is used for calculating the PMV and PPD indexes. If the PMV index is less than 1, air conditioners are strictly switched OFF. On the other hand, if PMV is more than 1, air conditioners are kept ON. Once the air conditioner switching conditions are decided, the load database is updated accordingly. Then the algorithm checks for the available energy from the SPV source. Following this the knapsack algorithm selects the loads for routing the SPV energy based on the priority assigned. The methods used and the implementation of the proposed work are explained in the subsequent sections.
2.1 Prediction Using Machine Learning Algorithms
Short-term forecasting is carried out in this work using regression tree models, a popular machine learning algorithm. Short-term forecasts have an immediate impact on the operation of the building in terms of power consumption. Hence, they are key components for the operation of energy management systems of a building. In this proposed work, the decision on energy routing is taken based on the availability of SPV energy and the predicted load demand. Therefore, forecasting is an essential tool in this proposed algorithm. The inputs fed the algorithm are historical load consumption for eight weeks. The load details for institutional load are obtained from the class time tables, while, the residential load details are taken from the reference [29]. On the other hand, the EV data are referred from literature [30]. Machine learning toolbox of MATLAB is used for forecasting the data in this proposed work. The model incorporates train and test method where it uses training dataset to train the model and validation dataset to test the accuracy of the model. Various machine learning methods, such as linear regression, regression trees, support vector machines (SVM), and gaussian process regression (GPR) models, are used to train the given set of inputs. The accuracy of the model is evaluated in terms of the root mean square error of the respective models (RMSE) which is as shown in Table 1. The regression tree model has been selected for forecasting since the model’s RMSE was the least compared to other models.
Table 1 RMSE comparison
| Model | RMSE for Classroom Load | RMSE for Residential Load |
| Linear regression | 3.7 | 0.6 |
| Regression trees | 0.89 | 0.040 |
| SVM | 3.9 | 0.66 |
| GPR | 1.6 | 0.043 |
Regression techniques predict continuous responses and provide efficient solutions to complex non-linear problems by employing a divide and rule strategy. Regression trees have a tree-like structure, starting from the root node and ending at a leaf node. The root node comprises the entire input sample called predictors. Children nodes correspond to the sub-divisions obtained with the best split. The leaf node is the end of the structure, representing the output called the response [31].
Table 2 Clothing insulation and Metabolism values
| Clothing | I | Activity | Metabolic Rate |
| Long sleeve shirt | 0.25 | Reading, seated | 1.0 |
| Short sleeve shirt | 0.19 | Writing, seated | 1.0 |
| Trousers | 0.24 | Sleeping | 0.7 |
| Sandals | 0.02 | Walking | 1.7 |
Table 3 Seven-point thermal sensation scale [16]
| 3 | Too hot |
| 2 | Hot |
| 1 | Little Warm |
| 0 | Neutral |
| 1 | Little Cool |
| 2 | Cool |
| 3 | Too cool |
2.2 Thermal Comfort Model
The adapted model describes the level of thermal comfort for a crowd of people dwelling in a specific location. Environmental factors, physical activity of the people, and clothing impact the thermal balance. The model helps in controlling the temperature of a place in such a way as to establish the wellbeing of the people. The predicted mean vote model is one of the most widely used thermal comfort models.
‘American society of heating refrigeration and air conditioning engineer (ASHRAE) standard 55-2004’ uses Fanger’s heat balance equation [32] to determine the range of thermal comfort. The values used for different clothing and metabolism in Equations (1)–(4), are summarized in Table 2 [33]. PMV gives the mean value of the ASHRAEs seven-point thermal sensation rule [34], shown in Table 3. PPD predicts the percentage of individuals feeling too cool or too hot. Figure 2 shows the variation of PPD with respect to PMV.
The equations to calculate PMV and PPD are adapted from [22] as given below:
| (1) | ||
| (2) | ||
| (3) | ||
| (4) | ||
| (5) |
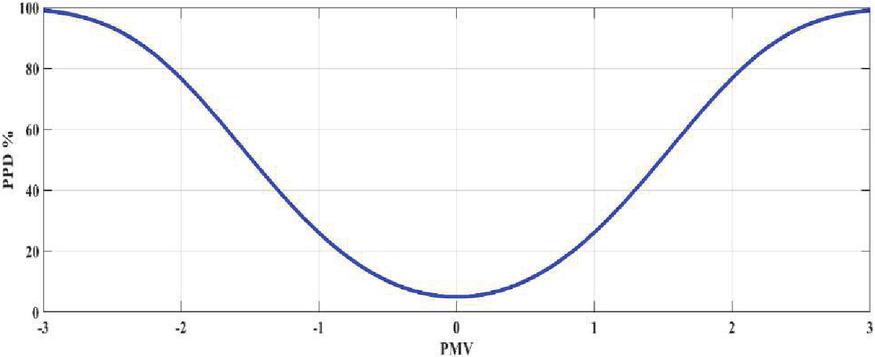
Figure 2 PMV vs. PPD.
As observed from Figure 2, whenever the PMV value deviates from zero, the number of people feeling discomfort increases correspondingly. ASHRAE 55 states that thermal comfort can be achieved by achieving an occupant satisfaction rate of at least 80% using both indices. The PPD ranges from 5% to 100%, depending on the calculated PMV. In order for comfort ranges to comply with standards, PPD should not be above 20%. In the proposed algorithm, the threshold for PMV considered is 1 which is range pertaining to the comfort zone of the occupant, beyond which the algorithm takes action to switch ON/OFF the air conditioner load hence maintaining the comfort of the dwellers.
2.3 Knapsack Optimization Technique
The knapsack method is a combinatorial optimization problem used for resource allocation solutions. Because of its resemblance to real-life problem-solving approach, the Knapsack algorithm is a popular algorithm that has been the subject of extensive research for decades. Knapsack methods are used in a wide range of real-world decision-making processes, such as asset allocations, budget decisions, investment decisions, industrial loading, economy, and finance etc.
In a conventional knapsack problem, a set of N items, each having a value of v and weight w, are filled into a knapsack of size W while the net worth of the items inside the knapsack is maximum [35]. Mathematically it is represented as follows:
| (6) |
The mapping for applying the knapsack method for the routing application in the presented algorithm is as follows:
• Lecture halls, residential appliances, and electric vehicles are considered unique loads.
• The weight of each object is the energy drawn by each load.
• The object’s value is the cost of electrical energy drawn in each time slot.
• The total SPV energy availability in the considered time slot is the knapsack size.
At this juncture, the block diagram representation of the proposed work is shown in Figure 3. The proposed framework consists of an energy router, grid-interactive rooftop SPV source, loads and data logger. The algorithm first collects the data from the data logger based on which forecasting is done.
Consequently, the updated load database and available electrical energy are fed into the energy router. The energy router directs the energy from the SPV plant to the loads following the priority assigned by the knapsack algorithm based on the prevailing conditions. A value to weight ratio is, i.e., energy drawn to the cost of electrical energy is calculated and prioritized. The algorithm directs the energy from SPV to the load starting from the load with the highest priority. This procedure is carried out until a load energy requirement exceeds the SPV energy. The remaining loads are directed towards the main grid.
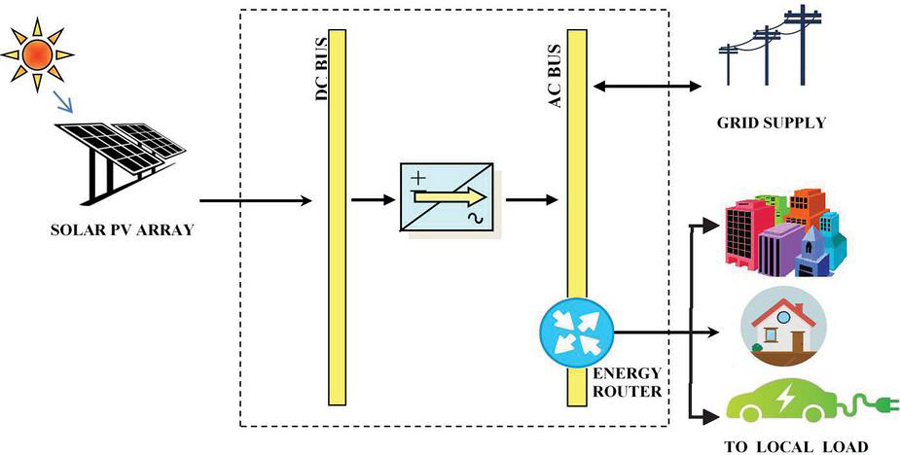
Figure 3 Block diagram representation of the proposed system.
3 Results and Discussions
The proposed work is implemented in the MATLAB platform and validated for three types of loads: institution building, residential building, and community electric vehicle charging station. The location considered for the work receives abundant solar energy with 5.8 kWh/m/day average insolation and is shown in Figure 4. The ambient temperature at the considered place for a day is shown in Figure 5 which is a vital factor for analysing the thermal comfort of the occupants while carrying out DLC for air conditioners.
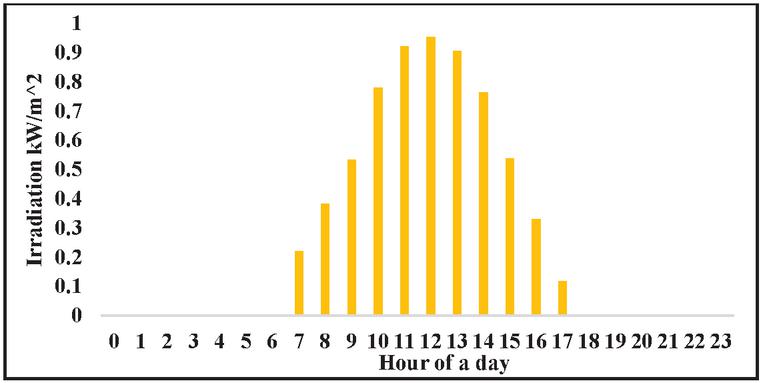
Figure 4 Average irradiation at the selected location.
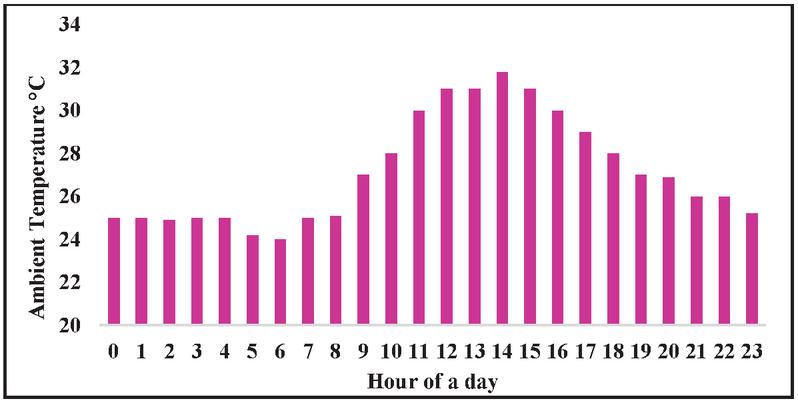
Figure 5 Ambient temperature at the selected location.
Load type 1: This is a complex of lecture halls at the National Institute of Technology Tiruchirapalli, Tamilnadu, India. The lecture hall complex consists of 18 lecture halls, a waiting room, toilets, etc. The algorithm is executed for working days of the institute, i.e., from Monday to Friday and between 8 AM and 5 PM. The details of loads in a lecture hall are given in Table 4. The capacity of the SPV plant installed is 100 kWp located over the rooftop of the lecture hall complex. The energy requirement of each load of LHC is shown in Figure 6.
Table 4 Loads of the lecture hall
| Type of Load | Air Conditioner | Tube Lights | Projector |
| Rating (kW) | 1815 | 55 | 250 |
| No. of loads | 2 | 8 | 1 |
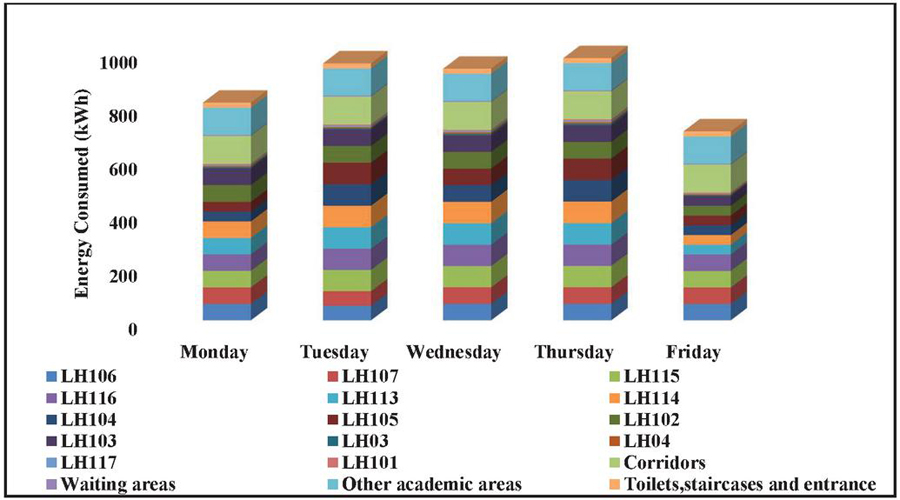
Figure 6 Energy consumption in LHC.
Load type 2: In this type of load, a residential building is investigated. The algorithm is executed throughout the day. The loads considered are household appliances, and their corresponding ratings are given in Table 5. All the loads are assumed to consume constant energy throughout the connection period. The capacity of the rooftop SPV plant is 2 kWp in this case. The total energy consumed for the LHC, and residential loads is given in Table 6. The energy consumed by residential loads is shown in Figure 7.
Table 5 Loads of the residential building
| Type | Washing | Air | |||||
| of Load | Machine | Lights | Fan | Television | Fridge | Conditioner | Heater |
| Rating (kW) | 500 | 200 | 240 | 55 | 200 | 1200 | 1000 |
Table 6 Energy drawn per day
| Total Energy Consumed (kWh) | ||
| Day | LHC | Residential |
| Monday | 816.95 | 20.24 |
| Tuesday | 963.81 | 20.095 |
| Wednesday | 943.94 | 19.54 |
| Thursday | 983.41 | 20.54 |
| Friday | 709.45 | 19.04 |
| Saturday | – | 23.14 |
| Sunday | – | 28.64 |
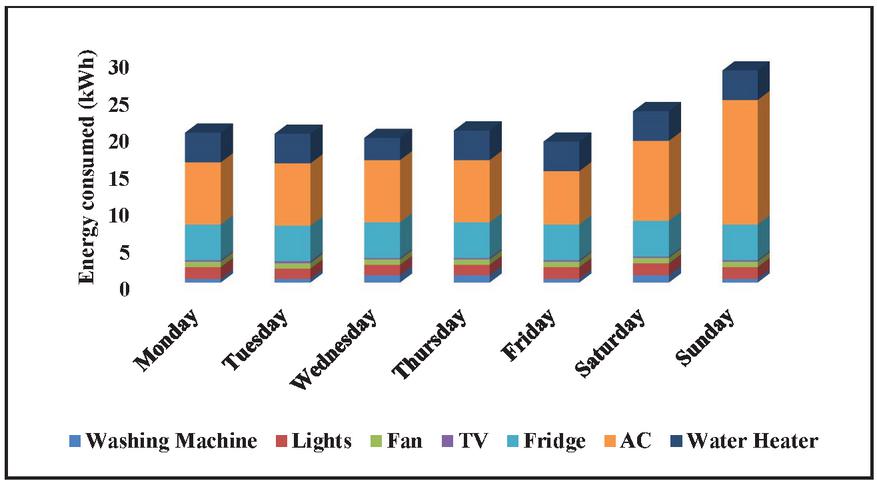
Figure 7 Energy consumption for residential load.
Table 7 Electric vehicle details
| Capacity | Maximum Usable | Min | Full Charging | |
| Model | [kWh] | Capacity [kWh] | Capacity [kWh] | Time [h] |
| Tesla Roadster | 53 | 47.7 | 5.3 | 3.5 |
| Audi Q4 | 82 | 73.8 | 8.2 | 1.05 |
| Mercedes eqc | 80 | 72 | 8 | 0.5 |
| Volkswagen | 36.8 | 33.12 | 3.68 | 3.2 |
| Renault twingo | 22 | 19.8 | 2.2 | 2.03 |
| Fiat 500e | 24 | 21.6 | 2.4 | 3.39 |
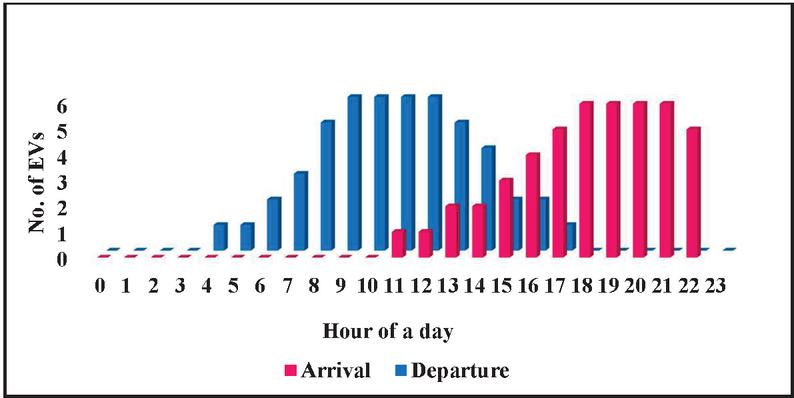
Figure 8 EV arrival and departure time.
Load type 3: A community charging station for electric vehicles is contemplated in this type. EV arrival and departure time are modeled as a Gaussian distribution method, a widely adopted method. The EV arrival and departure time data are taken from reference [30] and are shown in Figure 8. The mean value for the arrival time is 19.62, and the standard deviation value of 3.62. The departure time has a 10.53 mean value and a 3.26 standard deviation value. A total of 50 EVs with different power ratings are considered for this study since each consumer will have different EVs in a community. The details of EVs considered are given in Table 7 which were taken from the manufacturer datasheets.
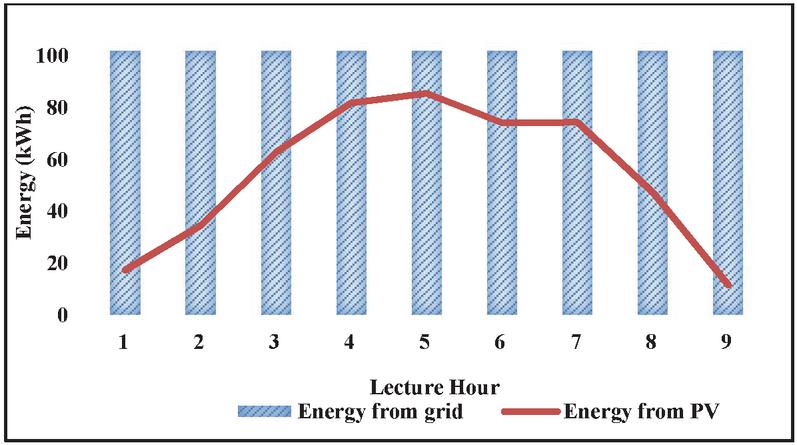
Figure 9(a): Energy profile for LHC.
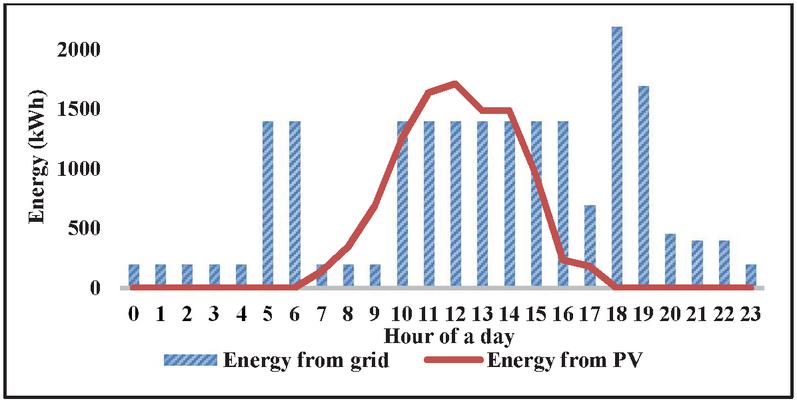
Figure 9(b): Energy profile for residential building.
Figures 9(a), 9(b), and 9(c) show the energy drawn for one day by the LHC, residential building, and electric vehicles in a community and the corresponding SPV energy available on the same day. In Figure 9(a), classroom load is constant and hence the energy consumed is also constant in a day. In Figure 9(b), the energy drawn varies hourly because of the switching ON/OFF the residential appliances. Whereas in Figure 9(c), EVs are charged as and when they arrive, and therefore energy drawn from the grid is concentrated from 11th to 23rd hour.
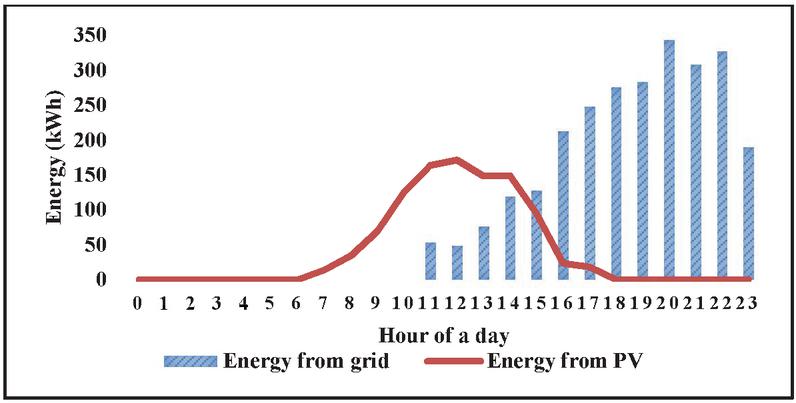
Figure 9(c): Energy profile for EV charging.
The algorithm checks the SPV energy availability at a particular time slot and, following the knapsack method, selects the loads to cater for from SPV source. For LHC load, eight lecture hours are planned in a day, each of fifty minutes duration. As for residential loads, the loads are operated at a specific time based on the user behavior. The EV load depends on the arrival and departure times. The algorithm is executed at every hour to decide the energy flow route at the beginning of each hour. Energy routing selects the LHs, residential loads, and electric vehicles that will receive the SPV energy.
Table 8 Selected LHs for energy routing in LHC
| Case 1 | 1 | 2 | JK13 | JK14 | 5 | 6 | 7 | 8 | JK19 | JK110 | 11 | 12 | 13 | 14 | 15 | JK116 | 17 | 18 |
| Case 2 | 1 | 2 | 3 | 4 | 5 | 6 | 7 | JK18 | 9 | 10 | JK111 | JK112 | JK113 | JK114 | 15 | JK116 | 17 | JK118 |
| Case 3 | JK11 | 2 | 3 | 4 | 5 | 6 | JK17 | 8 | 9 | 10 | JK111 | JK112 | JK113 | JK114 | JK115 | JK116 | JK117 | JK118 |
| Lecture Halls | ||||||||||||||||||
For LHC load, three case studies are executed in the proposed work. Case 1 is when no DLC is applied, and only the routing algorithm is executed. In Case 2, DLC is applied to one of two air conditioners in each lecture hall, while the other is left ON throughout the day. In case 3, both air conditioners of the lecture halls are controlled based on the DLC approach. Table 8 shows one such routing strategy for the first lecture hour of the Thursday schedule. The shaded cells in the table represent the selected LHs for the routing. Because DLC is not used for the air conditioner loads in Case 1, the energy required is higher, and thus SPV energy only serves a few classrooms, i.e., only five LHs (3, 4, 9, 10, 16). Case 2 includes a few more LHs for routing from the SPV source, namely seven LHs (8, 11, 12, 13, 14, 16, 18). Because of the use of DLC for air conditioners, the total energy required by loads of LHs is now slightly less than in case 1. For case 3, the number of LHs chosen for energy routing from the SPV source increases to ten (1, 7, 11–18) because of control of two air conditioners.
Two case studies are performed for a residential load: one where only energy routing is executed without DLC for air conditioners, and another where both DLC and energy routing are executed. Table 9 shows one such routing application for the residential load on Saturday at 8 AM. Only two loads (4, 7) are selected for routing from SPV energy in Case 1. In case 2, the loads for routing from the SPV source increase to three (1, 3, 4) since air conditioner is appropriately controlled based on thermal comfort model.
Table 9 Selected loads for energy routing in residential building
| Case 1 | 1 | 2 | 3 | JK14 | 5 | 6 | JK17 |
| Case 2 | JK11 | 2 | JK13 | JK14 | 5 | 6 | 7 |
| Residential Loads | |||||||
For the third type of load, each EV is assigned an identification number and treated as an individual load. For a given EV arrival time, the router directs energy from SPV to EV based on the priority assigned, which is determined by the SoC of the EV’s battery. The remaining EVs are charged from the main grid. Table 10 shows few instances of energy routing for the EVs selected. It is observed that, at 12th hour of the day, only one EV is selected for routing. In the following hour, two EVs are selected and in the subsequent hour, three EVs are selected. This process repeats until SPV energy is exhausted in a day.
Table 10 Selected EVs for energy routing in EV routing
| 12th hour | JK11 | 2 | 3 | 4 | 5 | 6 | 7 | 8 | 9 | 10 | 11 | 12 | 13 |
| 13th hour | 1 | JK12 | JK13 | 4 | 5 | 6 | 7 | 8 | 9 | 10 | 11 | 12 | 13 |
| 14th hour | 1 | 2 | 3 | JK14 | JK15 | JK16 | 7 | 8 | 9 | 10 | 11 | 12 | 13 |
| Electric Vehicles | |||||||||||||
The load curves for the LHC and residential building in a week for all the case studies conducted are shown in Figures 10(a) and 10(b), respectively. As observed, the energy consumed by loads is less with DLC application for air conditioners. Energy consumed further reduces with the knapsack based energy routing.
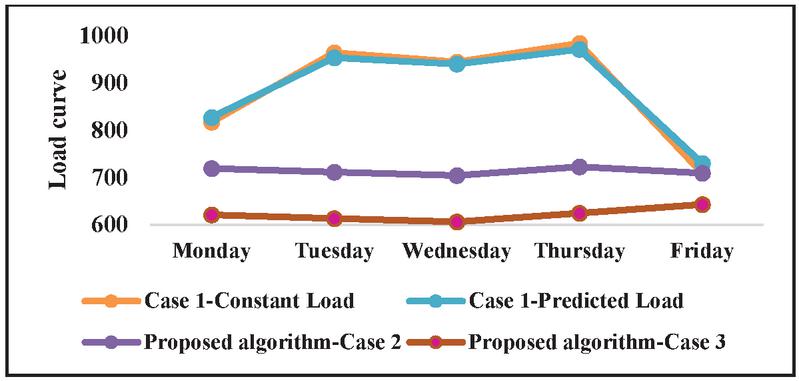
Figure 10(a): Load curves for lecture hall complex.
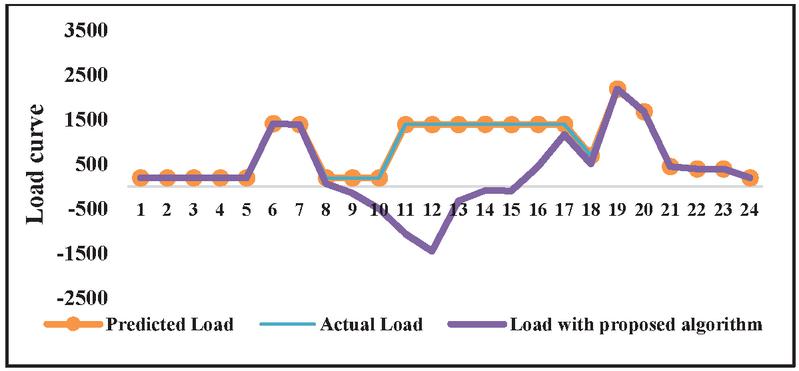
Figure 10(b): Load curves for residential consumer.
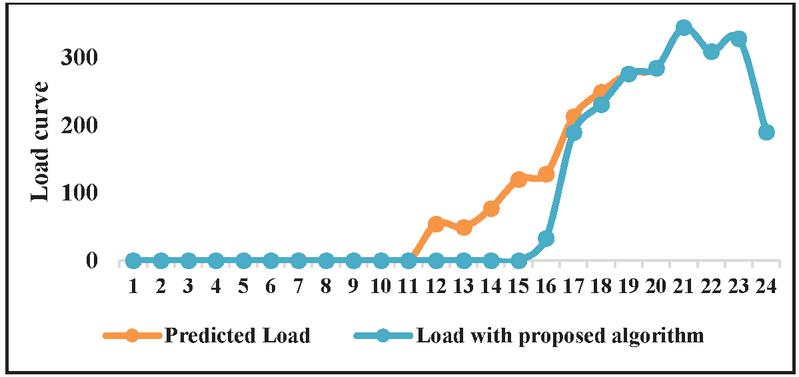
Figure 10(c): Load curves for EV charging station.
Figure 10(c) shows the load curve for an electric vehicle charging station. Since most EVs arrive in the evening, direct energy routing from SPV source to EV charging is for a smaller duration. Nevertheless, the SPV energy is stored in batteries and utilized later.
Figures 11(a) and 11(b) depict the cost of electricity each day for one week for the three cases discussed in this work. For LHC considered, the cost incurred in case 2 is reduced by 26% compared to case 1 for each working day of the week considered. Similarly, the cost of electricity for case 3 is lessened by an average of 31% compared to case 1 and decreased by an average value of 13% compared to case 2. With residential load, the cost of electricity is reduced by 19% for case 1 and with case 2 implementation, the cost is reduced by 40% against base case when no control is applied.
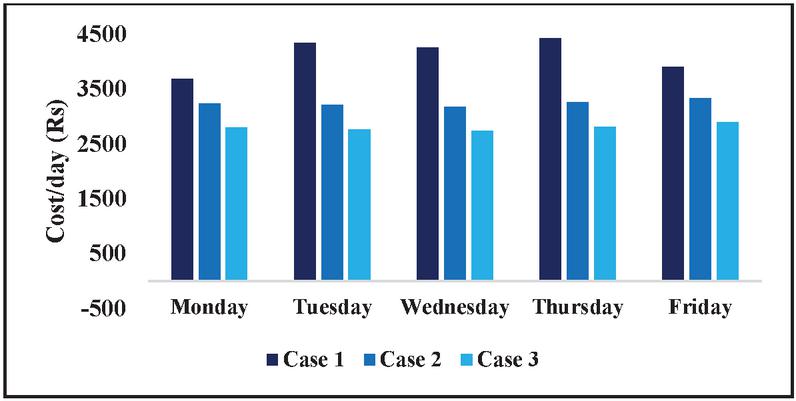
Figure 11(a): Cost comparison for LHC.
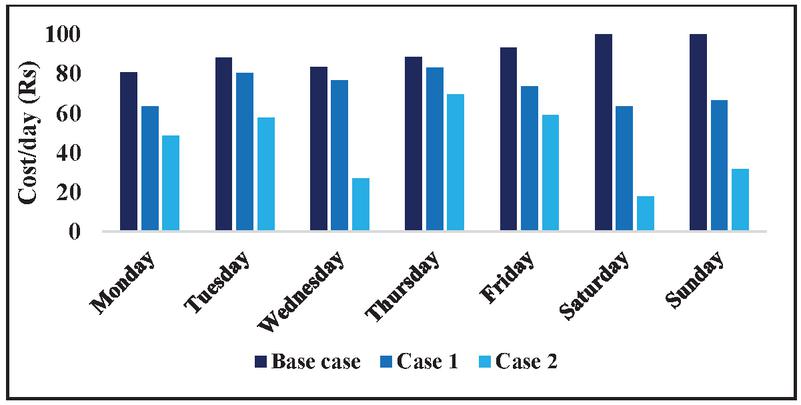
Figure 11(b): Cost comparison for residential load.
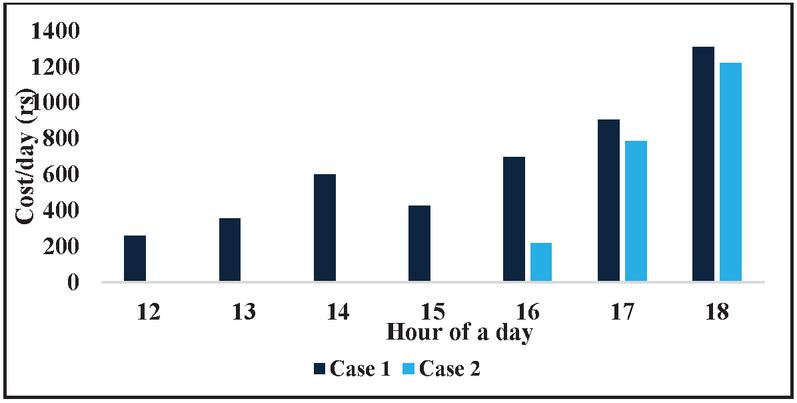
Figure 11(c): Cost comparison for EV charging station.
Figure 11(c) shows the reduction in cost for EV charging from grid and SPV source. It is observed from the graph that the cost is zero for a few hours of a day since all EVs are charged with the SPV source. The EVs are charged from the grid during the rest of the time. As observed, there is approximately an 50% reduction in the charges incurred with implementing the proposed work.
Even after energy routing, some SPV energy remains above the load energy requirement. After routing to the loads, the remaining SPV energy is pumped to the grid which is shown in Figures 12(a), 12(b) and 12(c) for institution building, residential building, and EV loads, respectively. According to the regulations of Tamilnadu Electricity Board, a consumer must pay for the variance between import and export of energy with solar net-meter installation. The difference in import and export of energy is more in case 3 among all the three cases and hence the billing amount is also reduced.

Figure 12(a): Percentage of power sent to the grid for Institution load.
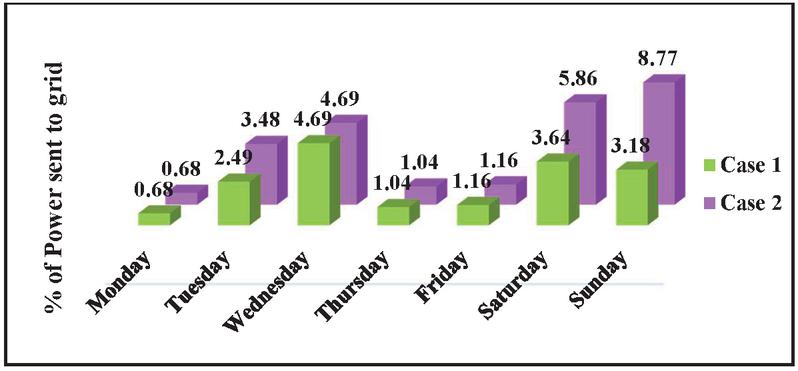
Figure 12(b): Percentage of power sent to the grid for residential load.
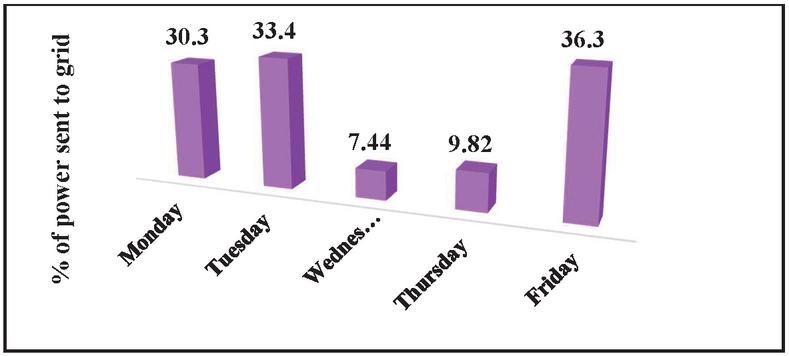
Figure 12(c): Percentage of power sent to the grid for EV load.
Furthermore, sensitivity analysis is performed to assess the effects of changing input parameters on daily electricity charges. For sensitivity evaluation, the effects of 10% change in input parameters such as PV output variations and load demand are considered in this study. The change in the cost with input parameter variation is compared against the cost incurred with predicted values of the input parameters.
In this context, the effects of varying the load are evaluated and are given in Figures 13(a), 13(b), and 13(c). It is observed that for every 10% change in the input parameter, the cost variation is 9.7%, 15% and 11% for institution, residential and EVCS loads respectively.
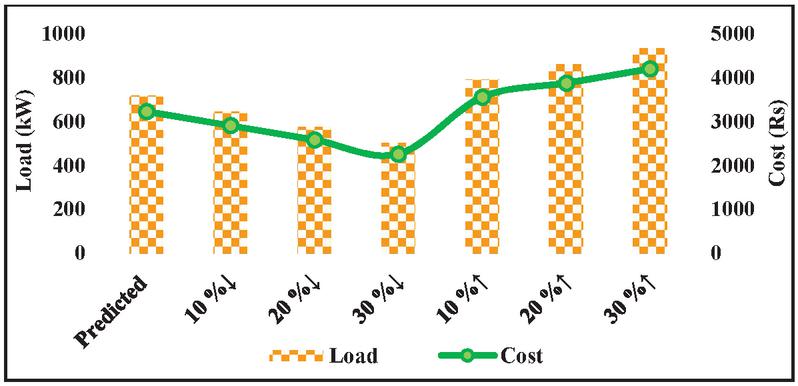
Figure 13(a): Sensitivity analysis for varying institution load.
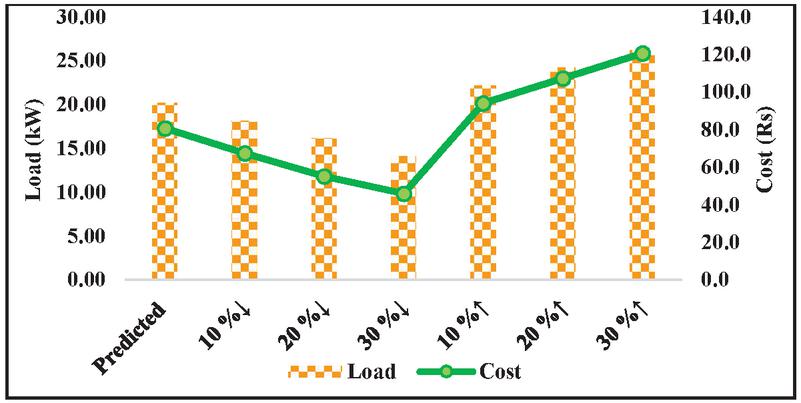
Figure 13(b): Sensitivity analysis for varying residential load.
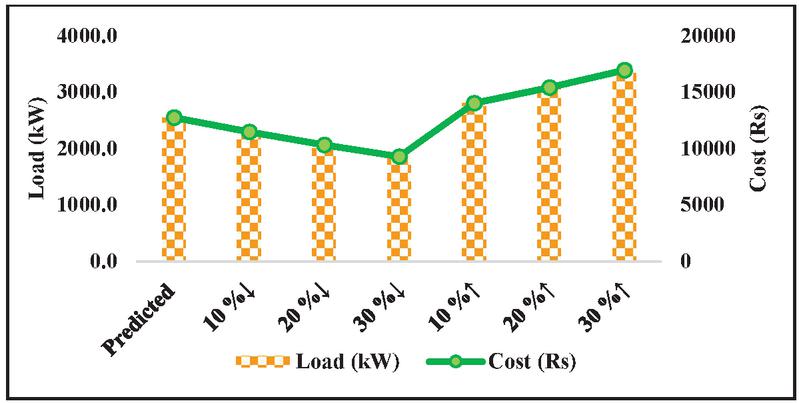
Figure 13(c): Sensitivity analysis for varying EV charging station load.
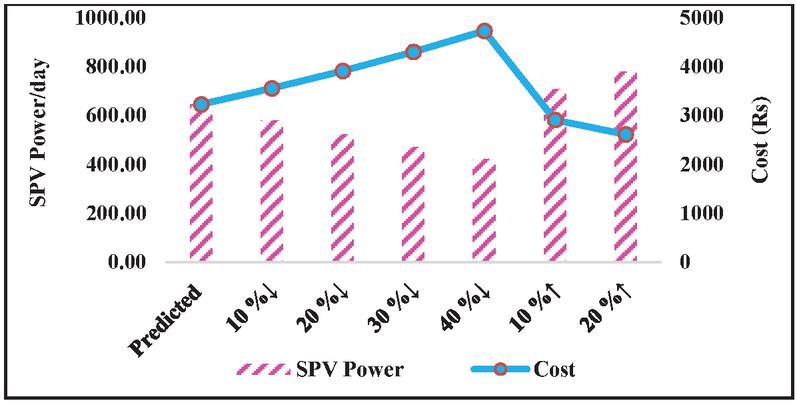
Figure 14(a): Sensitivity analysis for varying SPV output-institution load.
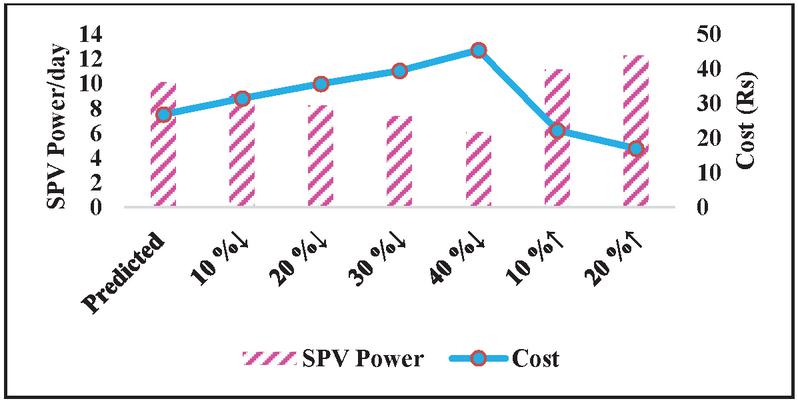
Figure 14(b): Sensitivity analysis for varying SPV output-residential load.
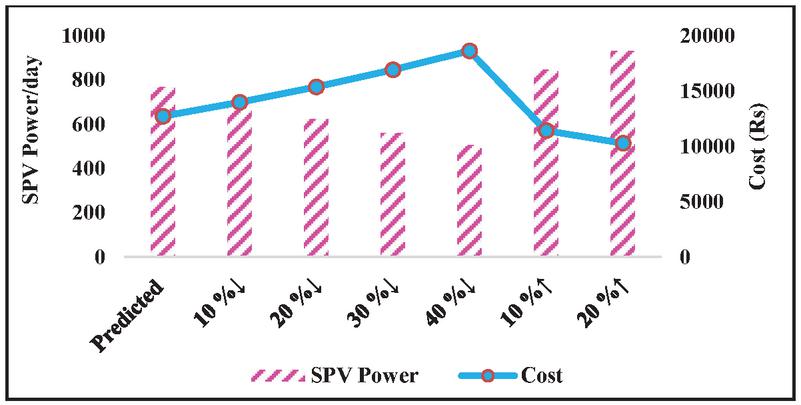
Figure 14(c): Sensitivity analysis for varying SPV output-EV charging station.
Similarly, the output of the SPV source varies relative to partial shading or a cloudy atmosphere. To assess this condition, the effect of variation of SPV source output on the electricity charges variation was analysed and are shown in Figures 14(a), 14(b), and 14(c). It is observed that the cost of electricity variation for every 10 % change in SPV output is 11%, 5% and 13% for institution, residential and EV charging station loads respectively.
In India, electrical energy is majorly generated through coal-based thermal energy plants, releasing a substantial amount of carbon dioxide (CO). An average of 980 g of CO is released to the atmosphere by thermal energy plants for one unit (kWh) of electricity generation [36, 37]. With the installation of SPV power plant, on average, there is a reduction of 65% in CO emissions over a week for LHC load, 33% reduction in CO emissions for residential loads, and 70% reduction for EV charging through SPV.
4 Conclusions and Future Scope
There are numerous DSM techniques currently available for both residential and non-residential loads. This paper has presented a novel algorithm employing a thermal comfort model and knapsack algorithm for DLC of air conditioners followed by energy routing from SPV source. The proposed work is applicable to any other type of load with a variable number of loads. For the proposed work, three types of loads were validated: an institution’s lecture hall complex, a residential building, and a community EV charging station. Various case studies were examined for each type of load, and a comparison among the case studies w.r.t. energy reduction and the cost reduction has been done. The major conclusions of the proposed work are:
• On an average there is a peak load reduction of 26% for institutional load, 28% for residential load and 16% for EV charging stations per day.
• When electricity charges are considered, the cost is reduced by 31% for institutional loads, 49 % for residential loads, and 50% for EV charging stations.
• Furthermore, the user earns additional revenue by pumping excess energy from the SPV source to the grid.
• In addition, sensitivity analysis was performed to assess the impact of variations PV output and load demand on the cost of electricity. It is observed that a variation of 5%–15% in the cost incurred is observed with variations of the input parameters.
• The user’s comfort is not jeopardized since the proposed algorithm continuously assesses the thermal comfort of the occupants.
The proposed methodology will be extended to the Internet of Things in the future to create an Internet of Energy for a group of consumers. Additionally, the sizing of renewable energy sources to convert an existing building into a net-zero energy building will be evaluated.
Acknowledgement
This work has received funding from the Science and Engineering Research Board (SERB), Statutory Body Established through an Act of Parliament: SERB Act 2008, Government of India under the scheme, MATRICS, for the project titled, “Internet of Energy based Interactive Residential Load Management System.”
References
[1] Venkatesh Boddapati and S. Arul Daniel, “Optimal Design and Techno-Economic Analysis of a Microgrid for Community Load Applications,” Int. Conf. Innov. Clean Energy Technol. (ICET-2020).
[2] S. A. Almohaimeed, S. Suryanarayanan, and P. O’Neill, “Reducing carbon dioxide emissions from electricity sector using demand side management,” Energy Sources, Part A Recover. Util. Environ. Eff., vol. 00, no. 00, pp. 1–21, 2021, doi: 10.1080/15567036.2021.1922548.
[3] P. V. Nithara and R. Anand, “Comparative analysis of different control strategies in Microgrid,” Int. J. Green Energy, vol. 18, no. 12, pp. 1249–1262, 2021, doi: 10.1080/15435075.2021.1897830.
[4] A. M. Othman, M. Helaimi, and H. A. Gabbar, “Enhanced Nature-Inspired Meta-Heuristic Algorithm for Microgrid Performance Improvement,” Electr. Power Components Syst., vol. 48, no. 4–5, pp. 459–470, 2020, doi: 10.1080/15325008.2020.1758843.
[5] V. Boddapati and A. S. R. Nandikatti, “Salient features of the national power grid and its management during an emergency: A case study in India,” Energy Sustain. Dev., vol. 59, pp. 170–179, Dec. 2020, doi: 10.1016/J.ESD.2020.10.010.
[6] Y. Xu, J. Zhang, W. Wang, A. Juneja, and S. Bhattacharya, “Energy Router: Architectures and Functionalities toward Energy Internet,” pp. 31–36, 2011.
[7] J. Abdella, K. Shuaib, and S. Harous, “Energy Routing Algorithms for the Energy Internet,” 9th Int. Conf. Intell. Syst. 2018 Theory, Res. Innov. Appl. IS 2018 – Proc., no. May 2019, pp. 80–86, 2018, doi: 10.1109/IS.2018.8710585.
[8] T. Zhu, S. Xiao, Y. Ping, D. Towsley, and W. Gong, “A secure energy routing mechanism for sharing renewable energy in smart microgrid,” 2011 IEEE Int. Conf. Smart Grid Commun. SmartGridComm 2011, no. August 2015, pp. 143–148, 2011, doi: 10.1109/SmartGridComm.2011.6102307.
[9] V. Boddapati and S. A. Daniel, “Performance analysis and investigations of grid-connected Solar Power Park in Kurnool, South India,” Energy Sustain. Dev., vol. 55, pp. 161–169, Apr. 2020, doi: 10.1016/J.ESD.2020.02.001.
[10] U. K. Umavathi M, “Simulation and Analysis of Solar-Wind Hybrid System Using an Efficient Multi-Port DC-DC Converter,” J. Adv. Res. Dyn. Control Syst., no. Spl.pp, pp. 1910–1918, 2017.
[11] Y. Liu, J. Li, Y. Wu, and F. Zhou, “Coordinated control of the energy router-based smart home energy management system,” Appl. Sci., vol. 7, no. 9, 2017, doi: 10.3390/app7090943.
[12] S. Nethravathi and M. Venkatakirthiga, “A Novel algorithm for Electric Vehicle charging scheduling with Renewable Energy Source,” IECON Proc. (Industrial Electron. Conf., vol. 2021-Oct., 2021, doi: 10.1109/IECON48115.2021.9589745.
[13] M. Suresh, J. Jayaraman, K. Lakshmanan, A. Gopikanna, and V. Vijayaraghavan, “Smart energy routing for rural islanded microgrid clusters,” 2020 IEEE Texas Power Energy Conf. TPEC 2020, pp. 0–5, 2020, doi: 10.1109/TPEC48276.2020.9042508.
[14] S. Li, P. Yi, Z. Huang, T. Xie, and T. Zhu, “Energy scheduling and allocation in electric vehicles energy internet,” 2016 IEEE Power Energy Soc. Innov. Smart Grid Technol. Conf. ISGT 2016, pp. 1–5, 2016, doi: 10.1109/ISGT.2016.7781233.
[15] G. R. Newsham, B. J. Birt, and I. H. Rowlands, “A comparison of four methods to evaluate the effect of a utility residential air-conditioner load control program on peak electricity use,” Energy Policy, vol. 39, no. 10, pp. 6376–6389, 2011, doi: 10.1016/j.enpol.2011.07.038.
[16] K. Phetsuwan and W. Pora, “A Direct Load Control Algorithm for Air Conditioners Concerning Customers’ Comfort,” 2018 IEEE Int. Conf. Consum. Electron. – Asia, ICCE-Asia 2018, pp. 7–10, 2018, doi: 10.1109/ICCE-ASIA.2018.8552133.
[17] P. Yazdkhasti and C. P. Diduch, “A Mathematical Model for the Aggregated Power Consumptions of Air Conditioners,” 2018 6th IEEE Int. Conf. Smart Energy Grid Eng. SEGE 2018, pp. 244–248, 2018, doi: 10.1109/SEGE.2018.8499491.
[18] C. Duan, X. Ding, F. Shi, X. Xiao, and P. Duan, “PMV-based fuzzy algorithms for controlling indoor temperature,” Proc. 2011 6th IEEE Conf. Ind. Electron. Appl. ICIEA 2011, pp. 1492–1496, 2011, doi: 10.1109/ICIEA.2011.5975826.
[19] R. Dharani, M. Balasubramonian, T. S. Babu, and B. Nastasi, “Load shifting and peak clipping for reducing energy consumption in an indian university campus,” Energies, vol. 14, no. 3, pp. 1–16, 2021, doi: 10.3390/en14030558.
[20] P. Muthuraju, M. Moghimi, R. Garmabdari, S. Stegen, J. Lu, and P. Kaparaju, “Conversion of University Commercial Buildings to Net-Zero Energy Buildings Employing Renewable Energy Sources,” Proc. – 2018 IEEE Int. Conf. Environ. Electr. Eng. 2018 IEEE Ind. Commer. Power Syst. Eur. EEEIC/I CPS Eur. 2018, pp. 2–7, 2018, doi: 10.1109/EEEIC.2018.8494608.
[21] G. Mylonas, D. Amaxilatis, S. Tsampas, and L. Pocero, “A Methodology for Saving Energy in Educational Buildings Using an IoT Infrastructure,” no. Iisa, 2019.
[22] P. O. Box and S. Arabia, “Energy Management in the Buildings of a University Campus in Saudi Arabia – A Case Study,” no. May, pp. 13–17, 2013.
[23] A. Ahmad et al., “An optimized home energy management system with integrated renewable energy and storage resources,” Energies, vol. 10, no. 4, pp. 1–35, 2017, doi: 10.3390/en10040549.
[24] M. J. Siddarth Sankar and K. Rahul Sharma, “Modified 0-1 knapsack problem for demand side management,” Int. J. Innov. Technol. Explor. Eng., vol. 8, no. 6 Special Issue 4, pp. 1–4, 2019, doi: 10.35940/ijitee.F1001.0486S419.
[25] A. Khan, N. Javaid, A. Ahmad, M. Akbar, Z. A. Khan, and M. Ilahi, “A priority-induced demand side management system to mitigate rebound peaks using multiple knapsack,” J. Ambient Intell. Humaniz. Comput., vol. 10, no. 4, pp. 1655–1678, 2019, doi: 10.1007/s12652-018-0761-z.
[26] U. Ali, U. Qamar, K. Wahab, and K. S. Arif, “A Knapsack Problem Based Algorithm for Local Level Management in Smart Grid,” Lect. Notes Data Eng. Commun. Technol., vol. 47, no. February, pp. 301–310, 2020, doi: 10.1007/978-3-030-39746-3\_32.
[27] T. Venkata Naga Jayudu, M. Rama Krishna Reddy, and C. Shoba Bindu, “Greedy knapsack based energy efficient routing in WMSNS,” Int. J. Innov. Technol. Explor. Eng., vol. 8, no. 10, pp. 1455–1461, 2019, doi: 10.35940/ijitee.A1015.0881019.
[28] R. G. Babukarthik, C. Dhasarathan, M. Kumar, A. Shankar, S. Thakur, and X. Cheng, “A novel approach for multi-constraints knapsack problem using cluster particle swarm optimization,” Comput. Electr. Eng., vol. 96, no. PA, p. 107399, 2021, doi: 10.1016/j.compeleceng.2021.107399.
[29] S. Nethravathi and V. Murali, “A Novel Residential Energy Management System Based on Sequential Whale Optimization Algorithm and Fuzzy Logic,” vol. 37, pp. 557–586, 2021, doi: 10.13052/dgaej2156-3306.3739.
[30] T. K. Lee, Z. Bareket, T. Gordon, and Z. S. Filipi, “Stochastic modeling for studies of real-world PHEV usage: Driving schedule and daily temporal distributions,” IEEE Trans. Veh. Technol., vol. 61, no. 4, pp. 1493–1502, 2012, doi: 10.1109/TVT.2011.2181191.
[31] C. J. (1984). Breiman, L., Friedman, J.H., Olshen, R.A., and Stone, Classification And Regression Trees (1st ed.). Routledge, 1984. doi: https://doi.org/10.1201/9781315139470.
[32] F. P.O., Thermal comfort, Analysis and application in environmental engineering, 1970th ed. McGraw Hill.
[33] C. Timplalexis, A. Dimara, S. Krinidis, and D. Tzovaras, “Thermal Comfort Metabolic Rate and Clothing Inference,” Lect. Notes Comput. Sci. (including Subser. Lect. Notes Artif. Intell. Lect. Notes Bioinformatics), vol. 11754 LNCS, pp. 690–699, 2019, doi: 10.1007/978-3-030-34995-0\_63.
[34] “Ergonomics of the Thermal Environment—Analytical Determination and Interpretation of Thermal Comfort Using Calculation of the PMV and PPD Indices and Local Thermal Comfort Criteria, ISO Standard 7730:2005, 2005.”
[35] K. Badiru, “Knapsack Problems; Methods, Models and Applications,” University of Oklahama.
[36] V. Boddapati, A. S. R. Nandikatti, and S. A. Daniel, “Techno-economic performance assessment and the effect of power evacuation curtailment of a 50 MWp grid-interactive solar power park,” Energy Sustain. Dev., vol. 62, pp. 16–28, 2021, doi: 10.1016/j.esd.2021.03.005.
[37] I. K. Umavathi M, Udhayakumar K, “Combined wind and PV residential energy system with single DC-DC (CUK) converter and 1-phase inverter to power grid,” J. Electr. Eng., vol. 17, no. 3, pp. 118–129, 2017.
Biographies

S. Nethravathi received bachelor’s degree in Electrical and Electronics Engineering and a master’s degree in Power Systems Engineering from Visvesvaraya Technological University, and currently working towards a doctorate at National Institute of Technology Tiruchirappalli. Her research areas include demand side management, internet of energy, and optimization techniques for energy management systems.

Venkatakirthiga Murali (M’13–SM’19) received B.E. degree in Electrical and Electronics from Bharathidasan University, Tiruchirappalli, India, in 2000, and the M.Tech. degree in Power Systems and the Doctorate degree in distributed generation and microgrids from the National Institute of Technology Tiruchirappalli (NITT), Tiruchirappalli, in 2004 and 2014, respectively. She is currently working as an Associate Professor with the Department of Electrical and Electronics Engineering, NITT. She has total teaching experience of 18 years. She is also serving as a reviewer to many reputed international journals. Her research interests include power systems, HVDC transmission systems, distribution systems, and electrical machines. She is also a Fellow Institution of Engineers, India.
Distributed Generation & Alternative Energy Journal, Vol. 38_2, 641–668.
doi: 10.13052/dgaej2156-3306.38212
© 2023 River Publishers