Techno-Economic and Environmental Based Approach for Planning of SDG and DSTATCOM with Impact of Network Reconfiguration using APSO and TLBO
Bikash Kumar Saw1,*, Aashish Kumar Bohre1, Jalpa Thakkar2 and Mohan Lal Kolhe3,*
1Department of Electrical Engineering, NIT Durgapur, West Bengal, Durgapur-713209, India
2Department of Electrical Engineering, UPL University of Sustainable Technology, Ankleshwar-393135, India
3Faculty of Engineering and Science, University of Agder, PO Box 422, NO 4604, Kristiansand, Norway
E-mail: bks.18ee1105@phd.nitdgp.ac.in; aashishkumar.bohre@ee.nitdgp.ac.in; jalpathakkar001@gmail.com; mohan.l.kolhe@uia.no
*Corresponding Author
Received 26 January 2023; Accepted 24 February 2023; Publication 10 July 2023
Abstract
A Multi Objective based Fitness Function (MO) is proposed for the optimum planning of multiple Solar Distributed Generation (SDG) and DSTATCOM with radial distribution network (RDN) reconfiguration impact for techno-economic and environmental benefit improvement. The Adaptive-Particle Swarm Optimization (APSO) and Teaching-Learning Based Optimization techniques (TLBO) are employed to accomplish this work. In the proposed MO, the Active Power Loss (AP), Reactive Power Loss (RP), System Voltage Deviation (SV), Fault-Current Level-of-Line (FCL), and System Service Reliability (SS) are considered. The economic-benefit measures along with Environmental Emissions Components (EEC) impact have also been considered in light of various system costs such as Fixed Capital Recovery Cost (FCR), Energy Loss Cost (EL) and Energy Not Supplied Cost (ENS). The novelty in the MO is the simultaneous consideration of FCL with AP, RP, SV, and SS along with EEC impact calculation. The IEEE 69 and 118 bus RDN is considered with three case studies to demonstrate the proposed methodology’s usefulness. The result analysis reveals that better performances can be obtained based on the considered MO in terms of environment-friendly techno-economic perspective, consistency, convergence, and computation time using TLBO rather than APSO.
Keywords: Solar-distributed generation, distribution STATic COMpensator, tie-switch, environmental emission components, adaptive-particle swarm optimization, teaching-learning based optimization.
List Abbreviations
| SDG | Solar-Distributed Generation |
| DSTATCOM | Distribution STATic COMpensator |
| RDN | Radial Distribution Network |
| TS | Tie-Switch |
| APSO | Adaptive-Particle Swarm Optimization |
| TLBO | Teaching-Learning Based Optimization |
| AP | Active Power Loss |
| RP | Reactive Power Loss |
| SV | System Voltage Deviation |
| FCL | Fault-Current Level-of-Line |
| SS | System Service Reliability |
| EEC | Environmental Emissions Components |
| FCR | Fixed Capital Recovery Cost |
| EL | Energy Loss Cost |
| ENS | Energy Not-Supplied Cost |
| IAP | Index of Active Power Loss |
| IRP | Index of Reactive Power Loss |
| ISV | Index of System Voltage Deviation |
| IFCL | Index of Fault-Current Level-of-Line |
| ISS | Index of System Service Reliability |
| MO | Multiple Objective based Fitness Function |
| P | Active Power generated from SDG |
| Q | Reactive Power generated from DSTATCOM |
1 Introduction
The distribution system is one of the vital parts of the power system. But nowadays, innovations in every area are rapidly increasing worldwide. These innovations and their mobilization in the society, increases the electricity demand for the distribution system. It causes severe techno-economic and environmental issues: power loss, poor voltage profile, lousy service reliability, economic loss and increased environmental emissions owing to many equipment failures. Hence, to meet the increased electricity demand, the different types of Distributed Generations (DGs) can be integrated by addressing the techno-economic and environmental issues.
The numerous DGs and their technology are discussed in [1]. The Backwards-Forward Sweep Load Flow Analysis (BFS-LFA) technique is explained in the literature [2] and [3]. In [4], Mixed Integer Non-Linear Programming (MINLP) was utilised in DG allocation for 33-bus and 69-bus IEEE RDN to reduce AP & SV. The APSO and TLBO are illustrated in [5] and [6], respectively. Researchers provided several methods for DG allocation-planning in the distribution system [7–9]. The many technologies that can be used in DGs to generate renewable energy close to the user side are listed in [10]. In [11–14], the authors have proposed optimal DG planning using the PSO, Bat Algorithm (BA) and Genetic Algorithm (GA) and their comparative analysis. The author of [15] introduces the minimization of loss and reliability indices as a goal via appropriate RDN reconfiguration. DGs are characterized in [16] according to how much power they inject. The different LFA techniques and IEEE test systems data are provided in [17]. The reconfiguration planning for 33-bus and 69-bus IEEE RDN has been completed in [18, 19] using GA and PSO. The many DG type concepts and how they are implemented utilising various ways to enhance system components are covered in [20–23]. The [24–27], provides an explanation of the planning of grid-connected and standalone hybrid renewable systems, including SDG and wind systems. In [28], a fuzzy-logic-based Non-dominant Sorting Genetic Algorithm NSGA-II (ENSGA-II) approach is used to maximise the network’s economic, technological, reliable, and environmental features. In contrast, in [29], using the Immune Algorithm (IA), the best position and size for DSTATCOM are obtained with less power loss, lower installation costs for DSTATCOM, and better bus voltage and current profiles. The best possible strategic planning for solar, batteries, and FACTS devices has been provided in [30, 31]. To reduce losses and total harmonic-distortion in voltage, DG planning has been done using an Evolutionary Algorithm (EA) [32]. The literature [33] explains reconfiguration planning with DG of a 33-bus and 69-bus IEEE RDN using the Mixed Integer Linear Programming (MILP) considering ZIP load model. In [34], a QP reduction planning approach for 69-bus IEEE RDN has been presented by optimally incorporating DGs and capacitors. In the 94-bus Portuguese practical RDN, the optimum sizing and placement of DGs have been implemented, where the noted results show that the AP and SV decreased to 77.82%, and 9.68%, respectively [35]. In [36], by taking into account the seasonal-variation of load and DGs based on the objective to reduce the SV, SS, and economic benefit with reduction in AP and greenhouse gas emission. The DGs have been implemented in an optimized reconfigured 33-bus and 69-bus IEEE RDN using hybrid PSO and Dragonfly Algorithm (DA). The [37] aims to enhance the 33-bus and 69-bus IEEE RDN planning via network reconfiguration and DG integration. This has been done to reduce the loss and improve the considered system quality of solution through data dispatch using Water Cycle Algorithm (WCA). The protective devices coordination planning with reconfiguration and DG integration has been carried out to reduce AP and SV, using Firefly Algorithm (FA) and EA for 33-bus, 69-bus, and 118-bus IEEE RDN, respectively, in [38]. In [39], 33-bus and 69-bus IEEE RDN with a real 83 bus system have considered reducing the annual energy loss by decreasing SV and AP using intelligent search-based TLBO (IS-TLBO) via reconfiguration with DG planning. The analysis for planning and operation of DGs, DSTATCOM, capacitor, and renewable resources has been carried out for various distribution networks using different optimization techniques [40–44]. In [45], the author has proposed a grid-connected hybrid micro-grid analysis with the impact of PE.
The above literature’s state-of-the-art review reveals that the distribution system experiences significant techno-economic and environmental issues such as AP, RP, SV, lousy SS and poor fault current tolerance capability, i.e., high FCL with huge EEC and cost. It causes the distribution system suffers from deprived service quality. Therefore, to improve the service quality of the distribution system, the AP, RP, SV, EEC and cost parameters are needs to be minimized with enhanced SS and FCL. It has also been noticed that none of the work in existing literatures had considered all these technical issues simultaneously as objectives for addressing the service quality of the distribution system. Hence, this is the motivation factor behind this proposed work with all these issues as novel MO. Therefore, in this work, the optimum planning of multiple SDG and DSTATCOM with reconfiguration impact for techno-economic and environmental benefit improvement is carried out efficiently using the APSO and TLBO techniques based on the considered MO.
Hence for the analysis, three case studies have been presented, (i) Proposed Study-0 (PS-0): Base case study, it is the case without any modification in the system, (ii) Proposed Study-1 (PS-1): optimum planning of multiple SDG & DSTATCOM, and (iii) Proposed Study-2 (PS-2): optimum planning of multiple SDG & DSTATCOM with RDN reconfiguration impact.
The proposed work of this paper is organized into following five sections: The Introduction and the Modelling of SDG and DSTATCOM are the first and second sections, respectively, of this five-section article. The Proposed Methodology and MO is presented in the third part. The fourth and fifth sections are devoted to Results & Discussion, and Conclusion, respectively, which conclude the projected work based on the techno-economic parameter with EEC impact taken into consideration.
The following are the originality and noteworthy contributions reported in this paper:
(1) This paper proposes an innovative MO which is comprised of five key technical problems such as AP, RP, SV, poor SS and high FCL, i.e., poor fault current tolerance capability.
(2) In the MO, an index for the improvement of tolerance level/capacity of fault (short circuit) current has been taken into account as an FCL.
(3) The system’s economic viewpoint has taken into account based on different costs: Fixed Capital Recovery Cost (FCR), Energy Loss Cost (EL), and Energy Not Supplied Cost (ENS).
(4) The impact of Environmental Emission Components (EEC): Carbon Dioxide (CO), Sulfur Dioxide (SO), & Nitrogen Oxide (NO) have also been considered as environmental performance parameters.
(5) By using the APSO and TLBO, the MO is optimised for the optimum SDG and DSTATCOM allocation while taking into account the effect of network reconfiguration.
(6) The comparative result analysis using APSO and TLBO has been presented to verify the suggested work’s techno-economic with environmental emission impact effectiveness for 69 and 118 bus IEEE RDN. The outcomes are also compared with more current published research.
2 Modelling of Solar Distributed Generation and DSTATCOM
Power generation from renewable SDG (P) can overcome power sector dependency on fossil-fuels [23, 24]. The formulas for calculating power output and efficiency are (1) and (2).
| (1) | |
| (2) |
Where is SDG output power, a is the area of the panel in meter square (m), and H is the incident solar-radiation which is measured in watts per square metre (W/m). Efficiency is calculated by the and in predetermined operating circumstances in established test scenarios (STC). The temperature of the cell is in degrees Celsius, and the coefficient is shown as a percentage per degrees Celsius.
The DSTATCOM is considered as a reactive power DG (Q) for this work. In (3) and (4), an estimation of the equation for the correction of angle and voltage by DSTATCOM current injection is given [27–31]. After installing DSTATCOM on the bus, the current and flow over the line simultaneously. The DSTATCOM’s reactive power injection for the bus voltage correction is shown in (5):
| (3) | |
| (4) | |
| (5) |
The injected current by DSTATCOM () and angle change () will become zero when the voltage is the same after and before installing DSTATCOM in the bus, that is when .
3 Proposed Methodology & Multi-Objective Fitness-Function
This section includes the formulation of novel MO and optimization techniques. The MO in (3) comprises significant core technical issues: indices for active power loss (IAP), reactive power loss (IRP), system voltage deviations (ISV), system service reliability (ISS) and Fault-Current Level-of-Line (IFCL), respectively.
| (6) |
The modelling of indices for the formulation of the novel MO are as follows:
| (7) | |
| (8) | |
| (9) | |
| (10) | |
| (11) |
The system cost parameters (FCR, EL, and ENS) are defined as [11]:
| (12) | |
| (13) | |
| (14) | |
| (15) |
Where, Proposed Study-0 (PS-0), Proposed Study-1 & 2 (PS-1 & PS-2), and V Voltage at each bus. The branch numbers, current of respective branch, BR branch resistance, main feeders BR branch cost, the fixed-cost annual-recovery rate, the factor of load, & factor of loss are represented by using the variables N, I, R, C, , , & .
Environmental Emission Components (EEC): CO, SO, and NO have also been considered as environmental performance parameters. It is assumed the grid utility that supplies power to the consumers has conventional generation as thermal power generation; hence the EEC are involved in it. These EEC have a detrimental impact on both the environment and human health. The CO, SO, and NO each have Pollutant Emission Factors (PE) of 632.0 g/kWh, 2.74 g/kWh, and 1.34 g/kWh, respectively [45].
| (16) |
This work is carried out using APSO and TLBO techniques [5, 6]. The optimal solution of the MO can be obtained using APSO and TLBO by initializing the system parameters as swarm and class, respectively. The detailed procedure to find the optimal solution for the presented work using APSO and TLBO based on the MO is given in Figure 1.
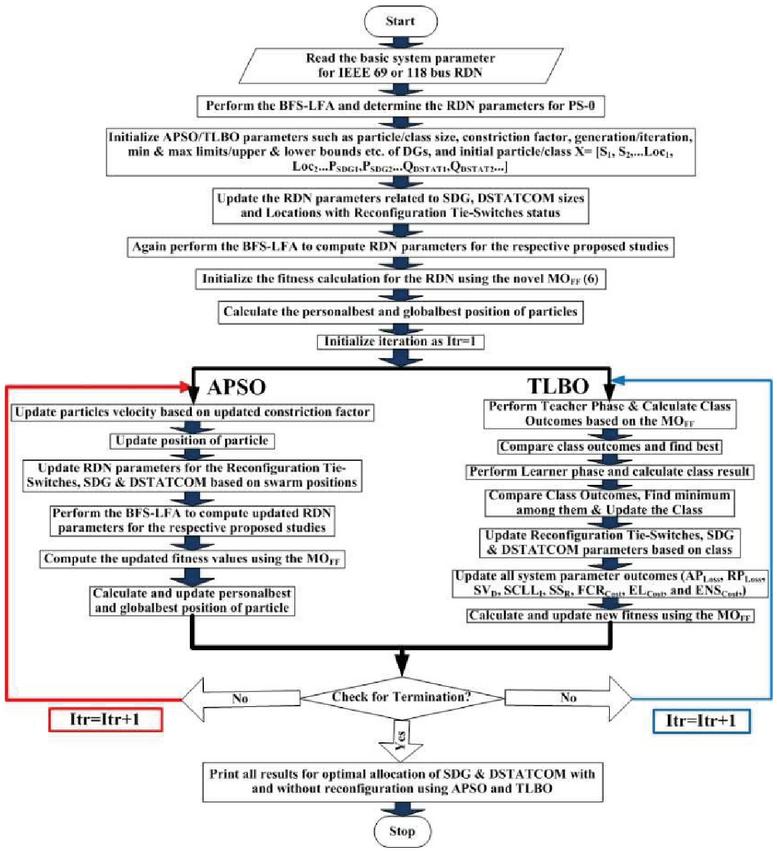
Figure 1 Flowchart for APSO & TLBO.
4 Results and Discussion
The optimum planning of multiple SDG and DSTATCOM with RDN reconfiguration impact using the APSO and TLBO based on the considered MO is presented in this work. For the result analysis of this work, the BFS-LFA has been used. The IEEE 69 [17] and 118 [38] bus RDN is considered with three case studies (PS-0, PS-1 and PS-2) to demonstrate the proposed methodology’s effectiveness.
4.1 Analysis of 69-Bus IEEE RDN
The obtained results using APSO and TLBO for PS-0, PS-1 and PS-2 are illustrated in Tables 2–5 and Figures 2–5 in a comparative manner. In PS-0, the AP is 0.225 MW, RP is 0.1022 MVAr, maximum SV is 0.1908 p.u., FCL is 6.6534 kA, and the SS is 84.36%, as shown in Table 3 and Figures 3–5. In this case, the CO is 2546.96 kg/h, SO is 11.0422 kg/h, and NO is 5.4002 kg/h, as tabulated in Table 5.
In PS-1 using APSO, the three SDG (P) and three DSTATCOM (Q) are optimally allocated at buses 51, 50 and 62 with their respective optimal sizes as shown in Table 2. For this implementation, the MO is converged and minimized to 0.1094 in 100 trials (T) for 100 iterations with an approximate computation time (t) of 1083.4572 seconds per T. Hence, it’s a global solution of APSO for MO optimization, as illustrated in Table 2 and Figure 2(a). The PS-1 result analysis shows that the AP is 0.0168 MW, RP is 0.0081 MVAr, and the maximum SV is 0.1217 p.u. In addition, the FCL is 0.4234 kA, and the SS is 95.97%, demonstrated in Table 3 and Figures 3(a)–5(a). Consequently, the economic benefit characteristics have improved with a reduced total cost of 25129.2262 $/year, which was 112876.87 $/year in PS-0. It has been achieved because the FCR, EL, and ENS are reduced to 18230.3271, 5842.7864 and 1056.1127 $/year, respectively, given in Table 4. The environmental emissions CO, SO, and NO are decreased to 1219.0648 kg/h, 5.2852 kg/h, and 2.5847 kg/h compared to PS-0, i.e., the PS-0 has more influence of EECs as shown in Table 5.
Table 1 Optimal Location and Sizes of SDG and DSTATCOM with Tie-Switch Status in 69 and 118 bus RDN
| Optimal | Tie-Switch Status | |||||||||
| P (MW) | Q (MVAr) | Location | (S-S for 69-Bus & | Test | ||||||
| Cases | P | P | P | Q | Q | Q | (Loc) | S-S for 118-Bus) | Technique | System |
| PS-0 | — | — | — | — | — | — | — | — | — | 69-Bus |
| PS-1 | 1.04 | 1.17 | 1.63 | 0.45 | 0.33 | 1.24 | 51, 50, 62 | — | APSO | |
| PS-2 | 1.58 | 2.23 | 0.49 | -0.31 | 1.30 | 0.43 | 28, 61, 20 | 1, 1, 1, 0, 1 | ||
| PS-1 | 1.84 | 0.40 | 1.50 | 1.02 | 0.49 | 0.28 | 61, 24, 49 | — | TLBO | |
| PS-2 | 0.68 | 1.83 | 3.40 | 1.09 | 1.43 | -0.88 | 11, 62, 4 | 1, 1, 1, 1, 1 | ||
| PS-0 | — | — | — | — | — | — | — | — | — | 188-Bus |
| PS-1 | 2.88 | 2.63 | 4.38 | 7.72 | 1.75 | 0.66 | 29, 74, 50 | — | APSO | |
| PS-2 | 7.57 | 0.00 | 2.41 | -0.72 | 0.61 | 0.90 | 7, 118, 111 | 1, 1, 1, 1, 1, 1, 1, 1, 1 | ||
| PS-1 | 4.64 | 2.43 | 2.01 | 3.79 | 1.84 | 3.33 | 32, 75, 113 | — | TLBO | |
| PS-2 | 3.52 | 2.38 | 7.01 | 2.40 | 1.00 | 1.75 | 65, 112, 5 | 1, 1, 1, 1, 1, 1, 1, 1, 1 | ||
Table 2 The MO of 69-bus and 118-bus IEEE RDN
| Study/ | Trial | |||||||||||||||
| Technique | IAP | IRP | ISV | IFCL | ISS | MO | Computation Time | Run | ||||||||
| For | Test | |||||||||||||||
| Technique | APSO | TLBO | APSO | TLBO | APSO | TLBO | APSO | TLBO | APSO | TLBO | APSO | TLBO | APSO | TLBO | Both | System |
| PS-1 | 0.0749 | 0.0571 | 0.0791 | 0.0738 | 0.1107 | 0.0092 | 0.0636 | 0.0281 | 0.2580 | 0.1987 | 0.1094 | 0.0607 | 1083.4572 | 978.5176 | 100 | 69-Bus |
| PS-2 | 0.0426 | 0.0486 | 0.0576 | 0.0585 | 0.0970 | 0.0070 | 0.0604 | 0.0210 | 0.2564 | 0.1224 | 0.0834 | 0.0547 | 1189.8050 | 1077.5111 | 100 | |
| PS-1 | 0.5544 | 0.3842 | 0.5148 | 0.3651 | 0.0947 | 0.0445 | 0.3791 | 0.5307 | 0.6003 | 0.7140 | 0.4099 | 0.3504 | 2208.7320 | 1707.7821 | 100 | 118-Bus |
| PS-2 | 0.3243 | 0.2671 | 0.3516 | 0.2394 | 0.0429 | 0.0332 | 0.3519 | 0.3748 | 0.5800 | 0.5971 | 0.2891 | 0.2522 | 2472.1958 | 2181.1785 | 100 |
Table 3 AP, RP, SV, FCL, and SS of both the systems
| Study/ | |||||||||||
| Technique | AP (MW) | RP (MVAr) | SV (p.u.) | FCL (kA) | SS in % | Test | |||||
| Technique | APSO | TLBO | APSO | TLBO | APSO | TLBO | APSO | TLBO | APSO | TLBO | System |
| PS-0 | 0.225 | 0.225 | 0.1022 | 0.1022 | 0.1908 | 0.1908 | 6.6534 | 6.6534 | 84.36 | 84.36 | 69-Bus |
| PS-1 | 0.0168 | 0.0128 | 0.0081 | 0.0075 | 0.1217 | 0.1053 | 0.4234 | 0.1914 | 95.97 | 96.61 | |
| PS-2 | 0.0109 | 0.0102 | 0.0059 | 0.0040 | 0.1067 | 0. 1070 | 0.4018 | 0.0006 | 95.99 | 98.14 | |
| PS-0 | 1.2981 | 1.2981 | 0.9787 | 0.9787 | 0.2312 | 0.2312 | 22.7339 | 22.7339 | 98.33 | 98.33 | 188-Bus |
| PS-1 | 0.7197 | 0.4987 | 0.5039 | 0.3574 | 0.1947 | 0.1445 | 8.6183 | 12.0640 | 99.00 | 98.81 | |
| PS-2 | 0.4210 | 0.3468 | 0.3441 | 0.2343 | 0.1429 | 0.1332 | 8.0008 | 8.5201 | 99.03 | 99.00 | |
Table 4 The FCR, ENS, and EL
| Study/ | |||||||||
| Technique | FCR ($/Year) | EL ($/Year) | ENS ($/Year) | Total Cost ($/Year) | Test | ||||
| Technique | APSO | TLBO | APSO | TLBO | APSO | TLBO | APSO | TLBO | System |
| PS-0 | 18230.3271 | 18230.3271 | 78051.833 | 78051.833 | 16594.715 | 16594.715 | 112876.87 | 112876.87 | 69-Bus |
| PS-1 | 18230.3271 | 18230.3271 | 5842.7864 | 3795.1948 | 1056.1127 | 631.8908 | 25129.2262 | 22657.4126 | |
| PS-2 | 18247.2055 | 18247.2055 | 3322.2765 | 3677.7492 | 1002.1959 | 347.8743 | 22571.6779 | 22272.8290 | |
| PS-0 | 33338.9837 | 33338.9837 | 450302.7888 | 450302.7888 | 56701.8942 | 56701.8942 | 540343.6667 | 540343.6667 | 188-Bus |
| PS-1 | 33338.9837 | 33338.9837 | 249649.9576 | 173002.3069 | 21495.4521 | 30089.5192 | 304484.3934 | 236430.8097 | |
| PS-2 | 38151.9331 | 38151.9331 | 146030.8638 | 120290.2567 | 19955.3341 | 21250.4248 | 204138.1310 | 179692.6147 | |
Table 5 Environmental Emission (E) in PS-0, PS-1, and PS-2 for 69 and 118 bus RDN
| E in PS-0 (kg/h) | E in PS-1 (kg/h) | E in PS-2 (kg/h) | Test | ||||
| EEC | APSO | TLBO | APSO | TLBO | APSO | TLBO | System |
| CO | 2546.96 | 2546.96 | 1219.0648 | 705.4584 | 473.4312 | 352.5296 | 69-Bus |
| SO | 11.0422 | 11.0422 | 5.2852 | 3.0584 | 2.0525 | 1.5283 | |
| NO | 5.4002 | 5.4002 | 2.5847 | 1.4957 | 1.0038 | 0.7474 | |
| CO | 15174.32 | 15174.32 | 8930.16 | 8563.60 | 8310.80 | 6408.48 | 188-Bus |
| SO | 65.7874 | 65.7874 | 38.7162 | 37.1270 | 36.0310 | 27.7836 | |
| NO | 32.1734 | 32.1734 | 18.9342 | 18.1570 | 17.6210 | 13.5876 | |
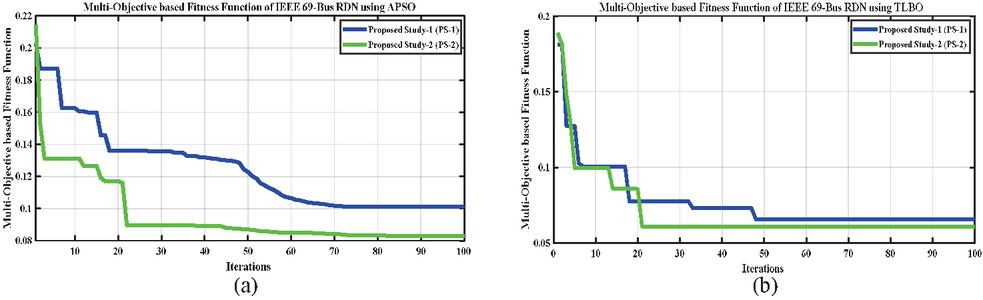
Figure 2 MO of the 69-bus IEEE RDN using; (a) APSO, (b) TLBO.
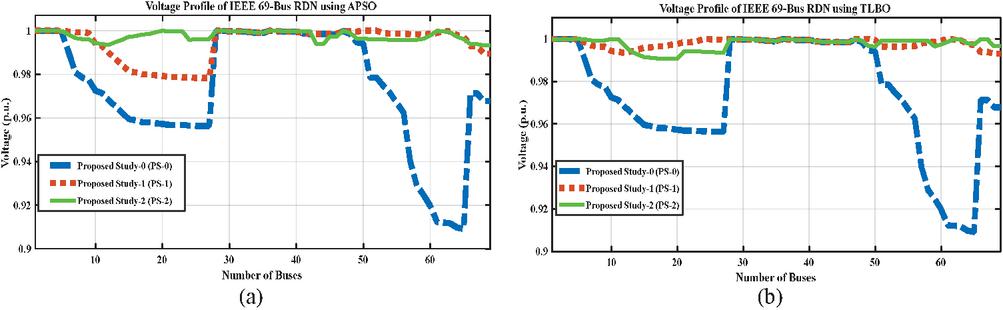
Figure 3 System voltage profile of 69-bus IEEE RDN using; (a) APSO, (b) TLBO.
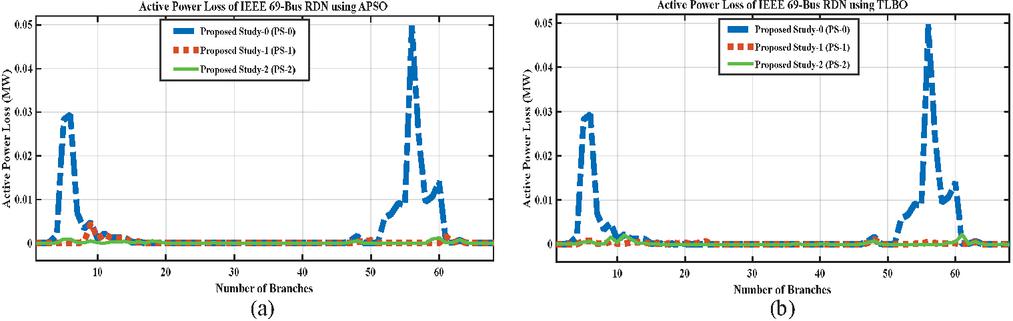
Figure 4 Active Power Loss of 69-bus IEEE RDN using; (a) APSO, (b) TLBO.
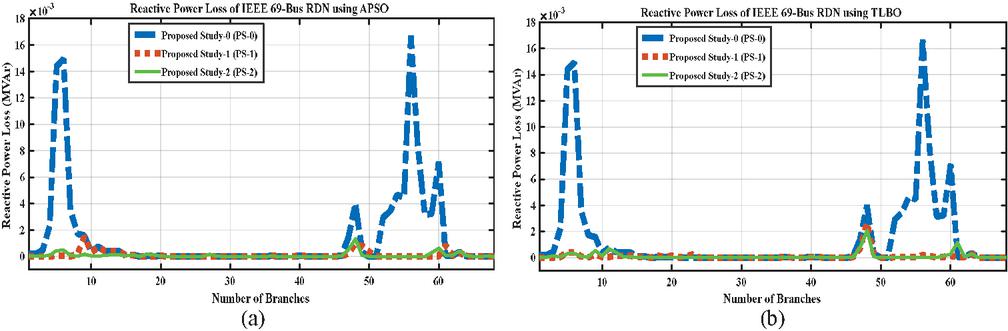
Figure 5 Reactive Power Loss of 69-bus IEEE RDN using; (a) APSO, (b) TLBO.
In PS-2 using APSO, the three P and three Q are optimally allocated at buses 28, 61 and 20 with the impact of five reconfiguration tie-switches. If any tie-switch (S) is active, then S will be 1; else, 0. The optimal values of P, Q and S are given in Table 2. The optimized value of MO using APSO is converged at 0.0834 in 100 T for 100 iterations with an approximate t of 1189.8050 seconds per T, as illustrated in Table 2 and Figure 2(a). The PS-2 result includes the AP of 0.0109 MW, RP of 0.0059 MVAr, maximum SV of 0.1067 p.u., FCL of 0.4018 kA, and SS of 95.99%, are illustrated in Table 3 and Figures 3(a)–5(a) respectively. Afterwards, the total cost is reduced to 22571.6779 $/year, which was 112876.87 $/year in PS-0, which reveals economic benefit improvement. It has been achieved as the FCR, EL, and ENS are reduced to 18247.2055, 3322.2765 and 1002.1959 $/year, respectively, given in Table 4. The production of CO, SO, and NO has also been decreased in PS-2 using APSO with the value of 473.4312 kg/h, 2.0525 kg/h, and 1.0038 kg/h, respectively compared with PS-0 and PS-1 as seen in Table 5.
Similarly, the implementation of PS-1 and PS-2 using TLBO is performed, and its corresponding optimal values for P, Q, bus locations and S are tabulated in Table 2. For PS-1, the MO is optimized to 0.0607 in 100 T for 100 iterations with an approximate t of 978.5176 seconds per T, as given in Table 2 and Figure 2(b). The PS-1 outcomes reveal that the AP is 0.0128 MW, RP is 0.0075 MVAr, maximum SV is 0.1053 p.u., FCL is 0.1914 kA, and SS is 96.61%, shown in Table 3 and Figures 3(b)–5(b). The cost related to FCR, EL, and ENS are reduced to 18230.3271, 3795.1948 and 631.8908 $/year, respectively, given in Table 4. Inevitably, the economic benefit has enhanced with a reduced total cost of 22657.4126 $/year, which was 112876.87 $/year in PS-0. The reduced EECs such as CO, SO, and NO are 705.4584 kg/h, 3.0584 kg/h, and 1.4957 kg/h, respectively compared to PS-0, which can be seen in Table 5.
Interestingly for PS-2 implementation, the MO is optimized to 0.0547 using TLBO in 100 T for 100 iterations with an approximate t of 1077.5111 seconds per T which is a global solution, illustrated in Table 2 and Figure 2(b). The PS-2 results using TLBO include the AP of 0.0102 MW, RP of 0.0040 MVAr, maximum SV of 0. 1070 p.u., FCL of 0.0006 kA, and SS of 98.14%, shown in Table 3 and Figures 3(b)–5(b). Consequently, the economic benefit characteristics have been increased with a reduced total cost of 22272.8290 $/year, which was 112876.87 $/year in PS-0. It has been achieved as the FCR, EL, and ENS are reduced to 18247.2055, 3677.7492 and 347.8743 $/year, respectively, given in Table 4. The production of EECs viz CO, SO, and NO are reduced to 352.5296 kg/h, 1.5283 kg/h, and 0.7474 kg/h, respectively as presented in Table 5. This is because the most percentage of the demand power is supplied by the planned renewable SDGs.
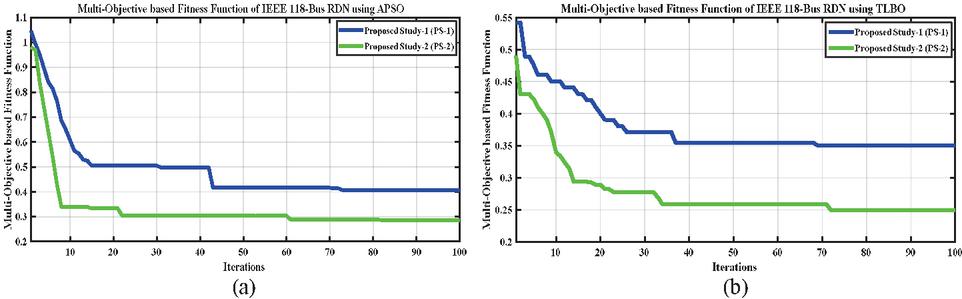
Figure 6 MO of the 118-bus IEEE RDN using; (a) APSO, (b) TLBO.
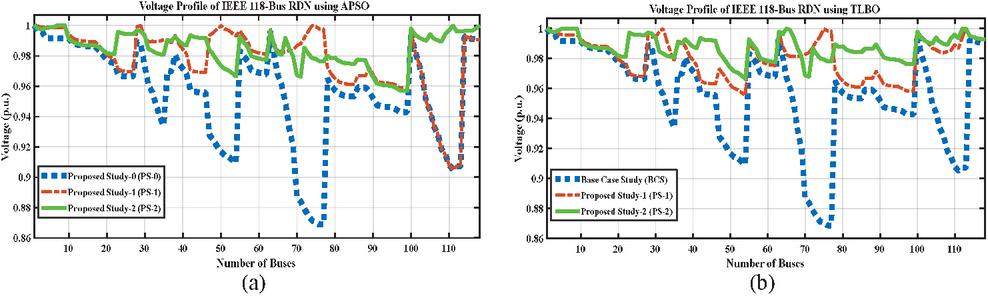
Figure 7 System voltage profile or system voltage deviation of 118-bus IEEE RDN using; (a) APSO, (b) TLBO.
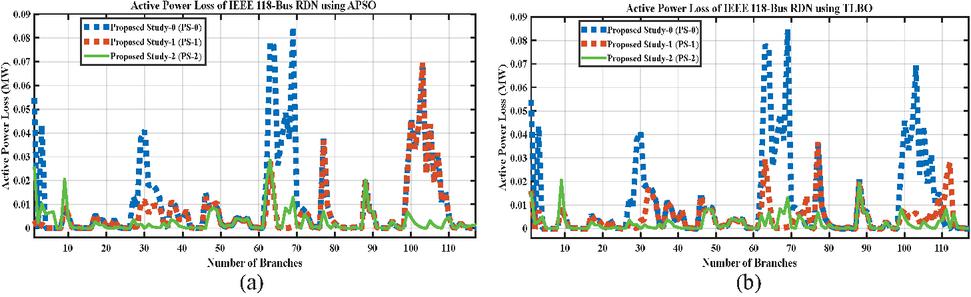
Figure 8 Active Power Loss of 118-bus IEEE RDN using; (a) APSO, (b) TLBO.
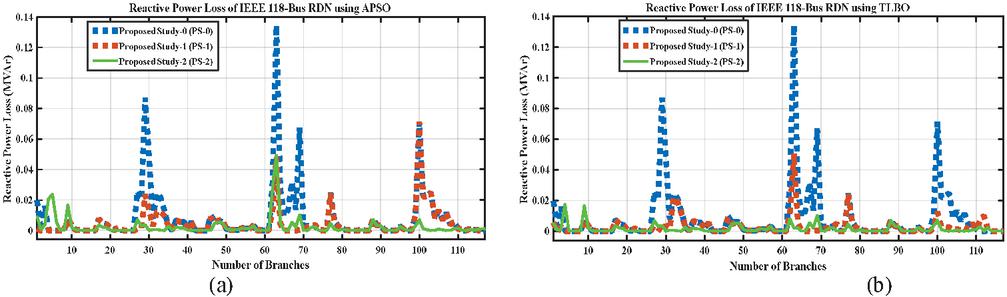
Figure 9 Reactive Power Loss of 118-bus IEEE RDN using; (a) APSO, (b) TLBO.
4.2 Analysis of 118-Bus IEEE RDN
The comparative result analysis of 118 bus RDN for PS-0, PS-1 and PS-2 using APSO and TLBO is illustrated in Tables 2 to 5 and Figures 6 to 9. For PS-0, the AP is 1.2981 MW, RP is 0.9787 MVAr, maximum SV is 0.2312 p.u., FCL is 22.7339 kA, and the SS is 98.33%, demonstrated in Table 3 and Figures 7–9. In this case, the CO is 15174.32 kg/h, SO is 65.7874 kg/h, and NO is 32.1734 kg/h, as tabulated in Table 5.
The implementation of three P and three Q in PS-1 using APSO are simultaneously allocated at buses 29, 74 and 50 with their optimal sizes, as shown in Table 2. Hence for PS-1, the MO is optimized to 0.4099 using APSO in 100 T for 100 iterations with an approximate t of 2208.7320 seconds per T, illustrated in Table 2 and Figure 6(a). With this PS-1 implementation, the AP, RP, maximum SV, and FCL are reduced to 0.7197 MW, 0.5039 MVAr, 0.1947 p.u., and 8.6183 kA, respectively, mentioned in Table 3 and Figures 7(a)–9(a). In addition, the economic benefit and SS have also improved; their related values are given in Table 4. The environmental emissions CO, SO, and NO are decreased to 8930.16 kg/h, 38.7162 kg/h, and 18.9342 kg/h compared to PS-0, i.e., the PS-0 has more influence of EECs as shown in Table 5.
In PS-2 using APSO, the simultaneous optimal placement of three P and three Q at 7, 118 and 111 buses are carried out with the impact of nine reconfiguration tie-switches. The optimal values of P, Q and S are given in Table 2. The MO is optimized to 0.2891 in 100 T for 100 iterations with an approximate t of 2472.1958 seconds per T for PS-2 using APSO. It is clear that this is a global solution of APSO for this MO optimization, illustrated in Table 2 and Figure 6(a). These DGs allocations in PS-2 reveal a reduction in AP, RP, and maximum SV, with enhanced fault current tolerance capability and SS, as illustrated in Table 3 and Figures 7(a)–9(a). In the same instance, the total cost is reduced to 204138.1310 $/year, as it was 540343.6667 $/year in PS-0; hence the economic benefit has increased. It’s achieved as the FCR, EL, and ENS are reduced to 38151.9331, 146030.8638 and 19955.3341 $/year, respectively, given in Table 4. The production of CO, SO, and NO has also decreased in PS-2 using APSO with the value of 8310.80 kg/h, 36.0310 kg/h, and 17.6210 kg/h, respectively compared with PS-0 and PS-1 as seen in Table 5.
Similarly, using TLBO, the PS-1 and PS-2 are implemented separately, and their corresponding optimal values for P, Q, bus locations and S are tabulated in Table 2. For PS-1, MO is optimized and converged at 0.3504 in 100 T for 100 iterations with an approximate t of 1707.7821 seconds per T, illustrated in Table 2 and Figure 6(b). The obtained technical parameters result includes the AP of 0.4987 MW, RP of 0.3574 MVAr, maximum SV of 0.1445 p.u., FCL of 12.0640 kA, and SS of 98.81%, given in Table 3 and Figures 5(b)–7(b). Correspondingly, the economic benefit has increased with the reduction in FCR of 33338.9837, EL of 173002.3069, and ENS 30089.5192 $/year, respectively, given in Table 4. The reduced EECs such as CO, SO, and NO are 8563.60 kg/h, 37.1270 kg/h, and 18.1570 kg/h, respectively compared to PS-0, which can be seen in Table 5.
Table 6 Comparison of the proposed work with other already-published works of 69-bus and 118-bus RDN
| Existed/Work | Method of | 69-Bus RDN Loss (kW) | 118-Bus RDN Loss (kW) | ||
| Proposed | Optimization | Magnitude | % Reduction | Magnitude | % Reduction |
| Rahim, M. N. A., | FA | 126.8 | 43.64 | 659.17 | 49.22 |
| et al. [38] | EA | 150.4 | 33.15 | 712.29 | 45.12 |
| Kanwar, Neeraj, | TLBO | 42.25 | 81.22 | — | — |
| et al. [39] | IS-TLBO | 39.63 | 82.38 | — | — |
| Proposed | APSO | 10.9 | 95.15 | 421.00 | 67.57 |
| Work | TLBO | 10.2 | 95.47 | 346.80 | 73.28 |
Finally, for PS-2, the MO is converged and optimized to 0.2522 value using TLBO in 100 T for 100 iterations with an approximate t of 2181.1785 seconds per T, shown in Table 2 and Figure 6(b). The obtained results include the AP of 0.3468 MW, RP of 0.2343 MVAr, maximum SV of 0.1332 p.u., FCL of 8.5201 kA, and SS of 99.00%, shown in Table 3 and Figures 7(b)–9(b). Consequently, the economic benefit characteristics have improved with a reduced total cost of 179692.6147 $/year, which was 540343.6667 $/year in PS-0. It has been achieved because the FCR, EL, and ENS are reduced to 38151.9331, 120290.2567 and 21250.4248 $/year, respectively, given in Table 4. The production of EECs viz CO, SO, and NO are reduced to 6408.48 kg/h, 27.7836 kg/h, and 13.5876 kg/h, respectively as presented in Table 5. This is because the most percentage of the demand power is supplied by the planned renewable SDGs.
Hence the final proposed work, i.e., PS-2 results using APSO and TLBO, are compared with existing research from the literature [38, 39] in Table 6 and evaluated its efficacy. As a result of this analysis, it is noted that the Table 3 results are significantly better than the existing ones.
5 Conclusion
This paper proposes a techno-economic and environmental based approach for the optimum planning of multiple SDG and DSTATCOM with network reconfiguration impact. The APSO and TLBO techniques are employed to accomplish this work. In the MO, the AP, RP, SV, FCL, and SS of the RDN are simultaneously considered to enhance the service quality of the distribution system. The economic-benefit measures, along with the impact of environmental emission components, have also been addressed in light of various system costs, such as FCR, EL, and ENS. The IEEE 69 and 118 bus RDN are considered with three case studies to demonstrate the effectiveness of the proposed methodology. These three case studies (PS-0, PS-1, and PS-2) results for 69 and 118 bus RDN are presented in the result and discussion section in a close comparative manner for analysis using the APSO and TLBO. In this analysis, the value of AP is 0.0096 & 0.0102 MW, RP is 0.0059 & 0.0040 MVAr, SV is 0.1067 & 0.1070 p.u., and SS is 95.99% & 98.14%, respectively are achieved using APSO & TLBO for PS-2 of 69 bus RDN. In contrast, the FCL is reduced to 0.4018 & 0.0006 kA, which was 6.6534 kA in PS-0 using APSO & TLBO. Consequently, the fault current tolerance capability of the RDN has improved by 93.96% & 99.99%. Similarly, for 118 bus RDN, in PS-2 using APSO & TLBO, the AP is 0.4210 & 0.3468 MW, RP is 0.3441 & 0.2343 MVAr, SV is 0.1429 0.1332 p.u., and SS is 99.03% & 99.00%, respectively. In contrast, the FCL is 8.0008 & 8.5201 kA, which was 22.7339 kA in PS-0 using APSO & TLBO. Consequently, the fault current tolerance capability of the RDN has improved by 64.81% & 62.52%. It has also been noticed that the environmental emissions, total cost, and total power generation for both 69 and 118 bus RDNs have decreased; therefore, the system’s environmental and economic benefits have improved. The comparative result analysis reveals that better performances have been achieved based on the considered MO in terms of techno-economic and environmental perspective, consistency, convergence, and computation time using TLBO rather than APSO. Hence, the proposed work based on the novel MO is superior compared to the existing ones, which signifies the usefulness of this work.
References
[1] Ackermann, Thomas, Göran Andersson, and Lennart Söder. “Distributed generation: a definition.” Electric power systems research 57.3 (2001): 195–204.
[2] Teng, Jen-Hao. “A direct approach for distribution system load flow solutions.” IEEE Transactions on power delivery 18.3 (2003): 882–887.
[3] Díaz, Guzmán, Javier Gómez-Aleixandre, and José Coto. “Direct backward/forward sweep algorithm for solving load power flows in AC droop-regulated microgrids.” IEEE Transactions on Smart Grid 7.5 (2015): 2208–2217.
[4] Alam, Afroz, et al. “Power loss minimization in a radial distribution system with distributed generation.” 2018 International Conference on Power, Energy, Control and Transmission Systems (ICPECTS). IEEE, 2018.
[5] Zhan, Zhi-Hui, et al. “Adaptive particle swarm optimization.” IEEE Transactions on Systems, Man, and Cybernetics, Part B (Cybernetics) 39.6 (2009): 1362–1381.
[6] Kumar, Sumit, et al. “Multi-objective teaching-learning-based optimization for structure optimization.” Smart Science 10.1 (2022): 56–67.
[7] Kennedy, James, and Russell Eberhart. “Particle swarm optimization.” Proceedings of ICNN’95-international conference on neural networks. Vol. 4. IEEE, 1995.
[8] Eberhart, Russell, and James Kennedy. “A new optimizer using particle swarm theory.” MHS’95. Proceedings of the Sixth International Symposium on Micro Machine and Human Science. IEEE, 1995.
[9] Haddow, B. P., and G. Tufte. “Goldberg DE Genetic Algorithms in Search, Optimization and Machine Learning.” Addison-Wesley Longman Publishing Co. In Proceedings of the 2000 Congress on, 2010.
[10] Dulãu, Lucian Ioan, Mihail Abrudean, and Dorin Bicã. “Distributed generation technologies and optimization.” Procedia Technology 12 (2014): 687–692.
[11] Bohre, Aashish Kumar, Ganga Agnihotri, and Manisha Dubey. “Optimal sizing and sitting of DG with load models using soft computing techniques in practical distribution system.” IET generation, transmission & distribution 10.11 (2016): 2606–2621.
[12] El-Zonkoly, A. M. “Optimal placement of multi-distributed generation units including different load models using particle swarm optimization.” IET generation, transmission & distribution 5.7 (2011): 760–771.
[13] Ochoa, Luis F., Antonio Padilha-Feltrin, and Gareth P. Harrison. “Evaluating distributed time-varying generation through a multi-objective index.” IEEE Transactions on Power Delivery 23.2 (2008): 1132–1138.
[14] Prakash, Ram, and B. C. Sujatha. “Optimal placement and sizing of DG for power loss minimization and VSI improvement using bat algorithm.” 2016 National Power Systems Conference (NPSC). IEEE, 2016.
[15] Sedighizadeh, M., M. Esmaili, and M. M. Mahmoodi. “Reconfiguration of distribution systems to improve reliability and reduce power losses using imperialist competitive algorithm.” Iranian Journal of Electrical and Electronic Engineering 13.3 (2017): 287–302.
[16] Prakash, D. B., and C. Lakshminarayana. “Multiple DG placements in distribution system for power loss reduction using PSO algorithm.” Procedia technology 25 (2016): 785–792.
[17] R. D. Zimmerman, C. E. Murillo-S´anchez (2020). Matpower (Version 7.1) [Software]. Available: https://matpower.orgdoi:10.5281/zenodo.4074135.
[18] Swarnkar, Anil, Nikhil Gupta, and K. R. Niazi. “A novel codification for meta-heuristic techniques used in distribution network reconfiguration.” Electric Power Systems Research 81.7 (2011): 1619–1626.
[19] Reddy, AV Sudhakara, and M. Damodar Reddy. “Optimization of network reconfiguration by using particle swarm optimization.” 2016 IEEE 1st International Conference on Power Electronics, Intelligent Control and Energy Systems (ICPEICES). IEEE, 2016.
[20] Hien, Nguyen Cong, Nadarajah Mithulananthan, and Ramesh C. Bansal. “Location and sizing of distributed generation units for loadabilty enhancement in primary feeder.” IEEE systems journal 7.4 (2013): 797–806.
[21] Hung, Duong Quoc, and Nadarajah Mithulananthan. “Multiple distributed generator placement in primary distribution networks for loss reduction.” IEEE Transactions on industrial electronics 60.4 (2011): 1700–1708.
[22] Hung, Duong Quoc, Nadarajah Mithulananthan, and R. C. Bansal. “Analytical expressions for DG allocation in primary distribution networks.” IEEE Transactions on energy conversion 25.3 (2010): 814–820.
[23] Georgilakis, Pavlos S., and Nikos D. Hatziargyriou. “Optimal distributed generation placement in power distribution networks: models, methods, and future research.” IEEE Transactions on power systems 28.3 (2013): 3420–3428.
[24] Sawle, Yashwant, S. C. Gupta, and Aashish Kumar Bohre. “Review of hybrid renewable energy systems with comparative analysis of off-grid hybrid system.” Renewable and Sustainable Energy Reviews 81 (2018): 2217–2235.
[25] Lujano-Rojas, Juan M., Rodolfo Dufo-Lopez, and José L. Bernal-Agustín. “Technical and economic effects of charge controller operation and coulombic efficiency on stand-alone hybrid power systems.” Energy Conversion and management 86 (2014): 709–716.
[26] Olatomiwa, Lanre, et al. “Economic evaluation of hybrid energy systems for rural electrification in six geo-political zones of Nigeria.” Renewable Energy 83 (2015): 435–446.
[27] Giraud, Francois, and Zyiad M. Salameh. “Steady-state performance of a grid-connected rooftop hybrid wind-photovoltaic power system with battery storage.” IEEE transactions on energy conversion 16.1 (2001): 1–7.
[28] Ghatak, Sriparna Roy, Surajit Sannigrahi, and Parimal Acharjee. “Multi-objective approach for strategic incorporation of solar energy source, battery storage system, and DSTATCOM in a smart grid environment.” IEEE Systems Journal 13.3 (2018): 3038–3049.
[29] Taher, Seyed Abbas, and Seyed Ahmadreza Afsari. “Optimal location and sizing of DSTATCOM in distribution systems by immune algorithm.” International Journal of Electrical Power & Energy Systems 60 (2014): 34–44.
[30] Hosseini, Mehdi, and Heidar Ali Shayanfar. “Regular paper modeling of series and shunt distribution FACTS devices in distribution systems load flow.” J. Electrical Systems 4.4 (2008): 1–12.
[31] Acha, Enrique, et al. FACTS: modelling and simulation in power networks. John Wiley & Sons, 2004.
[32] Kadir, Aida Fazliana Abdul, et al. “Optimal placement and sizing of distributed generations in distribution systems for minimizing losses and THD_v using evolutionary programming.” Turkish Journal of Electrical Engineering & Computer Sciences 21. Sup. 2 (2013): 2269–2282.
[33] Gupta, Yusuf, et al. “Volt–Var Optimization and Reconfiguration: Reducing Power Demand and Losses in a Droop-Based Microgrid.” IEEE Transactions on Industry Applications 57.3 (2021): 2769–2781.
[34] Mahmoud, Karar, and Matti Lehtonen. “Simultaneous allocation of multi-type distributed generations and capacitors using generic analytical expressions.” IEEE Access 7 (2019): 182701–182710.
[35] Malik, Muhammad Zeeshan, et al. “Strategic planning of renewable distributed generation in radial distribution system using advanced MOPSO method.” Energy Reports 6 (2020): 2872–2886.
[36] Vempalle, Rafi, and P. K. Dhal. “Optimal Placement of Distributed Generators in Optimized Reconfigure. Radial Distribution Network using PSO-DA Optimization Algorithm.” 2020 International Conference on Advances in Computing, Communication & Materials (ICACCM). IEEE, 2020.
[37] Muhammad, Munir Azam, et al. “Distribution network planning enhancement via network reconfiguration and DG integration using dataset approach and water cycle algorithm.” Journal of Modern Power Systems and Clean Energy 8.1 (2019): 86–93.
[38] Rahim, Mohamad Norshahrani Abdul, et al. “Protection coordination toward optimal network reconfiguration and DG sizing.” IEEE Access 7 (2019): 163700–163718.
[39] Kanwar, Neeraj, et al. “Optimal allocation of DGs and reconfiguration of radial distribution systems using an intelligent search-based TLBO.” Electric Power Components and Systems 45.5 (2017): 476–490.
[40] Singh, Bharat, and Ashwani Kumar Sharma. “Impact of D-STATCOM and OLTC with Integrated Volt/var Control in Distribution System for Power Loss Minimization and Voltage Control.” Smart Science (2022): 1–21.
[41] Hemmatpour, Mohammad Hasan. “Optimum interconnected islanded microgrids operation with high levels of renewable energy.” Smart Science 7.1 (2019): 47–58.
[42] Mahdad, Belkacem. “Novel Adaptive Sine Cosine Arithmetic Optimization Algorithm For Optimal Automation Control of DG Units and STATCOM Devices.” Smart Science (2022): 1–22.
[43] Rajendran, Arulraj, and Kumarappan Narayanan. “Multi-Objective Hybrid WIPSO–GSA Algorithm-Based DG and Capacitor Planning for Reduction of Power Loss and Voltage Deviation in Distribution System.” Smart Science 6.4 (2018): 295–307.
[44] Srinivasarathnam, C., Chandrasekhar Yammani, and Sydulu Maheswarapu. “Multi-objective jaya algorithm for optimal scheduling of DGs in distribution system sectionalized into multi-microgrids.” Smart Science 7.1 (2019): 59–78.
[45] Bohre, Aashish Kumar, Parimal Acharjee, and Yashwant Sawle. “Analysis of grid connected hybrid micro-grid with different utility tariffs.” 2021 1st International Conference on Power Electronics and Energy (ICPEE). IEEE, 2021.
Biographies

Bikash Kumar Saw received the B.E. degree in Electrical & Electronics Engineering from the Rajiv Gandhi Proudyogiki Vishwavidyalaya, Bhopal, India, in 2012, the M.Tech. degree in Electrical Engineering from the Indian Institute of Technology (Indian School on Mines) Dhanbad, India, in 2016. Presently he is working toward Ph.D. degree from the National Institute of Technology Durgapur, India, in Electrical Engineering. He has four and half years of teaching experience. His current research interests include distributed generation, FACTS devices, plug-in electric vehicles, optimization technique applications in distribution system planning, and smart grid.

Aashish Kumar Bohre (MEMIEEE500) received M.Tech. and Ph.D. from Maulana Azad National Institute of Technology Bhopal, India in 2011 and 2016, respectively. Presently he is an Assistant Professor in the Department of Electrical Engineering, National Institute of Technology Durgapur, India. His research interests include distribution system planning, distributed generation, power system optimization & control, renewable generation, voltage security and stability analysis, electric vehicle, and application of optimization techniques for power system problems.

Jalpa Thakkar is working as an Associate Professor in Electrical Engineering Department at UPL University of Sustainable Technology in India. She has done Masters in Electrical Power System Engineering with Gold Medal from Gujarat Technological University and PhD in Electrical Power Transmission Management. She has more than a decade of Experience in Academics and Research in the Field of Electrical Engineering.

Mohan Lal Kolhe is currently a Full Professor of smart grid and renewable energy at the Faculty of Engineering and Science, University of Agder, Norway. He is a leading renewable energy technologist with three decades of the academic experience at an international level. He has held various academic positions at prestigious universities. He has successfully won competitive research funding from the prestigious research councils (e.g., Norwegian Research Council, EU, EPSRC, BBSRC, NRP, etc.) for his work on sustainable energy systems. His research work in energy system have been recognized within the top 2% of scientists globally by Stanford University’s 2020, 2021 matrices.
Distributed Generation & Alternative Energy Journal, Vol. 38_5, 1585–1608.
doi: 10.13052/dgaej2156-3306.38510
© 2023 River Publishers